Lecture
Value tables
Table A.1
Function value 
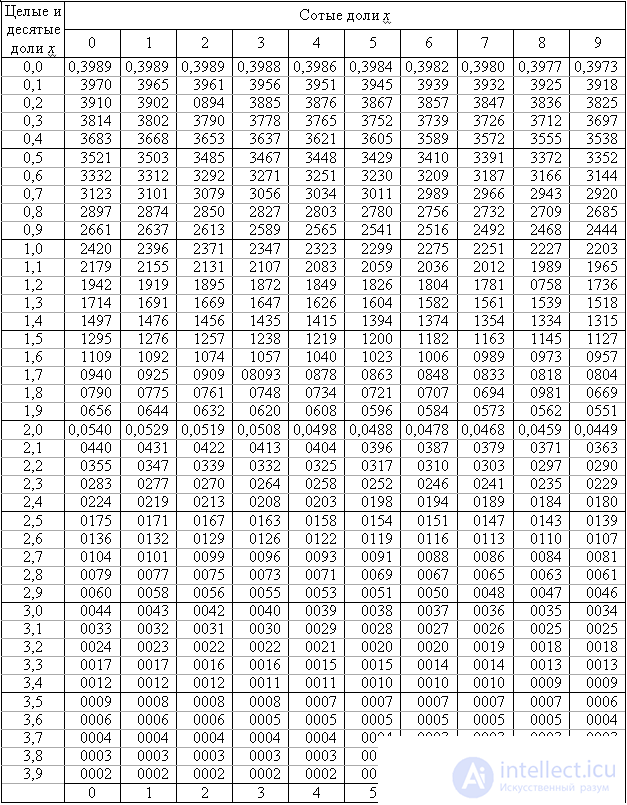
Table A.2 Function
values 
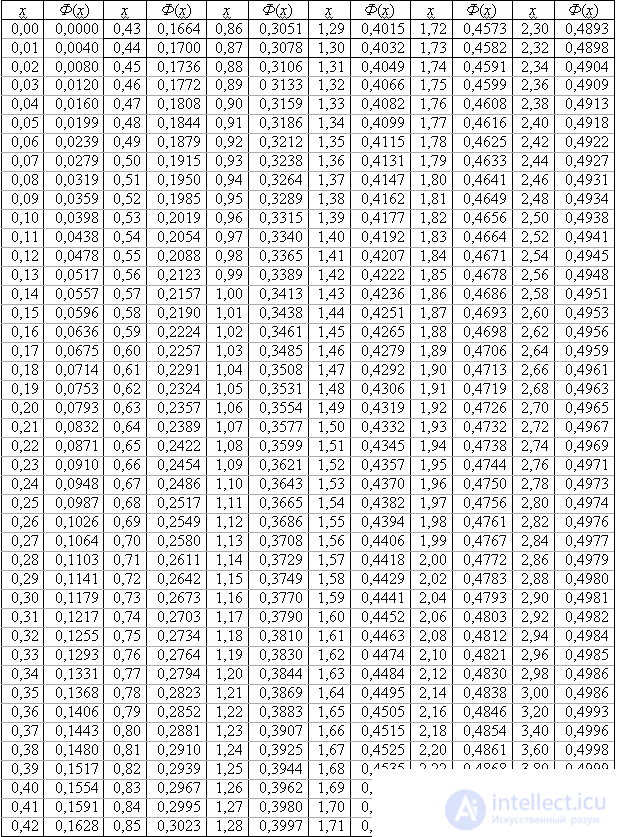
Table A.3
Table of values t γ = (γ, n )
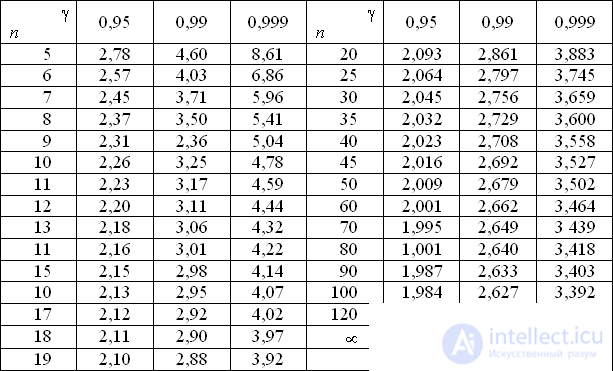
Table A.4
Table of values q = q (γ, n )
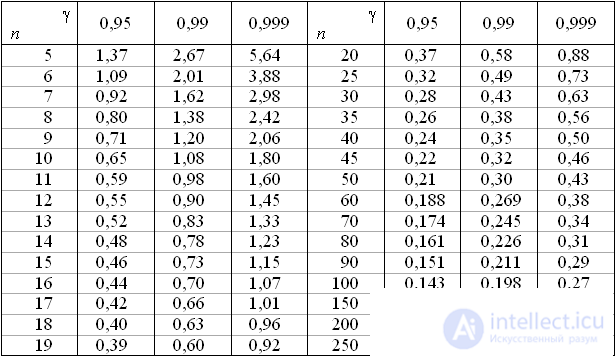
Table A.5
Critical distribution points χ 2
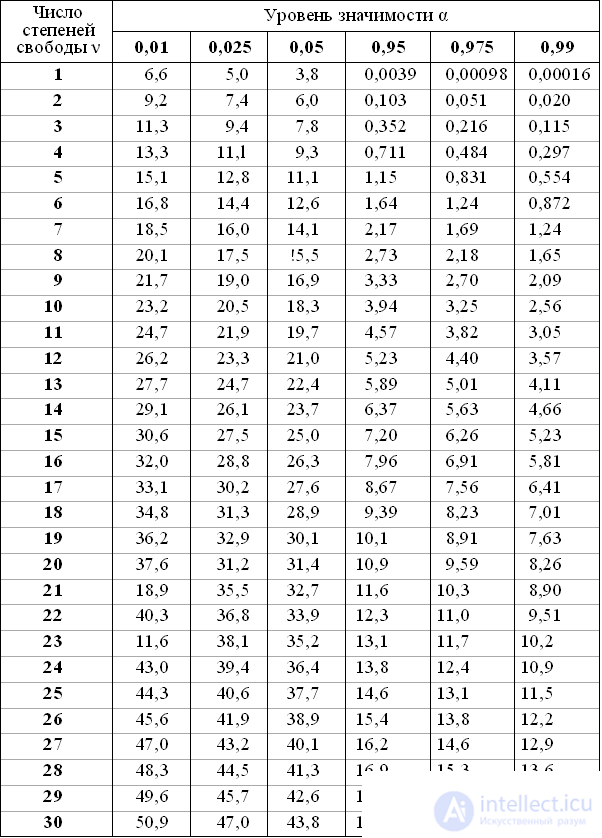
Table P.6
Critical points of student 's distribution
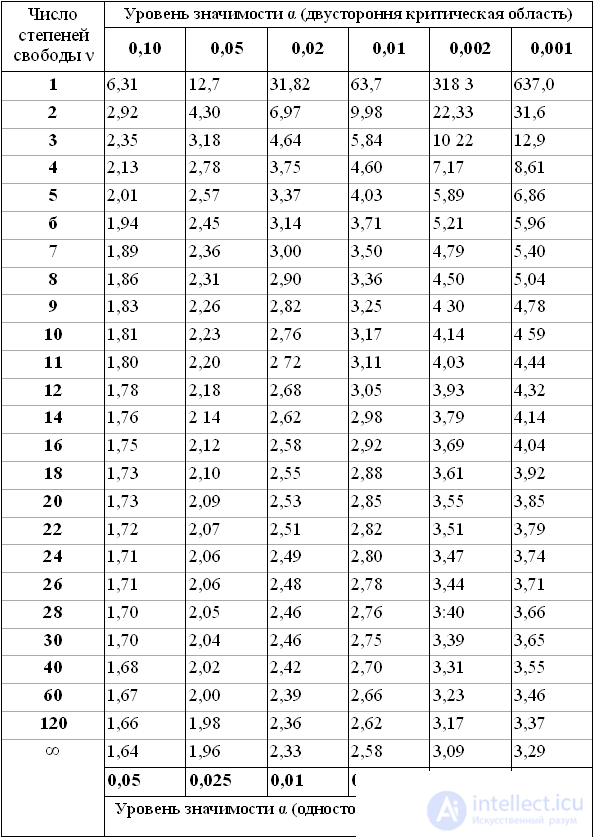
Table P.7
Critical points of distribution F of Fisher – Snedecor
(ν 1 –number of degrees of freedom of greater dispersion,
ν 2The number of degrees of freedom at variance)
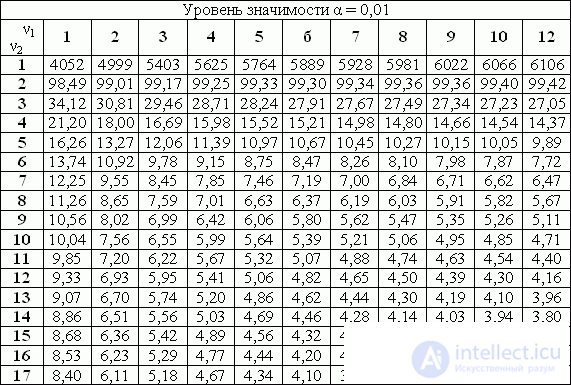
TABLE A8
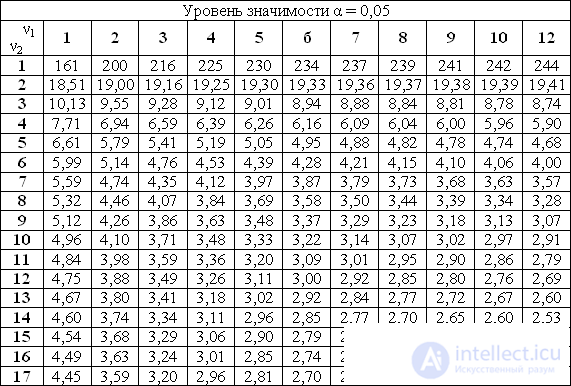
Table A.9
Fischer Conversion 
(determination of Z value of the correlation coefficient r )
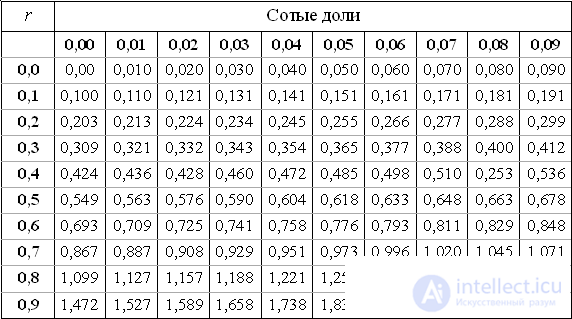
Table A10
inverse Fisher transformation
(definition of the correlation coefficient r by the value Z)
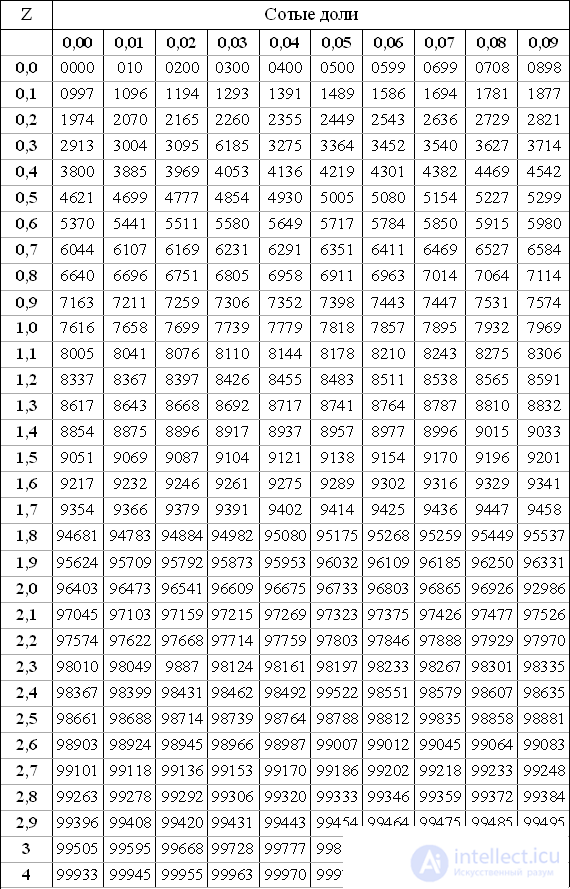
Note. In the values of r, zero and comma are omitted.
Comments
To leave a comment
Probability theory. Mathematical Statistics and Stochastic Analysis
Terms: Probability theory. Mathematical Statistics and Stochastic Analysis