Lecture
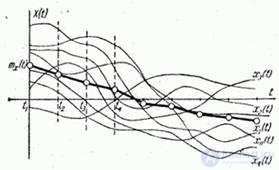
Let over a random function  produced
  independent experiments (observations) and the result was
  realizations of a random function (Fig. 15.4.1).

Fig. 15.4.1.
Required to find estimates for the characteristics of a random function: its expectation  dispersions
  and correlation function
  .
.
To do this, consider a series of sections of a random function for the moments of time.

and register the values accepted by the function  at these times. To each of the moments
  will fit
  values of a random function.
Meanings  usually given equidistant; the value of the interval between adjacent values is selected depending on the type of experimental curves so that the selected course can be restored from selected points. It often happens that the interval between adjacent values
  it is set independently of the processing tasks of the frequency of the recording device (for example, the speed of a camera).
Registered Values  are entered into a table, each row of which corresponds to a specific implementation, and the number of columns is equal to the number of reference values of the argument (Table 15.4.1).
Table 15.4.1
|
|
|
|
|
|
|
|
|
|
|
|
|
|
|
|
|
|
|
|
|
|
|
|
|
|
|
|
|
|
|
|
|
|
|
|
|
|
|
|
|
|
|
|
|
|
|
|
|
|
|
|
|
|
|
|
|
|
|
|
|
|
|
In table 15.4.1 in  line contains the values of the random function observed in
  implementation (
  m experience) with argument values
  . Symbol
  indicated value corresponding to
  implementation at the moment
  .
.
The resulting material is nothing but results.  experiments on the system
  random variables
 ,
,
and is processed quite similarly (see  14.3). First of all, there are estimates for the mathematical expectation of the formula
 , (15.4.1)
then for dispersions
 (15.4.2)
and finally for the correlation moments
 . (15.4.3)
In some cases, it is convenient when calculating estimates for variances and correlation moments to use the connection between the initial and central moments and calculate them using the formulas:
 ; (15.4.4)
 . (15.4.5)
When using the latest versions of the formulas, in order to avoid the difference of close numbers, it is recommended to move the origin in advance on the ordinate axis closer to the mathematical expectation.
After these characteristics are calculated, you can, using a number of values  build dependency
  (fig. 15.4.1). Similarly built dependency
  . The function of two arguments
  reproduced by its values in a rectangular grid of dots. If necessary, all these functions are approximated by any analytical expressions.
Comments
To leave a comment
Probability theory. Mathematical Statistics and Stochastic Analysis
Terms: Probability theory. Mathematical Statistics and Stochastic Analysis