Lecture
In some cases, from the point of view of simplicity of mathematical transformations, it turns out to be convenient to use not the real, but the complex form of recording both the spectral decomposition of a random function and its characteristics: spectral density and correlation function. The complex form of writing is convenient, in particular, because all sorts of linear operations on functions that have the form of harmonic oscillations (differentiation, integration, solving linear differential equations, etc.) are much easier when these harmonic oscillations are not written as sines. and cosines, and in a complex form, in the form of exponential functions. The complex form of recording the correlation function and spectral density is also used in cases where the random function itself (and, consequently, its correlation function and spectral density) is valid.
We show how it is possible in the spectral decomposition of a random function to go purely formally from a real form to a complex one.
Consider the spectral decomposition (17.2.8) of a random function  Location on
  :
:
 , (17.4.1)
Where  ,
,  - uncorrelated random variables, and for each pair
  ,
,  with the same dispersion indices are:
 .
.
Considering that  ;
;  , we rewrite expression (17.4.1) in the form:
 . (17.4.2)
We give the spectral decomposition (17.4.2) a complex form. To do this, we use the well-known Euler formulas:
 ;
;
 .
.
Substituting these expressions into the formula (17.4.2), we have:
 , (17.4.3)
i.e. decomposition with coordinate functions  .
.
Let us transform the decomposition (17.4.3) so that only functions can appear as coordinate functions in it  , for this we conditionally extend the frequency range
  to negative values
  and as frequencies of spectral decomposition we will consider the values

 ,
,
i.e. we will assume that  accepts not only positive, but also negative values. Then the formula (17.4.3) can be rewritten in the form:
 , (17.4.4)
if put
 ;
;  .
.
Formula (17.4.4) is a decomposition of a random function  in which complex functions appear as coordinate functions
  , and the coefficients are complex random variables. Denoting these complex random variables
 let's add the decomposition (17.4.4) to the form:
 , (17.4.5)
Where
 (17.4.6)
We prove that the decomposition (17.4.5) is the canonical decomposition of the random function  . To do this, it is sufficient to show that the random coefficients of this expansion are not correlated with each other.
We first consider the coefficients of two different terms of the expansion in the positive part of the spectrum  and
and  at
at  ,
,  ,
,  and determine the correlation moment of these quantities. According to the definition of the correlation moment for complex random variables (see
  15.9) we have:
 ,
,
Where  - complex conjugate value for
  .
.
With  ,
, 

 ,
,
as random variables  ,
,  appearing in the decomposition (17.4.1), all are not correlated with each other.
In exactly the same way, we prove the uncorrelated values  ,
,  with any signs of indices
  and
and  , if a
  .
.
It remains to prove only the uncorrelated coefficients for symmetric expansion terms, i.e.  and
and  at any
  . We have:

 .
.
Given that the values  ,
,  the members of the same expansion term (17.4.1) are not correlated and have the same dispersions
  , we get:
 .
.
Thus, it is proved that the decomposition (17.4.5) is nothing more than a canonical decomposition of a random function  with complex coordinate functions
  and complex coefficients
  .
.
Find the variance of these coefficients. With  dispersion
  obviously remained the same as it was with the actual form of the spectral decomposition. Dispersion of each of the complex values
  (at
(at  ) is equal to the sum of the variances of its real and imaginary parts:
 .
.
We introduce the notation:
 at
at  ;
;  at
at 
and build a discrete spectrum of a random function  common to frequencies from
  before
  (fig. 17.4.1).
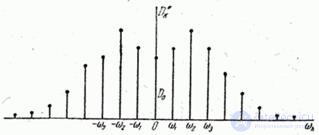
Fig. 17.4.1.
This spectrum is symmetric about the ordinate; it differs from the previously constructed spectrum (Fig. 17.2.3) in that it is defined not only for positive, but also for negative frequencies, but its ordinates at  half the corresponding ordinates of the former spectrum; the sum of all ordinates is still equal to the variance of the random function
  :
:
 . (17.4.7)
Define the correlation function of a random function  presented in the form of a complex spectral decomposition (17.4.5). Applying formula (16.2.15) for the correlation function of a complex random function given by canonical decomposition, we have:
 ,
,
or moving on to the argument  ,
,
 , (17.4.8)
Where
 at
at  . (17.4.9)
Let's add to the expression (17.4.9) also a complex form. Putting
 ,
,
we will receive:
 .
.
Assuming in the second integral  , we have:
 ,
,
from where
 . (17.4.10)
Thus, we constructed a complex form of the spectral decomposition of a random function on a finite interval  ). Further, it is natural to pass to the limit at
  as we did for the real form, i.e., to introduce into consideration the spectral density

and to obtain in the limit from formulas (17.4.8), (17.4.10) integral relations connecting the correlation function and the spectral density in a complex form. In the limit at  formulas (17.4.8) and (17.4.10) take the form:
 , (17.4.11)
 . (17.4.12)
Formulas (17.4.11) and (17.4.12) are a complex form of Fourier transforms connecting the correlation function and the spectral density.
Formulas (17.4.11) and (17.4.12) can be directly obtained from formulas (17.3.9) and (17.3.10), if they are replaced by
 ,
,
put  and extend the integration domain by interval from
  before
  .
.
Assuming in the formula (17.4.11)  , we obtain the expression of the variance of the random function
  :
:
 . (17.4.13)
Formula (17.4.13) expresses the variance of a random function as a sum of elementary dispersions distributed with a certain density over the entire frequency range from  before
  .
.
Comparing the formula (17.4.13) and the previously derived (for the actual form of the spectral decomposition) formula (17.3.2), we see that they differ only in that in the formula (17.4.13) there is a slightly different function of the spectral density  specified not from 0 to
  and from
  before
  , but with half the ordinates. If we depict both functions of the spectral density on the graph, they differ only in the scale along the ordinate axis and in that the function
  for negative frequencies not defined (fig. 17.4.2). In practice, both functions are used as spectral density.
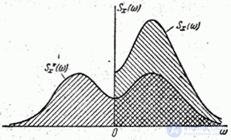
Fig. 17.4.2.
Sometimes as an argument of the spectral density is considered not a circular frequency (  ), and the oscillation frequency
  expressed in hertz:
 .
.
In this case, the substitution  formula (17.4.11) is given to the form:
 ,
,
or by entering the designation
 ,
,
 . (17.4.14)
Function  can also be used as the spectral density of the dispersion. Its expression through the correlation function obviously has the form:
 . (4/17/15)
All the expressions of spectral density that we used in practice and some other ones used in practice obviously differ from each other only in scale. Each of them can be normalized by dividing the corresponding spectral density function by the variance of the random function.
Example 1. Correlation function of a random function  given by the formula:
 (17.4.16)
Where  (fig. 17.4.3).
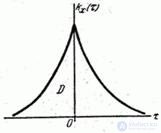
Fig. 17.4.3.
Using the complex form of the Fourier transform, determine the spectral density  .
.
Decision. By the formula (17.4.12) we find:


 .
.
График спектральной плотности

presented in fig. 17.4.4.
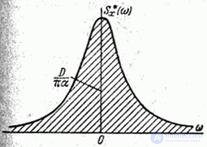
Fig. 17.4.4.
Посмотрим, как будут вести себя корреляционная функция и спектральная плотность при изменении  .
.
При уменьшении  корреляционная функция будет убывать медленнее; характер изменения случайной функции становится более плавным; соответственно в спектре случайной функции больший удельный вес приобретают малые частоты: кривая спектральной плотности вытягивается вверх, одновременно сжимаясь с боков; в пределе при
  случайная функция выродится в обычную случайную величину с дискретным спектром, состоящим из единственной линии с частотой
  .
.
By increasing  корреляционная функция убывает быстрее, характер колебаний случайной функции становится более резким и беспорядочным; соответственно этому в спектре случайной функции преобладание малых частот становится все менее выраженным; at
  спектр случайной функции приближается к равномерному (так называемому «белому») спектру, в котором нет преобладания каких-либо частот.
Пример 2. Нормированная корреляционная функция случайной функции  has the form:

(рис. 17.4.5).
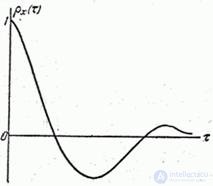
Fig. 17.4.5.
Определить нормированную спектральную плотность.
Decision. Представляем  в комплексной форме:
 .
.
Нормированную спектральную плотность  находим по формуле (17.4.12), подставляя в нее
  instead
  :
:

 ,
,
откуда после элементарных преобразований получаем:
 .
.
Вид графика спектральной плотности зависит от соотношения параметров  and
and  , т. е. от того, что преобладает в корреляционной функции: убывание по закону
  или колебание по закону
  .Obviously, with relatively small
  oscillation prevails, with relatively large
  - decreasing. In the first case, the random function is close to periodic frequency oscillations
  with a random amplitude and phase; accordingly, frequencies close to the frequency dominate in the spectrum of a random function
 .In the second case, the spectral composition of the random function is more uniform, the predominance of those silt and other frequencies is not observed; in the limit, when the
  spectrum of the random function approaches the “white” spectrum.
As an illustration in fig. 17.4.6 shows the normalized spectral density for the cases:
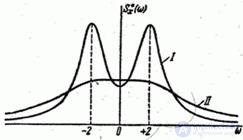
Fig. 17.4.6.
one)  ,
,  (curve
  ); 2)
); 2)  ,
,  (curve
  ).As can be seen from the drawing, when the
  spectrum of a random function detects a pronounced maximum in the frequency range
 . With
  (curve
  ) spectral density in a significant range of frequencies remains almost constant.
Comments
To leave a comment
Probability theory. Mathematical Statistics and Stochastic Analysis
Terms: Probability theory. Mathematical Statistics and Stochastic Analysis