Lecture
The issues related to the processing of the experiments discussed in this chapter are closely related to the question of smoothing out experimental dependencies.
Let an experiment be made, the purpose of which is to study the dependence of a certain physical quantity  from physical quantity
  (for example, the dependence of the path traveled by the body, on time; the initial velocity of the projectile on the temperature of the charge; lift force on the angle of attack, etc.). It is assumed that the values
  and
and  linked by functional dependence:
 . (14.8.1)
The type of this dependence is required to be determined from experience.
Suppose that as a result of the experiment we obtained a number of experimental points and plotted the dependence  from
from  (fig. 14.8.1). Usually, the experimental points on such a graph are not arranged in exactly the right way - they give some “scatter”, that is, they detect random deviations from a visible general pattern.
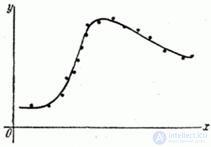
Fig. 14.8.1.
These deviations are associated with measurement errors that are inevitable with every experience.
The question arises of how best to reproduce the dependence on these experimental data.  from
from  ?
?
It is known that through any  points with coordinates
  you can always draw a curve expressed analytically by a polynomial of degree
  so that it passes exactly through each of the points (fig. 14.8.2).
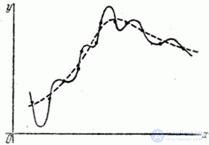
Fig. 14.8.2.
However, such a solution to the problem is usually not satisfactory: as a rule, the irregular behavior of experimental points, similar to that shown in Fig. 14.8.1 and 14.8.2, is not related to the objective nature of dependence  from
from  , but only with measurement errors. This is easy to detect by comparing observed deviations (spread of points) with roughly known errors in instrumentation.
Then there is a very typical practice problem of smoothing the experimental dependence. It is desirable to process the experimental data so as to reflect the general trend of dependence as accurately as possible.  from
from  but at the same time smooth irregular, random deviations due to the inevitable errors of the observation itself.
To solve such problems, a computational method commonly known as the “least squares method” is usually used. This method allows for a given type of dependency  so choose its numeric parameters to curve
  In a sense, the best way to display the experimental data.
Let us say a few words about the reasons for the type of curve  . Often this issue is solved directly by the appearance of experimental dependence. For example, the experimental points shown in Fig. 14.8.3, clearly suggest a straight line dependence
  .
.
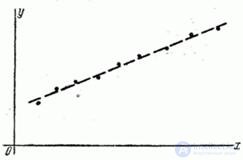
Fig. 14.8.3.
The dependence shown in Fig. 14.8.4, well can be represented by a polynomial of the second degree  .
.
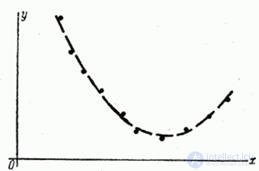
Fig. 14.8.4.
If we are talking about a periodic function, it is often possible to choose several harmonics of a trigonometric series for its image, etc.
It often happens that the type of dependence (linear, quadratic, exponential, etc.) is known from physical considerations related to the essence of the problem to be solved, and from experience only some parameters of this dependence need to be established.
The problem of the rational choice of such numerical parameters for this type of dependence we will solve in the present  .
.
Let there be results  independent experiments, designed in the form of a simple statistical table (table. 14.8.1), where
  - number of experience;
  - the value of the argument;
  - the corresponding value of the function.
Table 14.8.1
|
|
|
|
|
|
|
|
|
|
|
|
|
|
|
|
|
|
|
|
|
Points  plotted on the chart (Fig. 14.8.5).
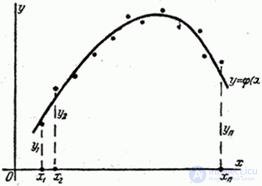
Fig. 14.8.5.
From theoretical or other considerations, the principle form of dependence is chosen.  . Function
  contains a series of numeric parameters
  . It is required to select these parameters so that the curve
  in a sense, it best depicted the dependence obtained in the experiment.
The solution to this problem, like any leveling or smoothing problem, depends on what we agree to be considered the “best”. You can, for example, consider the “best” such mutual arrangement of the curve and experimental points, at which the maximum distance between them turns to a minimum; it is possible to require that the sum of absolute values of deviations of points from a curve, etc., be addressed to the minimum, etc. With each of these requirements we will get our solution to the problem, our values of the parameters  .
.
However, the so-called least squares method, which requires the best fit of a curve, is generally accepted when solving such problems.  and experimental points is reduced to ensure that the sum of the squares of the deviations of the experimental points from the smoothing curve turns to a minimum. The method of least squares has significant advantages over other smoothing methods: firstly. it leads to a relatively simple mathematical method for determining parameters
  ; secondly, he admits a rather weighty theoretical substantiation from a probabilistic point of view.
We present this rationale. Suppose true dependency  from
from  exactly expressed by the formula
  ; experimental points shy away from this dependence due to unavoidable measurement errors. We have already mentioned that measurement errors, as a rule, are subject to normal law. Assume that it is. Consider some argument value
  . The result of the experience is a random variable.
  distributed according to the normal law with the expectation
  and with standard deviation
  characterizing the measurement error. Suppose that the measurement accuracy at all points is the same:
 .
.
Then the normal law on which the value is distributed  can be written in the form:
 . (14.8.2)
As a result of our experience - a series of measurements - the following event occurred: random variables  took a set of values
  . We set the task: so pick up the mathematical expectations
  so that the probability of this event is maximum.
Strictly speaking, the probability of any of the events  , as well as their combination, is equal to zero, since the values
  continuous; so we will use no probabilities of events
  , and the corresponding elements of probability:
 . (14.8.3)
Find the probability that the system of random variables  will take a set of values lying within

 .
.
Since the experiments are independent, this probability is equal to the product of probability elements (14.8.3) for all values  :
:
 (14.8.4)
Where  - some coefficient not depending on
  .
.
It is required to choose the mathematical expectations  so that the expression (14.8.4) turns to a maximum.
Magnitude

always less than one; obviously, it has the greatest value when the exponent in absolute magnitude is minimal:
 .
.
From here, rejecting the constant multiplier  , we obtain the requirement of the method of least squares: in order for a given set of observed values

was the most probable, you need to select a function  so that the sum of the squares of the deviations of the observed values
  from
from  was minimal:
 .
.
Thus, the least squares method is justified on the basis of the normal law of measurement errors and the requirement of the maximum probability of a given set of errors.
Let us turn to the problem of determining the parameters  based on the principle of least squares. Let there be a table of experimental data (Table 14.8.1) and let some considerations (related to the essence of the phenomenon or simply to the appearance of the observed dependence) be selected
  depending on several numeric parameters
  ; It is these parameters that need to be chosen according to the least squares method so that the sum of the squares of the deviations
  from
from  was minimal. Write
  as a function of not only an argument
  but also parameters
  :
:
 (14 8.5)
Required to choose  так, чтобы выполнялось условие:
 . (14.8.6)
Найдем значения  , обращающие левую часть выражения (14.8.6) в минимум. Для этого продифференцируем ее по
  и приравняем производные нулю:
 (14.8.7)
Where  - значение частной производной функции
  по параметру
  at the point
  ,
,  - аналогично.
Система уравнений (14.8.7) содержит столько же уравнений, сколько неизвестных  .
.
Решить систему (14.8.7) в общем виде нельзя; для этого необходимо задаться конкретным видом функции  .
.
Рассмотрим два часто встречающихся на практике случая: когда функция  линейна и когда она выражается полиномом второй степени (параболой).
1. Подбор параметров линейной функции методом наименьших квадратов
В опыте зарегистрирована совокупность значений 
 (см. рис. 14.8.6).
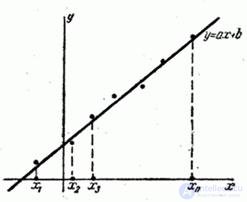
Fig. 14.8.6.
Требуется подобрать по методу наименьших квадратов параметры  линейной функции
 ,
,
изображающей данную экспериментальную зависимость.
Decision. We have:
 . (14.8.8)
Дифференцируя выражение (14.8.8) по  and
and  , we have:


Подставляя в формулы (14.8.7), получим два уравнения для определения  and
and  :
:
 ,
,
 ,
,
или, раскрывая скобки и производя суммирование,
 (14.8.9)
Разделим оба уравнения (14.8.9) на  :
:
 (14.8.10)
Суммы, входящие в уравнения (14.8.10), представляют собой не что иное, как уже знакомые нам статистические моменты:


Подставляя эти выражения в систему (14.8.10), получим:
 (14.8.11)
Выразим  из второго уравнения (14.8.11) и подставим в первое:
 ;
;
 .
.
Решая последнее уравнение относительно  , we have:
 . (14.8.12)
Выражение (14.8.12) можно упростить, если ввести в него не начальные, а центральные моменты. Really,
 ,
,  ,
,
from where
 ;
;  , (14.8.13)
Where
 (14.8.14)
Таким образом, поставленная задача решена, и линейная зависимость, связывающая  and
and  , имеет вид:
 ,
,
или, перенося  в левую часть,
 . (14.8.15)
Мы выразили коэффициенты линейной зависимости через центральные, а не через начальные вторые моменты только потому, что в таком видe формулы имеют более компактный вид. При практическом применении выведенных формул может оказаться удобнее вычислять моменты  and
and  не по формулам (14.8.14), а через вторые начальные моменты:
 (14.8.16)
Для того чтобы формулы (14.8.16) не приводили к разностям близких чисел, рекомендуется перенести начало отсчета в точку, не слишком далекую от математических ожиданий  ,
,  .
.
2. Подбор параметров параболы второго порядка методом наименьших квадратов
В опыте зарегистрированы значения 
 (см. рис. 14.8.7).
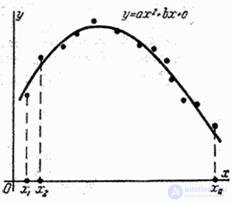
Fig. 14.8.7.
Требуется методом наименьших квадратов подобрать параметры квадратичной функции - параболы второго порядка:
 ,
,
соответствующей наблюденной экспериментальной зависимости. We have:
 ,
,
 ;
;  ;
;
 ;
;  ;
;
 ;
;  .
.
Подставляя в уравнения (14.8.7), имеем:
 ,
,
 ,
,

или, раскрывая скобки, производя суммирование и деля на  ,
,
 (14.8.17)
Коэффициенты этой системы также представляют собой статистические моменты системы двух величии  , а именно:
 ;
;  ;
;
 ;
;  ;
;  ;
;
 ;
;  .
.
Пользуясь этими выражениями для коэффициентов через начальные моменты одной случайной величины и системы двух величин, можно придать системе уравнений (14.8.7) достаточно компактный вид. Действительно, учитывая, что  ;
;  и перенося члены, не содержащие неизвестных, в правые части, приведем систему (14.8.17) к виду:
 (14.8.18)
Закон образования коэффициентов в уравнениях (14.8.18) нетрудно подметить: в левой части фигурируют только моменты величины  в убывающем порядке; в правой части стоят моменты системы
  , причем порядок момента по
  убывает от уравнения к уравнению, а порядок по
  всегда остается первым.
Аналогичными по структуре уравнениями будут определяться коэффициенты параболы любого порядка.
Мы видим, что в случае, когда экспериментальная зависимость выравнивается по методу наименьших квадратов полиномом некоторой степени, то коэффициенты этого полинома находятся решением системы линейных уравнений. Коэффициенты этой системы линейных уравнений представляют собой статистические моменты различных порядков, характеризующие систему величии  , если ее рассмотреть как систему случайных величин.
Почти так же просто решается задача сглаживания экспериментальной зависимости методом наименьших квадратов в случае, когда сглаживающая функция представляет собой не полином, а сумму произвольных заданных функций  с коэффициентами
  :
:
 , (14.8.19)
и когда требуется определить коэффициенты  .
.
Например, экспериментальную зависимость можно сглаживать тригонометрическим полиномом

or linear combination of exponential functions
 ,
,
etc.
If the function is given by an expression of the type (14.8.19), the coefficients  are found by solving a system of
  linear equations of the form:
 ,
,
 ,
,
 ,
,
 .
.
Performing term-by-word summation, we have:
 ,
,
 ,
,
 ,
,
 ,
,
or shorter
 (14.8.20)
The system of linear equations (14.8.20) can always be solved and thus the coefficients  .
.
The least squares smoothing problem is more difficult to solve if the  numeric parameters
  enter the function expression nonlinearly. Then the solution of system (14.8.7) can be difficult and time consuming. However, in this case, it is often possible to obtain a solution to the problem using relatively simple techniques.
We illustrate the idea of these techniques on the simplest example of a function that depends nonlinearly on only one parameter.  (eg,
(eg,  or
or  , or
, or  ). We have:
 (14.8.21)
Where  - параметр, подлежащий подбору методом наименьших квадратов для наилучшего сглаживания заданной экспериментальной зависимости (рис. 14.8.8).
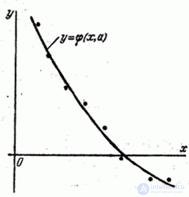
Fig. 14.8.8.
Будем решать задачу следующим образом. Зададимся рядом значений параметра  и для каждого из них найдем сумму квадратов уклонений
  from
from  . Эта сумма квадратов есть некоторая функция
  ; обозначим ее
  :
:
 .
.
Нанесем значение  на график (рис. 14.8.9).
То значение  , для которого кривая
  имеет минимум, и выбирается как подходящее значение параметра
  в выражении (14.8.21).
Совершенно так же, в принципе, можно, не решая уравнений (14.8.7), подобрать совокупность двух параметров  , удовлетворяющую принципу наименьших квадратов; работа при этом лишь незначительно усложнится и сведется к построению не одного, а нескольких графиков (рис. 14.8.10); при этом придется искать совокупность значений
  , обеспечивающую минимум минимального значения суммы квадратов отклонений
  .
.
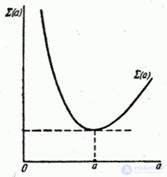
Fig. 14.8.9.
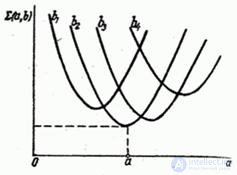
Fig. 14.8.10.
Пример1. В опыте исследована зависимость глубины проникания  тела в преграду от удельном энергии
  (энергии, приходящейся на квадратный сантиметр площади соударения). Экспериментальные данные приведены в таблице 14.8.2 и на графике (рис. 14.8.11).
Таблица 14.8.2.
|
|
|
one | 41 | four |
2 | 50 | eight |
3 | 81 | ten |
four | 104 | 14 |
five | 120 | sixteen |
6 | 139 | 20 |
7 | 154 | nineteen |
eight | 180 | 23 |
9 | 208 | 26 |
ten | 241 | thirty |
eleven | 250 | 31 |
12 | 269 | 36 |
13 | 301 | 37 |
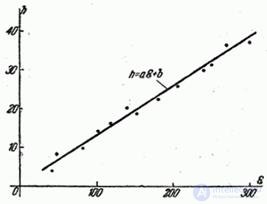
Fig. 14.8.11.
Требуется по методу наименьших квадратов подобрать и построить прямую, изображающую зависимость  from
from  .
.
Decision. We have:
 ,
,  .
.
Для обработки по начальным моментам переносим начало координат в близкую к средней точку:
 ;
;  .
.
Получаем новую таблицу значений величин:
 ;
; 
(табл. 14.8.3).
Таблица 14.8.3.
|
|
|
one | -109 | -sixteen |
2 | -100 | -12 |
3 | -69 | -ten |
four | -46 | -6 |
five | -thirty | -four |
6 | -eleven | 0 |
7 | four | -one |
eight | thirty | 3 |
9 | 58 | 6 |
ten | 91 | ten |
eleven | 100 | eleven |
12 | 119 | sixteen |
13 | 151 | 17 |
Определяем моменты:
 ;
;
 ;
;
 ;
;
 .
.
Уравнение прямой имеет вид:
 ,
,
or
 . (14.8.22)
Прямая (14.8.22) показана на рис. 14.8.11.
Пример 2. Произведен ряд опытов по измерению перегрузки авиационной бомбы, проникающей в грунт, при различных скоростях встречи. Полученные значения перегрузки  в зависимости от скорости
  приведены в таблице 14.8.4.
Таблица 14.8.4.
|
|
|
one | 120 | 540 |
2 | 131 | 590 |
3 | 140 | 670 |
four | 161 | 760 |
five | 174 | 850 |
6 | 180 | 970 |
7 | 200 | 1070 |
eight | 214 | 1180 |
9 | 219 | 1270 |
ten | 241 | 1390 |
eleven | 250 | 1530 |
12 | 268 | 1600 |
13 | 281 | 1780 |
14 | 300 | 2030 |
Построить по методу наименьших квадратов квадратичную зависимость вида:
 ,
,
наилучшим образом согласующуюся с экспериментальными данными.
Decision. For convenience of processing, it is convenient to change the units of measurement so as not to deal with multi-digit numbers; for this you can value  Express in hundreds of meters per second (multiply by
  ), but
  - in thousands of units (multiplied by
  ) and all processing is carried out in these conventional units.
Find the coefficients of equations (14.8.18).
In the accepted conventional units:
 ;
;
 ;
;
 ;
;
 ;
;
 ;
;
 ;
;
 .
.
The system of equations (14.8.18) has the form:
 ,
,
 ,
,
 .
.
Solving this system, we find:
 ;
;  ;
;  .
.
In fig. 14.8.12 plotted experimental points and dependence
 ,
,
least squares method.
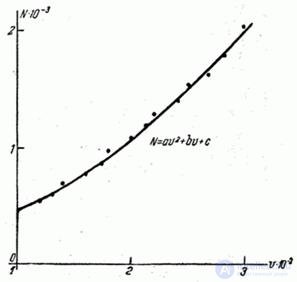
Fig. 14.8.12.
Note. In some cases, it may be necessary to draw a curve so that it accurately passes through some predetermined points. Then some of the numeric parameters  included in the function
  , can be determined from these conditions.
For example, in the conditions of example 2, it may be necessary to extrapolate the dependence  for small values
  , it is natural to hold a second order parabola so that it passes through the origin (i.e., zero meeting speed corresponds to zero meeting speed). Then naturally
  and addiction
  takes the form:
 ,
,
and the system of equations to determine  and
and  will look like:
 ,
,
 .
.
Example 3. Condenser charged to voltage  volt, discharged through some resistance. Voltage dependence
  between capacitor plates from time to time
  registered on the time interval of 10 seconds with an interval of 1 second. Voltage is measured to an accuracy of 5 volts. The measurement results are shown in table 14.8.5.
Table 14.8.5.
|
|
|
|
|
|
one | 0 | 100 | 7 | 6 | 15 |
2 | one | 75 | eight | 7 | ten |
3 | 2 | 55 | 9 | eight | ten |
four | 3 | 40 | ten | 9 | five |
five | four | thirty | eleven | ten | five |
6 | five | 20 |
According to theoretical data, the dependence of voltage on time should be of the form:
 .
.
Based on the experimental data, select the parameter value using the least squares method  .
.
Decision. By function tables  make sure that
  comes to about 0.05 at
  ; hence the coefficient
  must be of order 0.3. Ask in the area
  multiple meanings
  :
:

and calculate for them the function values

in points  (tab. 14.8.6). The bottom line of table 14.8.6 contains the values of the sum of squared deviations.
  depending on the
  .
.
Table 14.8.6.
|
|
|
|
|
|
|
|
one | 0 | 100.0 | 100.0 | 100.0 | 100.0 | 100.0 | 100.0 |
2 | one | 75.5 | 74.8 | 74.1 | 73.3 | 72.6 | 71.9 |
3 | 2 | 57.1 | 56.0 | 54.9 | 53,8 | 52.7 | 51.7 |
four | 3 | 43.2 | 41.9 | 40.7 | 39.5 | 38.3 | 37.2 |
five | four | 32.6 | 31.3 | 30.1 | 28.9 | 27.8 | 26.7 |
6 | five | 24.6 | 23.5 | 22.3 | 21.2 | 20.2 | 19.2 |
7 | 6 | 18.6 | 17.6 | 16.5 | 15.6 | 14.7 | 13.8 |
eight | 7 | 14.1 | 13.1 | 12.2 | 11.4 | 10.6 | 9.9 |
9 | eight | 10.7 | 9.8 | 9.1 | 8.4 | 7.7 | 7.1 |
ten | 9 | 8.0 | 7.4 | 6.7 | 6.1 | 5.6 | 5.1 |
eleven | ten | 6.1 | 5.5 | 5.0 | 4.5 | 4.1 | 3.7 |
| 83.3 | 40.3 | 17.4 | 13.6 | 25.7 | 51.4 |
Function graph  is shown in fig. 14.8.13.
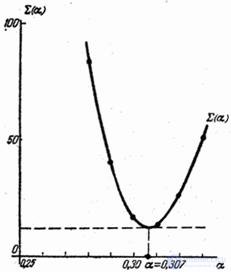
Fig. 14.8.13.
From the graph it is clear that the value  corresponding to the minimum is approximately 0.307. Thus, using the least squares method, the best approximation to the experimental data would be the function
  . The graph of this function together with the experimental points is given in fig. 14.8.14.
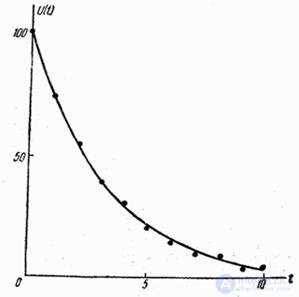
Fig. 14.8.14.
Comments
To leave a comment
Probability theory. Mathematical Statistics and Stochastic Analysis
Terms: Probability theory. Mathematical Statistics and Stochastic Analysis