Lecture
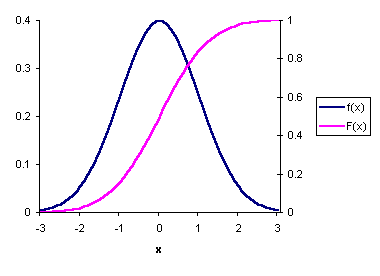
A normal distribution with zero expectation and unit variance is called the standard normal distribution . This is how the density and the distribution function look in this case.

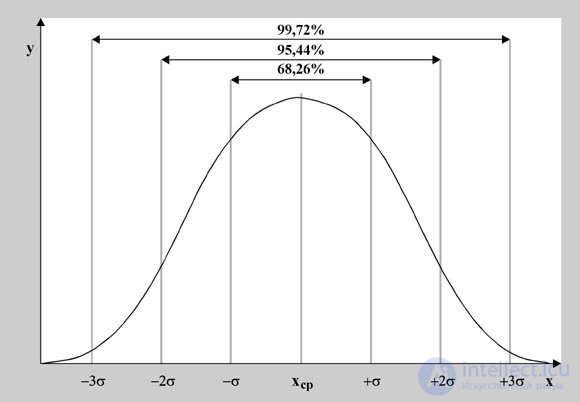
Above values, far from the mathematical expectation, were called "abnormal". Notice how the distribution strongly "concentrates" around one point.

The probability that a random value will be distant from the maximum point by more than three "sigma" is very close to zero, amounting to about 0.003. This fact is known as the three sigma rule .
Normal distribution or something close to it often takes place in a wide variety of practical areas. Because of that, it is called normal.
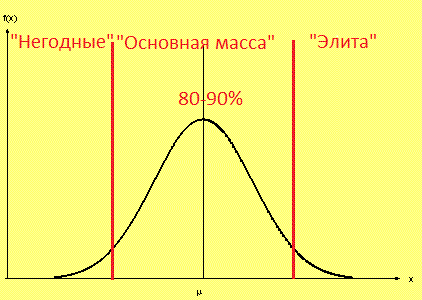
With reference to the social sphere, say, a normal distribution describes well the intelligence and knowledge of the population. 80-90% of the people are in the level of "mediocre", "so-so". Complete idiots (or almost complete) are in a severe minority, as are very smart people. This can be represented like this:

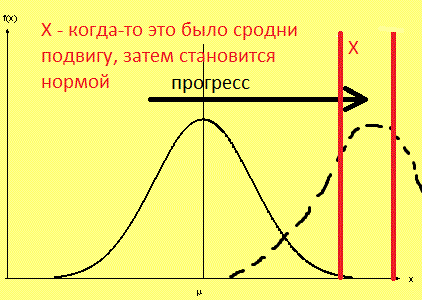
As a result of progressive changes in society (if they really take place), the "bell" shifts to the right:

What was once considered almost unreal and achieved by a few, can become the norm. And vice versa, what was previously enough and on which almost everything stopped, is no longer enough. What happens with the "rollback" and detrimental to society changes, guess yourself)
Let there be a summation of a large number of independent random variables (or dependent slightly) with close scales (no addendum makes a large contribution to the sum, an individual addendum, as it were, is not a "decisive force"). Then, according to the CLT, the sum is a random variable having a distribution close to the normal distribution .
What we have just said allows us to answer the question of how to model the normal distribution . We take n random (more precisely, pseudo-random numbers), obtained programmatically using a conventional random number sensor, which is in any development environment. Such sensors simulate a uniform distribution. Each of the n numbers must be in the same range (say, [0; 1]). Then the sum of n random numbers will be a random variable, the distribution of which can be considered normal for a sufficiently large n . If the range was selected [0; 1], then the expectation will be n / 2.
Comments
To leave a comment
Probability theory. Mathematical Statistics and Stochastic Analysis
Terms: Probability theory. Mathematical Statistics and Stochastic Analysis