Lecture
What is our life? Information!
And marketers need it more than others. Properly selected metrics help to navigate the endless information space. With their help, you can set goals and track progress towards their achievement. How to identify key metrics and understand a large array of information? Let's figure it out ... Internet marketers analyze the data collected and determine which metrics should be used as key. A detailed study of the results helps to understand what is better and draw the right conclusions.
Content
Blog traffic. Everyone wants to know how many visitors read your blog today, how many read yesterday or even a month ago. This indicator includes the total number of people who visit the blog.
How does this figure change with time? What is the percentage growth rate of this indicator from month to month? You can find out with this indicator.
The number of subscribers. The number of people who subscribe to your blog is an indicator of the value of your content to the audience. If the audience appreciates what you are writing about, then they often subscribe to your blog.
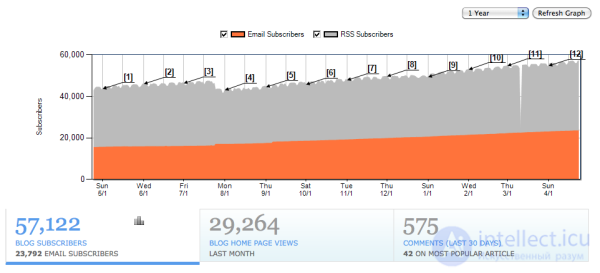
The number of post views. How many views does a separate post collect? Some posts are viewed more often, others - less. This metric will help you identify the most successful topics of publications. This is a guideline for what the content and presentation should be.
The number of comments. Material comments are a good indication of whether a post on a blog attracts the attention of an audience. You can warm up the discussion by asking additional questions at the end of the post to provoke a discussion.
The number of links to one post. Blogging is a crucial component in implementing your company's SEO strategy. Companies that run their own blogs get more backlinks than those that don't have blogs. Learn which of your posts give a greater number of inbound external links; Try to make similar content in the future.
Social media
The number of subscribers in social networks and audience coverage. Some internet marketers see their social network subscribers as e-mail subscribers. This is not true! In fact, you need to estimate what percentage of subscribers you can reach through social media channels. This metric will help answer the question, how does the reach of your audience change over time?
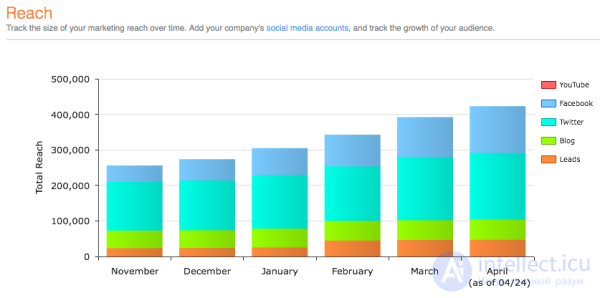
The number of clicks in social networks. Measure the number of clicks on social networks. This is a good way to calculate how much your content interests your audience, how your content is positioned and how much a wide audience can involve.
The number of retweets and publications on user pages. When people really like what you write, they willingly share this content in social networks. To find out how widely your content is distributed, track the number of retweets and re-postings.
The number of “Like” marks. Everyone likes to like it! This metric indicates how many people liked the content: as a sign of this, they put a “Like” mark or a “+1” button on Google+.
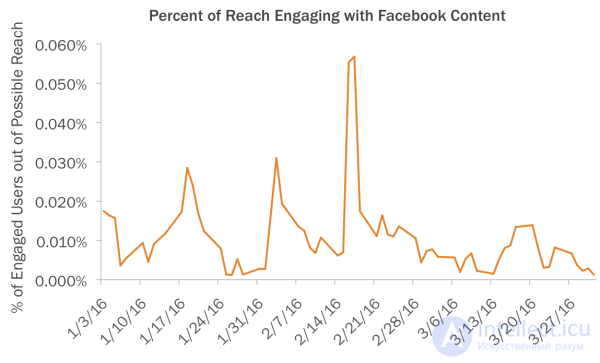
The percentage of users involved. See what percentage of all your friends and their friends are involved (clicks, comments, likes). This metric is good because it shows how many people pay attention to your content.
SEO
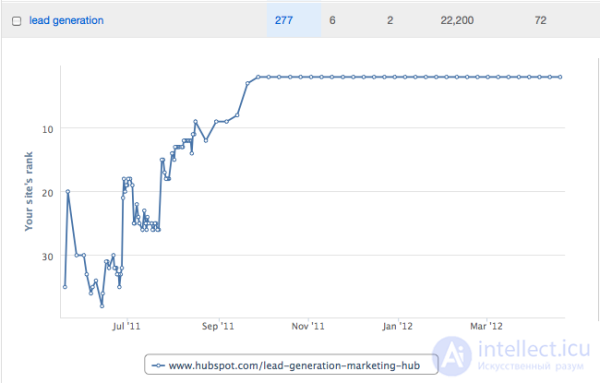
Keyword ranking. This metric shows which keywords and phrases are ranked well and which ones are not enough. You can also compare keyword ranking changes over time. But do not get carried away excessively by this metric: measure first of all the traffic and leads generated by the keywords, and not just the keywords themselves.
Transitions to the site per keyword. This indicator shows how much traffic a specific keyword leads to your site from the output of organic search. This will tell you how often people search for a specific keyword and how well your keyword is ranked.
The number of leads per one keyword. This number indicates how well traffic generated by a specific keyword is converted into leads. If a particular keyword or page gives a lot of traffic, but does not give leads, you may need to optimize the call to action (CTA) to increase the conversion rate for leads.
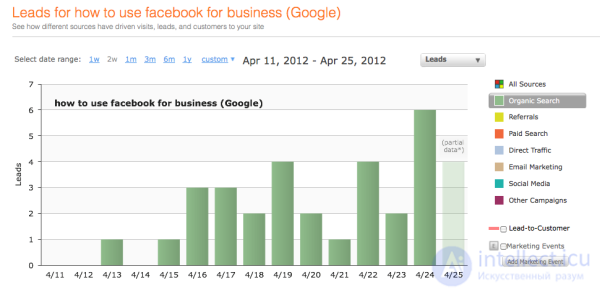
The number of links to the page. There are quite a few inbound links to each specific page, and good links from external resources are beneficial to the ranking of your pages.
Landing Pages and Lead Conversion
CTA conversion level. Track the percentage of people who visited your page and at the same time clicked on a link (or button) containing a direct call to action. A high score indicates how well the proposal is made, whether the CTA-message is well-formed and composed, and how correctly it is placed on the product or service page.

The number of offers accepted. Proposals come to the audience in the form of e-books, online shopping guides and similar materials. When you launch a new offer on the site, see how many people download it.
Percentage of conversions per landing page. This metric is extremely important and determines the efficiency of conversion of site visitors into buyers. Track the percentage of people who remain on the landing page, and then send their contact details through the appropriate form. If the percentage of conversions per landing page is low, you should perform A / B testing to increase conversion.
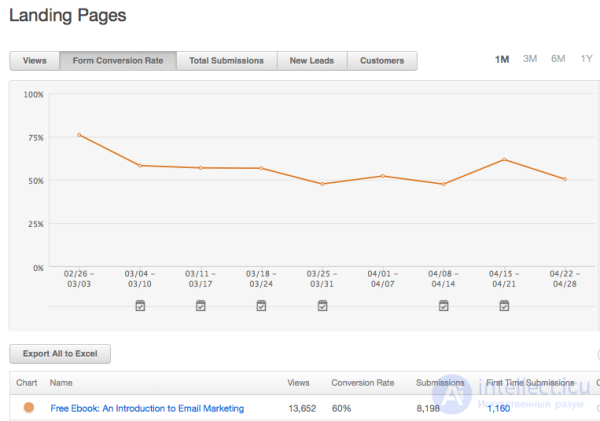
Bounce rate for landing pages. This indicator describes the percentage of people who immediately hit it after they hit the landing page. If the magnitude of the bounce rate is large, then you should improve the landing page, or contact the audience with a more relevant offer.
Lida and email marketing
Subscriber base size. This is the total number of email addresses from your database to which you can send letters. It is extremely important that this indicator grows over time, since the e-mailing database tends to become obsolete at a rate of about 25% per year. And if it seems to you that your base remains stable and unchanged, know - in fact, it is decreasing.
The number of unsubscribing. This indicator also helps to estimate what percentage of people decide not to receive more of your letters. If this value is relatively high - more than 5% - then you should take steps to segment your mailing list according to all parameters that are essential for your business. This will allow to offer more valuable information only to interested subscribers.
The percentage of successfully delivered letters. This figure shows how many letters actually go to the inbox to subscribers. A low level of delivered letters may indicate that you have a low level indicator Sender Score.

The percentage of open emails. How many of your received letters do people read? The higher the recognition of your company and the better the attitude of the recipient to it, the higher this indicator.
Clickthrough rate (CTR - English click-through rate). In the email newsletter, the CTR indicates the percentage of people who received your letter, opened it and clicked on the link from the letter. Use this metric to understand how valuable the target message is to the target audience, as well as to understand whether you are well positioning links to your site.
Conversion level for email campaigns. This metric shows the ratio of received letters and those converted to target contacts and sales. Used to match the current email campaign with previous periods. A higher percentage of conversion indicates the proper targeting and quality proposal for your audience.
PR and branding
Direct traffic Includes all traffic coming to the site. This indicator demonstrates the effectiveness of the promotion of the company's website.
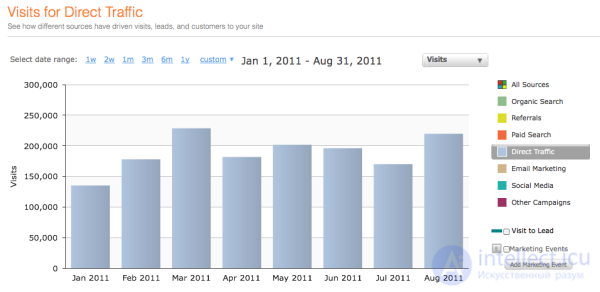
Search traffic associated with the brand. This indicator is very similar to direct traffic, but differs in that it shows the number of users who get to the site through Google search.
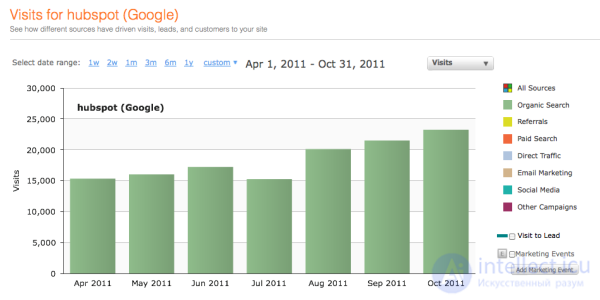
The number of visits from guest posts and other locations. Have you written a guest article for the profile edition? How many visitors brought this publication to your site?
General metrics of sales and communications funnels
Site visits. This metric shows the number of visitors who came to the site from all available communication channels. This is an indicator of how well your marketing activities drive traffic to the site.
Generated leads. Track leads and conversions from month to month to get a complete picture of the conversions for each of the sales channels, as in the diagram below.
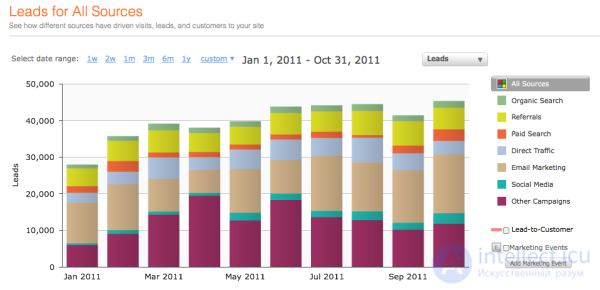
The number of attracted customers. One of the main base metrics. If you do not follow the number of attracted customers, how can you determine the value of the leads received? Use closed-loop marketing analytics to identify the channels that generate leads that convert to customers.
The duration of the sales cycle. How long does it take for a lead to become a customer? Track this cycle and how its duration changes each time. This is necessary, above all, sales managers. This metric allows you to evaluate and optimize certain channels in the sales funnel. This impressive list of indicators will help you identify areas in which you should evaluate the performance of Internet marketers. With data for each of these indicators, you can make more effective decisions and effectively develop your business.
Comments
To leave a comment
seo, smo, monetization, basics of internet marketing
Terms: seo, smo, monetization, basics of internet marketing