
When we said that the most important metric in marketing is ROI and why, when planning marketing activities, CLV is better than ARPU , we raised the question: how much money does an average buyer bring? Answer it is not as easy as it may seem.
If you divide total revenue by the number of customers, then both old customers who have bought several times and new customers who have not been ordered even once will be included in the calculation.
For example, in closed shopping clubs, it often takes several months from registration to purchase. Therefore, it makes no sense to divide the number of monthly registrations into revenues for the same period - money was brought by other users.
There is an elegant solution to this problem. Take customers who have registered, for example, in January last year. Count how many purchases and how much revenue this group brought from month to month to the current moment.
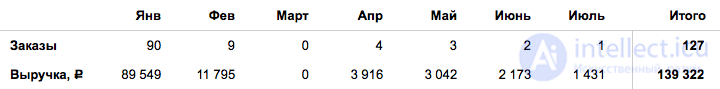
Add the proceeds by month and get the value of the group. Divide the total revenue by the number of people in the group and get the average value of each customer, taking into account repeat purchases. Repeat the calculations for those who registered in February, March and subsequent months.
Please note that we form groups on a time basis - the month of registration. In economics, also in medicine and sociology, such groups of people are called cohorts , and the method is called cohort analysis .
Cohort analysis in practice
Predict payback advertising
Imagine the situation: you bought banner impressions. Last week, the manager calls and asks if you will renew. You look into the analytics and see that now the ROI of the banner is only 30%. It seems that renewing advertising is not worth it. But what if people come back and buy? The decision needs to be taken now.
A cohort analysis will help with a high probability to predict whether advertising will pay off in the future or not. See how ROI was a profitable ad source in the first week. For example, in Darbury, the average source ROI in the first week was 25%. So the site with your banner shows even the best result.
* * *
Let's look at the picture. We analyze the ROI of the campaign VK Campaign 3 Vkontakte source. I red rounded the ROI values for each cohort in the first week. Please note that even a cohort with an initial ROI of 18% eventually paid off, albeit in the fifth week.
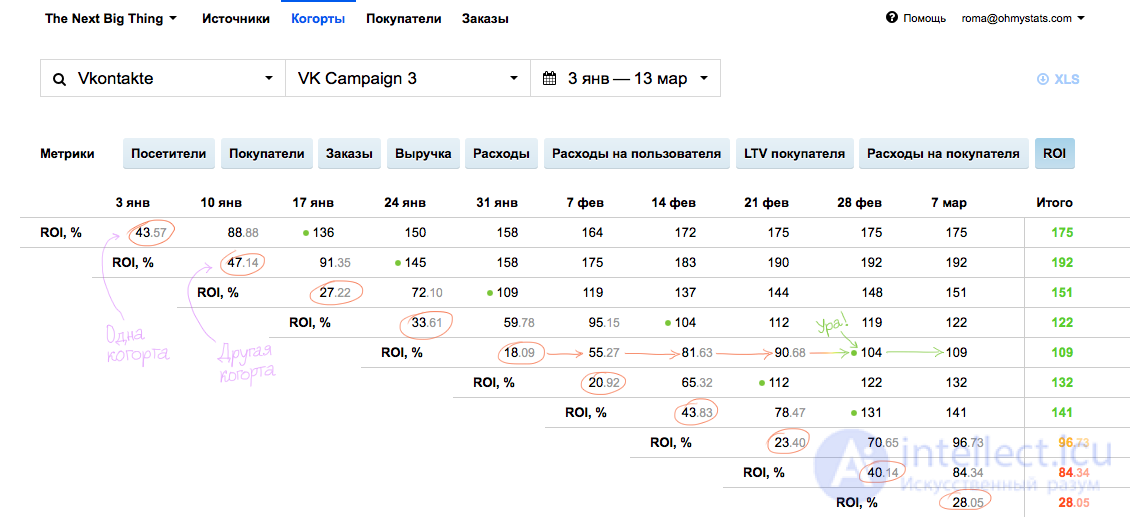
Payback points are indicated by green dots. Notice that five of the eight cohorts pass the 100% mark in the third week. This gives us reason to expect the same behavior for the two lower ones - the newest cohorts.
In addition to ROI, the cohorts compare retention - the number of people who returned to the site, the number of repeat orders, conversions, and so on. Choose an important metric for you and observe how it changes over a single time span from cohort to cohort.
Measure the impact of your actions on sales.
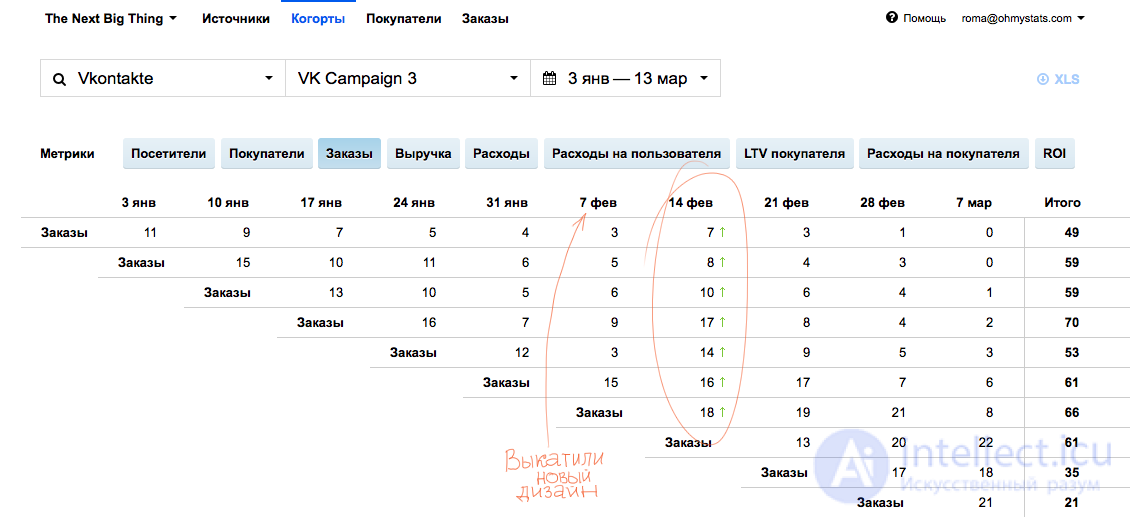
This is especially true for large stores where new products appear at the same time, old ones end, a site improves, new advertising sources are launched. Imagine that in the past month you launched a new website design and a new advertising campaign. Sales have grown. Thanks to the design or advertising?
You can, of course, measure the conversion - divide the number of purchases by the number of visitors. But it will be inaccurate: the conversion is affected by the convenience of the site and the quality of traffic. So she could change or not change for both reasons.
Decision. Advertising affects new visitors to the site, and product changes affect everyone. Compare the conversion of different cohorts. If it has increased or decreased for all cohorts, this is the influence of the site. If only for the latest, newest cohort is an advertisement.
Measure business health
The share of repeat orders shows the status of the business. If regular customers bring you from 30% of revenue and more - this is a good indicator. In addition, the cohorts show you have loyal customers and how many of them there are. If you notice that the cohorts have become faster "to die" - people stopped returning - perhaps you should pay attention to the quality of service or range.
Do a cohort analysis manually
Step 1. Collect the data. Cohorts are formed on the basis of any event, but in marketing they often use the date of the first entry into the site, the date of registration, the date of the first purchase. Ask the programmer or independently upload the data from the database of your store in the format: User registration date - Purchase date - Order number - Revenue .
Step 2. Download data to Excel. Google Docs and Apple Numbers are also suitable. Build a pivot table. Table rows are registration dates. Columns - the date of purchase. Insert either the number of records or the amount of revenue into the cells. As a result, each row of the table will be a cohort in 1 day increments. In the cells there will be either the number of orders or the revenue of this cohort for each day.
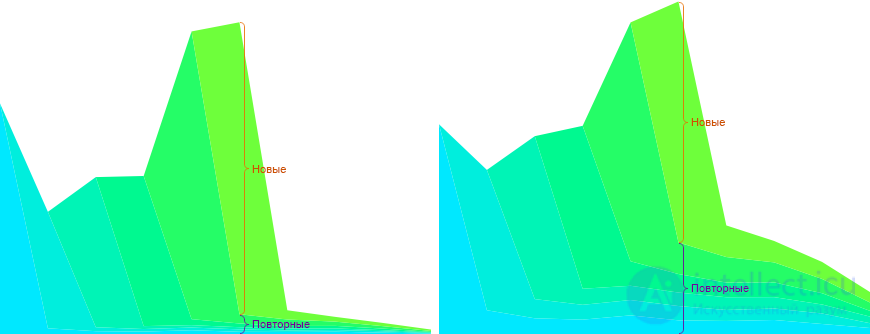
Step 3. It is useful to build a graph. A stacked area chart is suitable for representing cohorts with stacked areas. Or streamgraph , which we in Oh My Stats call a boa. The height of the entire chart is the total revenue for the week. The height of each segment is the revenue of each cohort.

Step 4. Analyze! :)

Comments
To leave a comment
seo, smo, monetization, basics of internet marketing
Terms: seo, smo, monetization, basics of internet marketing