
Lecture
Fault Tree Analysis (FTA) is a technique for identifying and analyzing factors that may contribute to the occurrence of a specific undesirable event (called the "top event"). Causal factors are determined deductively, organized logically, and represented visually using a tree-like diagram that depicts the causal factors and their logical relationship to the top event.
Factors indicated in the tree diagram may be events related to a failure of a hardware component, operator errors, or any other events that lead to the undesirable event.
Fault Tree Analysis or Failure Tree Analysis (Fault tree analysis, FTA) — is a method for identifying and analyzing factors that may contribute to the occurrence of some undesirable event (called the top event - “top event”). Causal factors are determined deductively, logically structured, and represented graphically as a tree diagram, which depicts the relationship of causal factors to the main event.
Factors indicated in the fault tree may be events related to failures of computer equipment components, human errors, or other events that could lead to the undesirable event.
Fault — the state of an object in which it does not comply with at least one of the requirements of regulatory-technical and (or) design (project) documentation .
An object enters a faulty state in the event of damage or a failure that renders the device inoperable .
The term "Fault" belongs to the technical category. This event, as a definition, is an integral part of technical diagnostics. The study of faults determines the possibility of increasing the reliability of a functional object, as well as predicting its remaining service life. Based on the results of fault analysis, it is possible to change the designated purposes of components included in the object. In other words, a fault can be both a consequence and a result.
Drawings are a carrier of information about a product, its design, dimensions, materials, special processing, and, indirectly, the manufacturing technology. A drawing ensures the specific and unambiguous execution of a part, since the information contained in drawings is mandatory for the executor. Only error-free execution of a drawing ensures the manufacture of a serviceable part. According to statistical analysis of machine faults, 60—90% of these malfunctions are related to design and manufacturing errors. Most errors are discovered during the manufacturing process and the first testing of products. Some errors are only detected during operation after a considerable time, shortening the product's overhaul interval or its overall service life
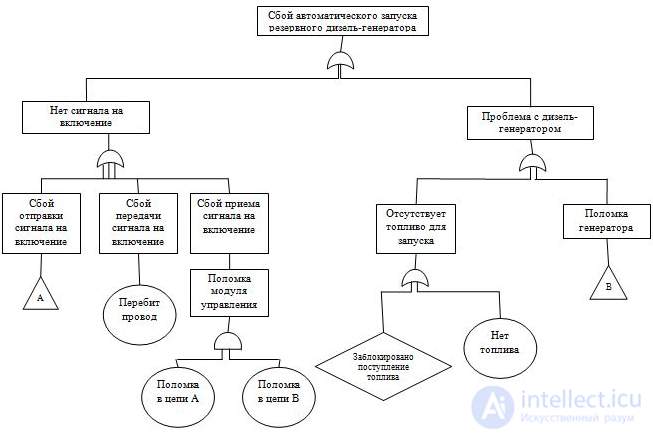
Figure 1 – Example of a fault tree from IEC 60300-3-9
(IEC 60300-3-9, Dependability management — Part 3: Application guide — Section 9: Risk analysis of technological systems) (author's translation)
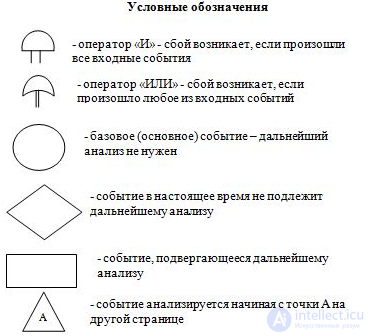
Example of fault tree analysis (FTA)
The fault tree can be applied at a qualitative level to identify possible causes and modes of occurrence of a failure (top event), or at a quantitative level to calculate the probability of the top event based on data on the probabilities of the causal events.
It can be applied at the system design stage to identify potential causes of failure and, based on this, select the best design option. The fault tree can be applied at the operational stage to establish how the most significant failures may occur, and the corresponding significance of various modes of occurrence of the top event. The fault tree can also be applied to analyze a failure that has occurred, in order to schematically depict how the joint occurrence of various events caused the failure.
FTA is effectively used to:
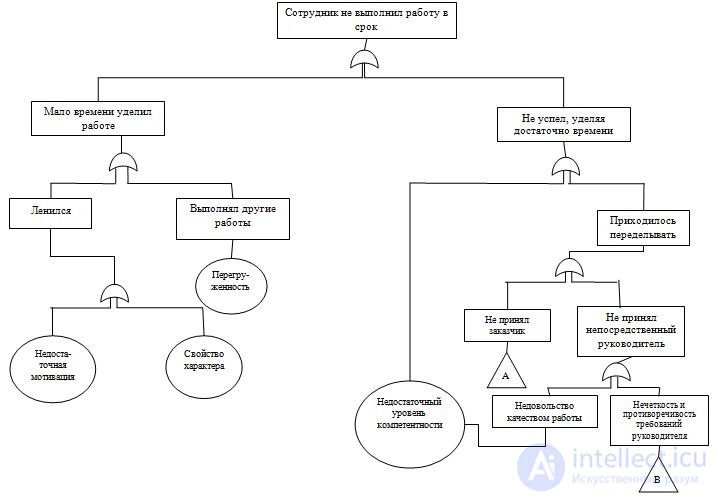
Figure 2 – Example of applying a fault tree to analyze operational risks related to employees
Failure conditions are classified by the severity of their consequences. The most severe conditions require the most extensive fault tree analysis.
These "system failure conditions" and their classification are often predetermined in the functional hazard analysis and failure risk assessment.
To conduct the analysis in qualitative form, an understanding of the system and the causes of failure is required, as well as an understanding, from a technical point of view, of how the system can fail. When conducting the analysis, it is advisable to compile detailed diagrams.
To conduct the analysis in quantitative form, data on failure rates or probabilities of being in a faulty state are required for all the basic events indicated in the fault tree.
Development of the fault tree includes the following main stages:
– defining the top event to be analyzed. This may be a failure or a more general result of a failure. When analyzing results, the tree diagram may contain a section relating to reducing the results of an actual failure.
– determining the possible immediate causes or types of failure leading to the top event, starting from the given top event.
– analyzing each of these causes (or types of failures) to determine how it may be caused.
– step-by-step identification of undesirable system functioning is carried out down to successively lower levels of the system until further analysis becomes impractical. In technical systems, this may be the level of failure of an individual component. Events and causal factors at the lowest level of the system being analyzed are called basic events.
– calculation of the probability of the top event, provided that it is possible to establish the probabilities of the basic events. For the quantitative determination to be reliable, it must be possible to ensure that for each logic gate, all input data are necessary and sufficient for the occurrence of the resulting event. Otherwise, the fault tree is not applicable for probability analysis, but its use may still be appropriate for displaying causal relationships.
When performing a quantitative assessment, the fault tree can be simplified using logic algebra to account for duplicate failure states.
Similarly to obtaining a quantitative estimate of the probability of the top event, it is possible to determine the shortest paths to the occurrence of the top event and calculate their impact on the top event.
Except in cases of simple tree diagrams, a software package is needed for proper handling of calculations when repeating events are present in several parts of the diagram, and for calculating the shortest paths of occurrence. Software tools help ensure the consistency, correctness, and verifiability of calculations.
The output data of the fault tree analysis are:
Fault Tree Analysis (FTA) has the following advantages:
– provides a rigorous, highly systematic, and flexible approach that allows the analysis of a variety of factors, including personnel interactions and physical phenomena;
– the application of the "top-down" approach assumed by the methodology allows consideration of those effects of a failure that are directly related to the top event;
– its application is particularly appropriate for analyzing systems with many interfaces and interactions;
– the graphical representation simplifies understanding of the system's behavior and the factors under consideration, but since tree diagrams are often quite voluminous, their processing may require the use of computer systems, which allows for consideration of more complex logical relationships (for example, the logical operations "AND-NOT" and "NOT-AND"), but also makes verification of the fault tree more difficult;
– logical analysis of the fault tree and identification of individual paths of occurrence are useful for determining simple failure paths in a very complex system, where it is difficult to identify specific combinations of events leading to the top event.
The method has the following disadvantages:
– uncertainties in the probabilities of basic events are included in the calculation of the probability of the top event, which can lead to high levels of uncertainty in cases where the probabilities of the basic failure events are not precisely known; however, in a well-studied system, a high degree of confidence is possible;
– in some cases, causal events are not related to each other, so it may be difficult to establish whether all significant paths to the occurrence of the top event have been accounted for. For example, including all sources of ignition in a fire analysis as the top event. In this case, probability analysis is not possible;
– the fault tree is a static model; relationships in terms of time are not considered;
– the fault tree can only be applied to binary states (fault/serviceable);
– types of errors related to personnel can be included in the fault tree at a qualitative level, but discrepancies in degree or quality, which often characterize personnel error, are usually difficult to include in the diagram;
– it is difficult to include "domino effects" or conditional failures in the fault tree.
More details in the document
IEC 61025:1990 "Fault Tree Analysis (FTA)"
The analysis consists of a visual inspection aimed at detecting cracks, chips, and the degree of wear of parts.
The main causes of vehicle faults are: wear of rubbing surfaces (abrasive, fatigue, corrosive, molecular); deformation and breakage of parts; misalignment or improper fit of parts; burning of the working surfaces of engine parts due to exceeding its permissible thermal regime; formation of scale in the cooling system, carbon deposits in the combustion chamber (cylinder head walls, piston crown, valve heads); deposition of resinous substances in the intake manifold of a carburetor engine when using low-quality fuel; use of fuels and lubricants that do not meet the requirements of regulatory technical documents, containing mechanical impurities.
Factors affecting the occurrence of vehicle faults also include: design or manufacturing defects (incorrect choice of part materials or fits, poor quality of mechanical and heat treatment, etc.). External influencing factors (road, climatic, and other operating conditions); the quality and cleanliness of the fuels and lubricants used; driver qualification; the timeliness and quality of maintenance and repair; rational organization of the technical operation of vehicles at the motor transport enterprise; methods of vehicle storage and conditions for starting the engine in winter.
Parts operating under high-temperature conditions, in addition to abrasive wear, are also subject to chemical corrosion and warping.
For example, significant wear of the upper part of the cylinders occurs not only as a result of metal abrasion in the "liner — upper piston rings" pair due to deterioration of lubrication under the influence of high temperatures, but also as a result of chemical corrosion of parts in conditions of contact with hot gases. Wear of the tooth surfaces of gears and rolling bearings occurs under the action of molecular-mechanical and fatigue wear of the metal.
Most faults in the power unit and other assemblies and mechanisms of the vehicle arise as a result of wear of parts — cylinders and pistons, connecting rod and main crankshaft journals, engine valve working surfaces, etc. Damage that disrupts the serviceable condition of the vehicle's components is possible, but occurs relatively rarely. Therefore, to prevent faults, the occurrence of maximum permissible wear should not be allowed.
This is achieved by creating a scheduled preventive maintenance system for the motor vehicle fleet, using operating materials — oils, greases, fuels, coolants, and special fluids — in accordance with the requirements of design documentation, as well as by high-quality performance of maintenance and repair.

Comments