
Lecture
One of the main directions in electrical equipment diagnostics is the diagnostics of power transformers. This is due to the high cost of the transformer, its importance in ensuring the reliability of consumer power supply, and the difficulty of detecting damage and defects at an early stage of development. Diagnostics of power transformers is a complex, multifaceted process. Based on many years of experience in transformer operation, typical types of damage, their signs, possible causes and detection methods have been established.
Magnetic core. If there is a defect in the interlaminar insulation, overheating may occur, caused by eddy currents or currents in short-circuited loops formed as a result of a breakdown of the insulation of massive frame parts from the active steel. If moisture condenses on the surface of the oil, it gets onto the top yoke and penetrates between the plates of active steel in the form of a water-oil emulsion, destroying the interlaminar insulation and causing corrosion of the steel. For these reasons, the condition of the oil deteriorates (the flash point decreases, the acidity increases) and no-load losses increase.
Windings. The most characteristic type of damage in windings is a turn-to-turn short circuit. Its cause may be the breakdown of insulation due to aging as a result of natural wear, or due to prolonged transformer overloads with insufficient winding cooling. Insulation breakdown of the turns may also occur as a result of mechanical damage during short circuits. Signs of turn-to-turn short circuits include tripping of the gas protection, increased heating, differences in the DC resistance of the phases, etc.
On transformers with a rating of 1000 kV·A and above, a gas relay is installed, which trips as a result of gas evolution inside the transformer caused by decomposition of the oil due to the aforementioned damage. The causes of gas protection tripping and the nature of the damage can be judged from the results of a chemical analysis of the gas accumulated in the relay, which makes it possible to detect damage at an early stage of its occurrence and, in a number of cases, to promptly eliminate it.
The methods used in practice for monitoring the integral state of transformer insulation (insulation resistance, absorption coefficient, tg δ, C2/C50, etc.) do not allow detection of partial insulation damage at the initial stage of its development or indication of the nature and extent of the existing damage. One of the most promising directions in the study of damage to operating transformers is periodic analysis of the content of gases dissolved in the oil, determined by the chromatographic method.
Under the action of abnormal thermal and electrical loads, damage develops in transformer insulation in the form of local overheating and partial discharges, transitioning into an arc discharge. The energy released in this process causes the destruction of the insulating liquid with the formation of products called fault gases. Analysis of transformer oil for the presence of fault gases and determination of their concentration allows maintenance personnel to timely recognize a developing defect before it progresses and leads to an emergency shutdown of the equipment, which is always associated with economic losses.
The processes of thermal decomposition of the insulation and its destruction by electrical discharges lead to the release of gases that dissolve in the oil. Each type of defect corresponds to a characteristic set of gases. Table 7.1 shows the composition of gases dissolved in the oil, characteristic of various transformer defects.
Table 7.1 - Composition of gases characteristic of various defects
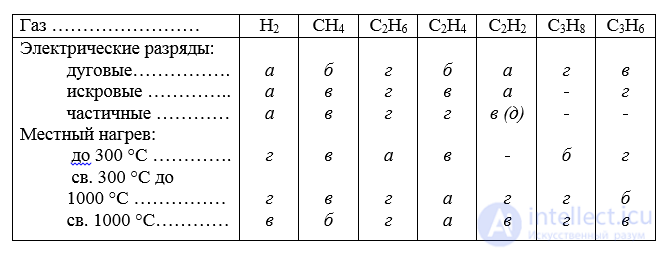
Designations: a – main gas for this defect; b, c – characteristic gas at high content or low content, respectively; d – uncharacteristic gas; e – gas at high density of released energy.
In addition to the gases indicated, the oil may contain oxygen (air), the presence of which indicates a breach of transformer seal tightness. Dissolved water, especially in combination with polar oil aging products and acids, significantly affects the dielectric characteristics of liquid and solid insulating materials. Continuous monitoring of oil moisture content over a long period of time and taking appropriate measures in the event of a sudden increase or unacceptably high moisture content will help extend the life of oil-filled equipment, preserving its high technical characteristics and operational reliability.
A wide range of chromatographic installations is currently produced, allowing analysis of water content and dissolved gases. The main drawback of most of these installations is the inability to obtain information in «on-line» mode - in real time, since a fairly long time passes between taking an oil sample and obtaining the analysis results.
Domestic installations, including a chromatograph, sample takers, analysis result software and various auxiliary equipment, were developed at VNIIE (NPF «Elektra»). These installations make it possible to detect harmful components at the following lower concentrations: water - 2.0 g/t, air - 0.03%, hydrogen - 0.0005%, methane, ethane, ethylene - 0.0001%, acetylene - 0.00005%, carbon monoxide and dioxide - 0.002%.
The operating principle of existing continuous diagnostic installations is based on measuring the volume of all gases dissolved in the oil or on determining its volume resistance.
At VEI, a remote diagnostic system SSG-1 was created and implemented, designed to operate as part of an automated process control system (APCS) for continuous monitoring and forecasting of transformer condition. The SSG-1 cabinet is installed near the transformer and connected to its grounded cooling system at two points with different oil pressure, to ensure its natural circulation through the installation. The installation automatically performs periodic monitoring of the concentration of all combustible gases and the oil temperature at the connection point. The duration of the measurement cycle is 4 h. If the total volume concentration of combustible gases does not exceed 500 ppm, the condition of the transformer insulation raises no concerns; if the concentration is in the range of 500...1500 ppm, chromatographic analysis of the oil should be carried out no less frequently than scheduled; if the concentration exceeds 1500 ppm, the rate of increase in combustible gas concentration should be carefully monitored and an unscheduled chromatographic analysis carried out. A concentration above 3000 ppm indicates the development of a serious defect and requires urgent measures to prevent an accident.
Abroad, continuous-action installations HYDRAN from «Syprotec Corp» (USA) of various modifications have become widespread, which are also connected directly to the transformer. They measure the total concentration of combustible gases and convert it into a hydrogen equivalent. The software of the installations makes it possible to analyze incoming data and forecast the development of defects that could lead to a transformer accident.
To monitor the condition of sealed transformers and bushings, VEI developed microprocessor-based pressure and temperature sensors, installed via fittings directly on the tank or bushings. They measure the oil temperature and pressure at the installation point and are connected to the diagnostic system. A drop in pressure below normal indicates the presence of an oil leak, while an increase in pressure and/or temperature indicates internal damage in the transformer or bushings. The rate of change of the monitored parameters indicates the severity of the damage.
OOO NPTs "ERIDAN" offers a hardware-software complex for diagnosing oil transformers based on the automated multichannel gas chromatograph «Kristallyuks - 4000M». Figure 7.1 shows the chromatogram of the analysis of a reference gas mixture - an analog of the composition of gases released from transformer oil.
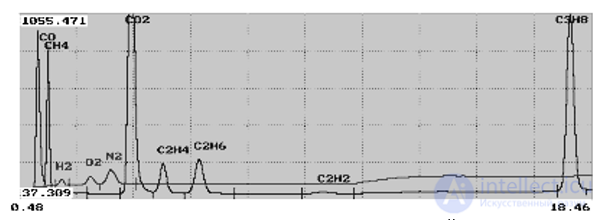
Figure 7.1 - Chromatogram of the analysis of a reference gas mixture
The analysis is carried out using packed columns and, respectively, a flame ionization detector (FID) with a methanator and a thermal conductivity detector (TCD), in accordance with the following regulatory documents: RD 34.46.303-98 - Methodological guidelines for the preparation and conduct of chromatographic analysis of gases dissolved in power transformer oil, RD 34.46.302-89 - Methodological guidelines for diagnosing developing defects based on the results of chromatographic analysis of gases dissolved in power transformer oil, RD 34.51.304-94 - Methodological guidelines for the use of thin-layer chromatography in power systems for assessing the residual life of solid insulation based on the presence of furan compounds in transformer oil. The complex includes the «Kristallyuks - 4000» chromatograph with an FID/TCD analytical module, a methanator, a 10-port sampling valve, chromatographic columns, a chromatographic data processing program, a transformer defect diagnostic program, a personal computer, a printer, sample preparation devices, gas generation and delivery devices, and a cylinder with calibration mixtures. The sample preparation devices include: a valve for filling the syringe with carrier gas, a device for achieving equilibrium in the syringe, syringes for sampling, transporting and storing oil.
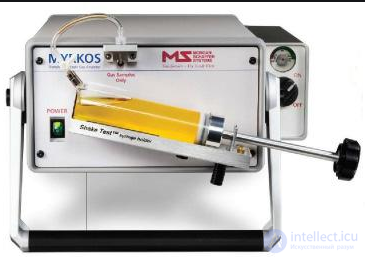
Regular monitoring of gases at the transformer installation site can be carried out using the TFGA-P200 device, the use of which reduces operating costs and the number of laboratory analyses. The TFGA-P200 device is a high-speed gas microchromatograph optimized for measuring the seven most important fault gases: hydrogen, methane, carbon monoxide, carbon dioxide, ethylene, ethane and acetylene. The features of the device are: its own internal carrier gas source (helium), as well as internal rechargeable batteries, which ensure autonomous operation for at least 15 hours. The use of special gas extraction syringes as part of the device makes it possible to perform an oil sample analysis in the field within a few minutes. The duration of measuring the concentration of each of the seven gases individually, from the moment the sample is introduced into the analyzer, is less than 120 seconds. A gas sample taken from the gas relay or from a special probe extracting gas from the oil can be analyzed within a few minutes.
|
Figure 7.2 - TFGA-P200 device
|
The device is supplied complete with software for controlling the course of the analysis and a program for generating the test report. The latter program is designed to prepare a standard report on gas analysis in oil, as well as to export sample data and analysis results to a special expert diagnostic program that makes it possible to interpret the results obtained. The detection limit for gases dissolved in oil is: for hydrogen (H2) - 5 ppm; methane (CH4), carbon monoxide (CO), carbon dioxide (CO2), ethylene (C2H4), ethane (C2H6), acetylene (C2H2) - 2 ppm.
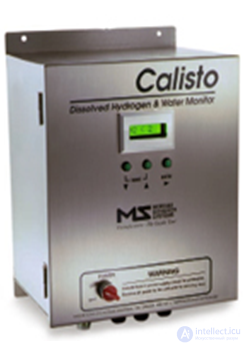
The microprocessor-based CALISTO electronic instrument by Morgan Schaffer performs continuous monitoring of dissolved hydrogen and water in the oil of an operating transformer. The instrument is designed for early detection of developing transformer damage and for justified planning of equipment maintenance activities based on monitoring data. This instrument is specifically designed for outdoor installation and is protected against all climatic effects; it can be easily integrated into existing monitoring systems of power transformers and substations, including the SCADA system. CALISTO allows measuring from 0 to 50000 ppm of dissolved hydrogen in oil and from 0 to 100% relative humidity of dissolved water. The measurement result can be presented as % relative humidity referenced to 25 °C, as ppm absolute humidity, or as % relative humidity at the actual transformer temperature. The measurement error is 0.5% of the CO concentration and 0.1% of the concentration of all other gases. The sensitivity is 5 ppm in oil for hydrogen, 2 ppm in oil for water. The measuring circuit is built on the basis of a thermal conductivity detector and an oil-filled capacitive relative humidity sensor. The instrument has a memory size of 1500 records. An RS-232 port is used to transmit information. The software is in Windows format
At VEI, a setup has been created for continuous monitoring of the insulating properties of oil by measuring its volume resistivity ρυ. The test cell is connected to the grounded oil pipeline of the transformer and periodically transmits data on the value of ρυ to the parameter monitoring system. The value of ρυ, which is affected by oil aging products, can be used to judge the value of its tg δ. Together with other sensors, this setup can be part of a transformer diagnostic system.
|
Figure 7.3 - CALISTO instrument |
Software for collecting and processing chromatographic data and automatic diagnostics will be considered using the example of the transformer diagnostics application for Windows «Tsvet – Analitik» by JSC "Tsvet". The application for diagnosing transformer oil was created in accordance with document RD 153-34.0-46.302-00 and is intended for diagnosing conventional oil-filled equipment. All results of this application's operation are advisory in nature in accordance with the governing document. The application contains a database of analyses, into which data on transformers (location, data sheet) and the results of analyses performed are entered. The program implements the ratios of various gas pairs and the corresponding defects. The program also contains a database of boundary and threshold concentrations of gases dissolved in oil, as well as values of gas solubility coefficients in oil and rejection criteria for high-voltage sealed bushings. Each type of equipment has its own boundary concentrations and is assigned a unique number.
During the diagnostic process, the required dispatch number and sampling point are selected, and the equipment data sheet is filled in if necessary. The equipment type number corresponds to the equipment type number in the table of boundary concentrations. The type of analysis is selected from a drop-down list - scheduled or triggered by a gas relay. If the gas relay has triggered, a gas analysis from the relay can be performed. To do this, the corresponding item must be selected in the diagnostic parameters. First, the gas analysis from the relay must be added, then the oil from the transformer tank, and only then can diagnosis proceed. When diagnosing a transformer with an OLTC (on-load tap changer), an analysis of the oil from the contactor can be performed. To do this, the corresponding item must be selected in the diagnostic parameters. First, the oil analysis from the contactor must be added, then the oil from the transformer tank, and only then can diagnosis proceed. To view the diagnostic result, click the «Diagnostic Report» button. After viewing, the diagnostic result can be printed. The program provides the ability to determine defects graphically and to plot graphs of gas concentration changes over time. To plot graphs of gas concentration changes over time, mark the required gases, set the time range, and click the «Plot Graph» button. To determine defects graphically, go to the «By Component» tab, click the «Plot Graph» button, and select the most similar standard defect graph in the tree list.
|
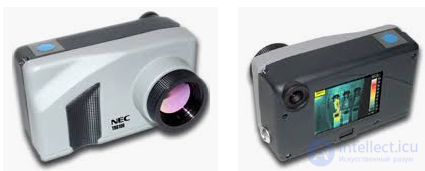
Figure 7.4 - TH6100 thermal imager |
As the energy services of industrial enterprises become equipped with modern thermal imagers, their use for diagnosing power transformers is expanding (Figure 7.4). The use of the thermal imaging diagnostic method does not require shutdown and disconnection of equipment, is low-effort, and helps identify defects at early stages of their development.
The effectiveness and informativeness of this type of equipment condition assessment turns out to be especially high if thermal imaging monitoring is included in a comprehensive process of power transformer diagnostics conducted on the basis of an expert system. In this case, the combined use of all currently available information produces a so-called synergistic effect from its analysis, which makes it possible to obtain the maximum result from the point of view of conflicting criteria: reliability and cost of testing.
During thermal imaging survey of power transformers, the following are checked:
- bushings;
- tanks;
- cooling systems (radiators, fans, oil pumps);
- thermosiphon filters (TSF);
- contact connections.
Thermal imaging inspection of power transformers and autotransformers (AT) can quite easily and accurately detect the following defects:
- overheating of internal contact connections of LV winding leads to the transformer terminals;
- malfunction in the operation of cooling systems (fans, oil pumps, oil circulation in radiators) and oil regeneration (thermosiphon filters (TSF)).
Thermal imaging inspection allows non-disassembly determination of:
- locations of bolted attachment of the tank bell;
- the oil level in the expansion tank, exhaust pipe, and in the bushings.
The main stages of the thermal imaging method for diagnosing power transformers are:
- field studies;
- transfer of the obtained information from the thermal imager to a personal computer;
- structuring of thermograms, organizing their storage in specialized databases;
- preliminary processing of results and their visual analysis;
- mathematical processing and comparison of results taking into account real physical processes in the transformer, automated generation of recommendations;
- comprehensive processing of the obtained information, issuing recommendations based on multi-faceted analysis.
The technology of the thermal imaging diagnostic method should be built taking into account the characteristics of the transformer as an object of study. A significant factor complicating the thermal imaging inspection of power transformers is the presence of attached equipment on the tank, primarily radiators, which significantly reduces the area of the useful surface subject to analysis. In addition, forced oil circulation blurs temperature gradients, which makes it difficult to localize a defect. The essence of thermal imaging inspection of power transformers lies in projecting the thermal defect in the active part onto the tank surface not covered by attached equipment, and identifying this area when analyzing thermograms.
Along with the design features of power transformers noted above that complicate thermal imaging inspection, this object can also be seen as having factors that facilitate its use. Here, first of all, we mean the conditional symmetry of power transformers. The presence of three practically equally loaded phases allows comparison of heating simultaneously across three generatrices, and each significant deviation is subjected to additional analysis. For the same purposes, it is advisable to use the symmetry of power transformers relative to the axial lines.
Field studies. At the field study stage, the operator surveys the surface of the transformer tank using thermal imaging equipment. During the work, the attached cooling system may create interference. Air forced by the fans passes through the radiators, heats up, and then strikes the surface of the tank. As a result, a zone of increased heating forms on its surface, which is not a consequence of defects in the active part of the transformer. Therefore, it is advisable to turn off the system for some time, and, in some cases, the forced oil circulation system as well.
As a rule, there is usually not enough free space near the transformer to capture it entirely in one shot, or it is necessary to take a more detailed shot. In these cases, the tank surface is divided into a certain number of squares, each of which represents a separate thermal imaging photograph. The number of squares is practically unlimited and is determined only by the capabilities of the software, which will subsequently assemble the complete thermal picture of the transformer.
At the field study stage, the operator has the opportunity to immediately assess the effectiveness of the cooling devices' operation, the condition of the oil-filled and porcelain bushings, contact connections of current-carrying parts, contacts of voltage tap changers, etc.
Having detected faults in these units, the operator can generate a report using the complex's software, which indicates the possible cause of the increased heating and a preliminary list of measures to eliminate it. The presence of defects in the active part of the transformer, as a rule, requires more precise diagnostics. For this, the operator captures individual areas in close-up for their further integration into the overall thermal picture of the transformer tank surface. The survey results are saved on a magnetic disk indicating the location and time of shooting, as well as the name of the substation and the transformer being surveyed. In addition, the operator indicates the weather conditions at the time of shooting, the current operating conditions of the transformer, and the approximate distance to the object. A special system has been developed for identifying the recorded views (front, back, left, right), which are indicated on the label of each thermogram. This information is entered into the thermal imager or into the survey log immediately before taking thermograms and is a necessary element for further analysis of the obtained images.
Transferring information to a PC. Assessing the condition of power transformers based on thermal imaging analysis is quite justified; however, as noted above, it is preferable to carry it out in combination with other transformer diagnostic methods. Therefore, all subsequent stages of power transformer diagnostics must be carried out using special software systems (for example, the DIAGNOSTIKA+ power transformer condition assessment system developed at ISPU).
The thermograms obtained at the previous stage are recorded directly in the thermal imager on a magnetic disk. Using special software, the data is read from the thermal imager's internal format, converted, and saved within the Windows environment. This makes it possible to transfer the results of thermal imaging inspection to a personal computer using standard means for processing by the software package for assessing the technical condition of the transformer.
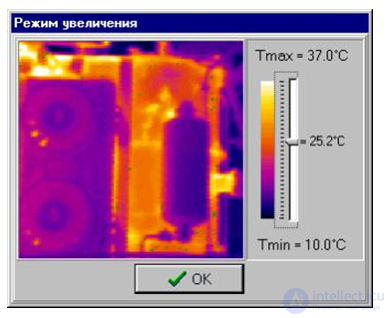
Preliminary processing of results. At this stage it is possible to visually analyze thermograms of each type. The color palette is automatically processed with the maximum and minimum temperatures displayed on the computer screen for the entire image or a separate fragment of it in zoom mode (figure 7.5).
The result of this stage is the automatic determination of the hottest point for each element of the active part of power transformers selected by the operator. Typically the elements selected are: upper yoke, lower yoke, windings of phases A, B and C. More convenient for preliminary analysis is the generated table containing the transformer's dispatcher number, its type, inspection date, element names and their maximum temperatures for each view.
All sections of the active part covered by mounted equipment are not subject to analysis. On the thermograms these areas are automatically blacked out.
The main diagnostic principle of this stage is comparative analysis of an abnormally heated area with a similar surface having normal heating.
|
Figure 7.5 - Visual analysis of obtained thermograms |
Monitoring the cooling system of power transformers. The transformer cooling system is an important functional unit that significantly affects the operation of the entire transformer. Currently two approaches have been developed to assess the operation of the cooling system, applicable to cooling systems of any type and proven effective in practice:
1 Assessment of the average temperature of equipment of the same type operating under the same load, in identical ambient conditions. Experience shows that a difference in average tank temperatures of more than 2 °C between identical transformers operating under the same load and under identical conditions may be a sign of abnormal operation of the cooling system.
2 Monitoring the temperature of the oil inlet and outlet pipes of the cooling system, and comparison with data from standard factory tests. Analysis of the results of standard heat tests and extensive experience of thermal imaging surveys makes it possible to establish the average oil inlet-outlet temperature difference characteristic of each type of cooling system. A deviation from this value of more than 1 - 1.5 °C already serves as a sign of faulty cooler operation.
Diagnostics of instrument transformers. During thermal imaging inspection of voltage transformers and current transformers, the surface heating temperatures of the porcelain bushings are measured in identical zones of the three phases. Temperature values should not differ from one another by more than 0.3 °C.
For current transformers (coupling capacitors), the method of indirect measurement of the dielectric loss tangent of the insulation can be used. For them the thermal balance equation unambiguously relates the magnitude of dielectric losses and the excess of the insulation surface temperature over the ambient temperature. The equation for calculating the dielectric loss tangent of the equipment under study is written as:
tgδx = tgδref(Tx – T0)/(Tref – T0),
where: tgδx - the required dielectric losses of the CT under test, which is energized;
tgδref - the known dielectric losses of a CT of the same type held in reserve;
T0 - ambient temperature;
Tref - surface temperature of the reserve CT, measured with the thermal imager;
Tx - surface temperature of the CT under test, measured with the thermal imager.
Voltage transformers. Defects in voltage transformers detected by the thermal imaging method:
- turn-to-turn short circuits in the windings;
- increased losses in the core steel;
- deterioration of the insulating properties of the oil.
When analyzing the survey results and making a decision, it is necessary to take into account the year of manufacture of the VT and the per-phase load in the secondary circuits. Voltage transformers (NKF series) operate in saturation mode, so during the survey heating of the porcelain bushing is observed along its entire height. In two-stage VTs, in the absence of a defect, in most cases the lower element is the more heated one, which is related to the load in the secondary circuits. In addition, voltage transformers installed on phase "B" may be more heated compared to VTs of neighboring phases, since it is usually the more heavily loaded one. If the "hot" VT is on phase "A" or "C", then one should already consider the possible presence of a defect. To do this, one needs to check the phase configuration, compare the year of manufacture with neighboring VTs, and check the load value in the secondary circuits. If this does not reveal the cause of the heating, additional tests must be carried out:
-
|
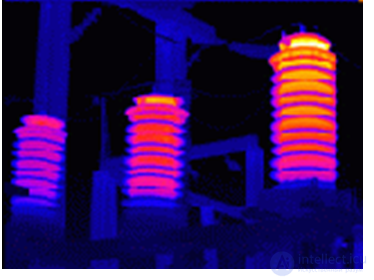
Figure 7.6 - Increased heating under the cover of the right VT of the TFZM–110
|
chromatographic analysis of the oil;
-checking the transformation ratio;
-measuring losses or no-load current.
An excess of heating temperature between VTs on a per-phase basis of more than 0.3 degrees cannot serve as grounds for rejecting it. Figure 7.6 shows a thermogram of a voltage transformer whose porcelain bushing overheated by 0.53 °C. After conventional tests and chromatographic analysis of the transformer oil, it was established that an irreversible process of decomposition of the paper-oil insulation of the windings was underway in it, and it was subject to removal and replacement.
Current transformers. Current transformers manufactured by industry can be divided into three groups according to the design of the internal insulation:
Transformers of the TFZM series (for voltage classes 35 - 220 and 500 kV) may have internal transformation-ratio switching devices. In service there are cases of deterioration of the condition of the internal switching devices. This is usually associated with loosening of bolted connections and an increase in contact resistance. Detection of insulation defects when inspecting CTs of 35 kV and above is based on the relationship between the degree of development of the defect (increase in dielectric losses) and heating of the apparatus surface.

|
Figure 7.7 - Heating of the core of a 10 kV CT in a cell
|
The controlled parameter is the value of the insulation dielectric loss tangent tg. The use of a thermal imager makes it possible to measure this value indirectly. When carrying out a thermal imaging survey of a CT, the condition of external and internal contact connections is also assessed (for example, of the switching device located under the CT cover, whose heating is usually associated with loosening of bolted connections).
Causes of increased heating:
Software for thermal imaging diagnostics of transformers. Software is widely used in the process of thermal imaging diagnostics of transformers. The software makes it possible to monitor in real time the technical condition of the entire fleet of transformers operated by the enterprise, and to systematize equipment by its technical condition:
- operating normally;
- control group;
- rejected;
- more than 25 years in service.
The software also makes it possible to:
- create a database of the equipment's technical condition in an automated way;
- automatically process measurement results and compare them with standard values;
- assess equipment condition based on measured parameters;
- create an automated database of regulatory and technical documents on diagnostic issues.
The software enables operating personnel to diagnose each piece of equipment:
- detect the onset of damage;
- show the dynamics of process development;
- comprehensively review the results of all measurements taking into account the influence of external factors;
- determine the nature of a possible defect;
- forecast the possible development of events;
- develop recommendations for further work with this equipment.
Partial discharge (PD) measurement is used to monitor the condition of the high-voltage insulation of transformers, bushings, VTs and CTs at operating voltage under real operating conditions of the substation. Diagnostic systems based on PD measurement make it possible to detect insulation defects at the very earliest stage of their development, to determine the type, location of the defect and the degree of its danger. Let us consider a high-voltage insulation diagnostic system using the example of the SKI-2 system - a computer system for collecting and processing information coming from electrical, acoustic and electromagnetic PD sensors placed on the monitored object. The length of the connecting cables (sensor - computer) is up to 100 m. In the minimum delivery set, the number of connectable sensors of the electrical and electromagnetic channels is up to 12 (parallel registration), and of acoustic sensors up to 7 (multiplexer). The system operates in real time and provides real-time output of the received information to the computer screen, accumulation of information and its recording to hard disks. It can be connected to a computer network. The system provides periodic monitoring or continuous monitoring (for critical or pre-failure objects) of equipment. The presence of three channels for registering PD signals (electrical, electromagnetic and acoustic) ensures reliable detection of insulation defects regardless of their location and type.
Electrical PD signal sensors are high-frequency current transformers fitted onto the grounding conductors of the monitored objects (grounding of bushing PINs, tanks, shields, etc.). They have an extended frequency range: 1 - 50 MHz and a replaceable interference-suppression filter. The high sensitivity of these sensors allows operation with coupling capacitances of a few picofarads. In this case the minimum detectable PD charge is less than 1 pC. Electrical PD signal sensors have an additional input for connecting electromagnetic PD signal sensors of any frequency range up to microwave (several GHz). The presence of a current transformer at the sensor input makes it possible to simultaneously connect, alongside the electrical sensors, any test instruments and sensors of other measuring circuits, and, in parallel with PD registration, to measure tgδ dielectric loss and complex conductivity currents of the object's insulation under operating voltage. Piezoelectric acoustic sensors P-113 with a frequency band of 20 - 200 kHz have main resonant frequencies of 110 and 200 kHz. Acoustic sensors of practically any type can be used in the frequency range 10 - 300 kHz. Electromagnetic sensors are separate units connected to the additional input of the electrical PD signal sensors. The input frequency range is determined by the unit type (from 400 to 2200 MHz), and the output frequency band is up to 50 MHz. When used with narrow-directivity antennas (microwave probe), these sensors make it possible to perform remote monitoring of high-voltage bushings, insulators, etc. The system includes calibration generators for electrical and acoustic signals, ensuring functional testing and calibration of the sensors.
Unlike standard PD signal meters that work with single samples, the SKI-2 provides statistical accumulation of data over a specified time interval synchronously with the mains voltage. The system is capable of operating in a continuous, fully automatic monitoring mode with periodic recording of the acquired information to disk or transmission of it over a communication line.
|
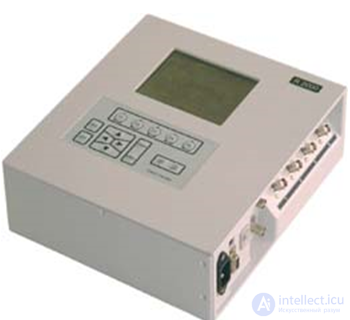
Figure 7.9 – R2000/N synchronous partial discharge recorder-analyzer
|
As an example of a stationary industrial instrument for diagnosing transformer insulation based on measuring the partial discharge level, let us consider the multichannel synchronous R2000/N recorder-analyzer (Figure 7.9). The R2000/N instrument is designed to the greatest possible extent for effective use under operating conditions. These features of the instrument make it possible to effectively reject the interference that is always present in high-voltage equipment (corona, synchronous interference, PD pickup from phase to phase, etc.). The advantages of the R2000/N instrument are the ability to simultaneously use high-frequency (hundreds of megahertz) and low-frequency (hundreds of kilohertz) PD sensors, the use of synchronous registration across all channels, the application of digital filtering and pulse separation methods, "pulse decomposition" based on the physical characteristics of PD and matrices of mutual signal influence between different phases and elements of the monitored equipment. The instrument has 4 (8) input registration channels. The sampling rate of each channel during signal registration is 100 MHz.
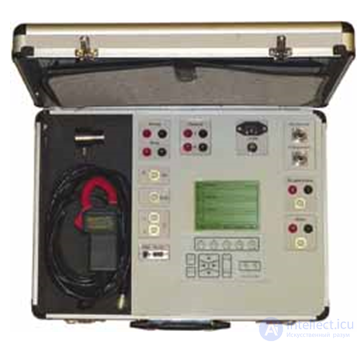
Ganimed instrument for monitoring the condition of OLTC contacts and connections of oil-filled transformers. The instrument is designed for diagnosing the technical condition and adjusting transformer on-load tap changers (OLTC). The instrument allows recording and analyzing standard OLTC characteristics specified in regulatory documents. Such characteristics include the time diagram of contactor operation and the circular diagram of selector operation of the OLTC. In addition, the instrument allows, using a built-in milliohmmeter, measuring and analyzing the contact resistance, as well as analyzing the condition of the OLTC mechanical drive based on analysis of the power consumption graph of the drive motor, recorded over a single cycle
|
Figure 7.10 - Ganimed instrument
|
switching.
For user convenience, the Ganimed instrument implements the practical application of new methods for monitoring OLTC condition, developed by various companies in recent years. One such method is the analysis of vibration oscillations of the OLTC housing during a single switching operation, allowing evaluation of dynamic processes in the structure. The overall diagnosis of OLTC condition is well complemented by analysis of partial discharges recorded using an acoustic sensor mounted on the housing with a magnet. Comparing the discharge intensity at different OLTC positions makes it possible to detect defects in insulation and contact elements.
All these methods for measuring OLTC parameters are implemented in a single combined instrument. Ultimately, this gives the user the ability to independently choose the necessary diagnostic methods to be applied for the analysis of a specific switching device.
|
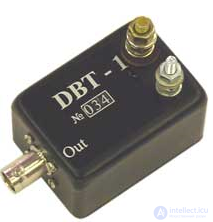
Figure 7.11 - DBT-1 sensor
|
The "Ganimed" instrument has an internal high-performance processor, a graphic display, a membrane keyboard, and combined power supply - from the mains and a built-in battery. The presence of a printer in the instrument makes it possible to obtain the necessary graphs directly on site, or else to save and print them on a computer, for which purpose the necessary software is included in the delivery set.
The DBT-1 sensor is a sensor designed for registering pulses from partial discharges in high-voltage bushings of oil-filled transformers. It is a capacitive divider of the bushing's conduction current, protected by two levels of overvoltage protection - using a spark gap and a varistor. A standard coaxial connector is located at the sensor output.
The sensor design is such that two signals are output from it - the low-frequency bushing insulation conduction current and the high-frequency partial discharge signal. This design makes it possible not only to measure partial discharges, but also to monitor the condition of the bushing by conduction current.
|
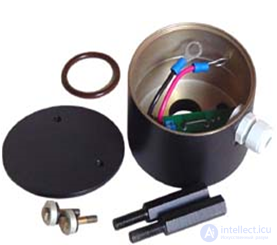
Figure 7.12 - DB-1 sensor |
The DB-1 sensor is a stationary sensor for monitoring insulation parameters under operating voltage. The sensor is designed for mounting on the measuring tap of an oil-filled bushing. A distinguishing feature of the sensor is that it simultaneously serves as a source of both bushing complex conductivity signals and partial discharge signals. This significantly increases the overall informativeness of insulation condition monitoring systems under operating voltage. A capacitor is used as the load element in the sensor, which, compared to a load resistor, reduces overvoltages. A feature of sensors of this type is the installation of overvoltage protection elements - varistors and a spark gap - directly in the sensor housing.
Vibration method for assessing the clamping condition of active elements of transformers. Methods for early diagnostics of the condition of high-voltage oil transformers in operating modes by assessing the clamping condition of active elements using a "non-disassembly" method make it possible to increase operational reliability and reduce the cost of repair work. The actual technical condition of the winding and core clamping can be determined from vibration measurements at specific points on the outer surface of the transformer's oil tank.
For diagnostics of high-voltage oil transformers, a special spectral vibration analysis application "Vesta" ("Vibro-Center", Perm) has been developed. The technical condition of the winding and core clamping is determined from vibration measurements at 12 points on the transformer tank. The program models the physical processes in a three-phase transformer quite accurately, taking into account the influence of active steel saturation on the distribution of current and magnetic flux harmonics with changing load. The program contains mathematical models of vibration distribution in an "unclamped" winding and "loosened" core steel. Processing of the measurement results and mathematical modeling make it possible to draw a conclusion about the condition of the transformer's active materials.
In the process of diagnosing an oil transformer using the "Vesta" expert system, one measurement is performed at no-load, another in a mode close to full load, not less than 50 - 80% of rated value, the closer to 100%, the higher the reliability. Measurements are performed using the portable Korsar+ spectrum analyzer (a description of the spectrum analyzer is given in Chapter 8 of this study guide), which is part of the expert system. The measurement results are "downloaded" via cable to a computer, where they are processed and stored in memory.
Based on analysis of the vibration signal spectra, taking into account the power of integer and fractional harmonics in the range from 10 to 1000 Hz, the program automatically allows:
- monitoring the quality of winding clamping across all phases of the transformer on the HV and LV sides, detecting the "defective phase" and even the location of clamping weakness in the windings, determining the relative degree of weakening;
- determining the clamping condition of the transformer core, at an early stage identifying locations in the core "prone" to loosening of the stack clamping, where a "steel fire" may subsequently occur;
- identifying the general condition of the transformer's structural elements by monitoring the magnetic flux along the winding leakage paths;
- promptly identifying all trends of deterioration in any of the parameters, selecting from all the equipment operated at the enterprise that whose condition is unstable and deteriorating.
All monitored parameters are presented in the diagnoses in the form of generalized calculated "condition coefficients". This makes it possible to apply this methodology without adjustment to practically all types of transformers in use.
If the value of any coefficient (the overall transformer condition coefficient, the winding clamping coefficients, active steel clamping, and structural element fastening) is not less than 0.9, this is a zone of good condition. If it is less than 0.9 but greater than 0.8, this parameter corresponds to the criteria for satisfactory condition. If its value is below this limit, this is a zone of critical condition. Measures must be urgently taken to improve the condition of the transformer.
The diagnosis of the condition of the transformer's elements is presented by the program in two forms - in graphical form and in the form of a report. The graphical diagnosis can be viewed on screen for one phase, for copper or for active steel. The program calculates a complex operating quality coefficient for each transformer, taking into account the specifics of its operation. Based on the analysis of three or more vibration measurements performed on the transformer, from the change in the "condition coefficient" the program provides recommendations on rational timing and scope for carrying out repair work on the transformer's active elements.
Diagnostics of mechanical deformations of transformer windings using the low-voltage pulse method. Insufficient electrodynamic withstand capability of transformer windings under short-circuit current flow, leading to mechanical deformation of the windings, is one of the main causes of transformer failure. Extending transformer service life largely depends on the stability of the mechanical characteristics of its windings. However, even in a properly designed transformer there are inherent prerequisites for future problems with respect to electrodynamic withstand capability under short circuit. The cause of these prerequisites is the winding manufacturing technology, due to which the windings of a new transformer have certain winding density defects from the very beginning. Transformer windings are made as magnetically symmetrical as possible, which minimizes the electrodynamic forces acting on the windings and on the supports: pressing rings, yoke beams. In a new transformer this asymmetry is small and does not pose a danger to the transformer. However, the older the transformer, the more electrodynamic stresses it receives from short circuits and load surges, the more the physicochemical properties of the insulation change, and the more its mechanical properties change. As a result of these effects, the winding clamping force decreases and the initial magnetic asymmetry increases, which always tends to grow further. As the winding clamping force decreases and their magnetic asymmetry increases, the electrodynamic forces grow, leading to an even greater reduction in clamping force and an increase in asymmetry. This continues until the electrodynamic forces grow large enough to destroy the transformer.
Currently, two methods are most widely used for diagnosing the mechanical condition of power transformer windings: the short-circuit resistance measurement method and the more sensitive low-voltage pulse (LVP) method, or the frequency response analysis method, which is similar in essence. The essence of the LVP method Currently, two methods are most widely used for diagnosing the mechanical condition of power transformer windings: the short-circuit resistance measurement method and the more sensitive low-voltage pulse (LVP) method, or the frequency response analysis method, which is similar in essence. The essence of the LVP method is that a rectangular low-voltage probing pulse (100-500 V) is applied from a special generator to the windings (or to the neutral) of the disconnected transformer, and simultaneously the winding responses to this pulse are recorded on an oscilloscope - the voltages across measuring resistors connected to the other windings. First, during the initial fault recording, reference oscillograms are taken from the transformer, which will later be compared with fault oscillograms - oscillograms obtained during subsequent measurements. Comparing reference and fault oscillograms according to a specific procedure makes it possible to assess the condition of the transformer windings. If diagnostics for a given transformer is performed for the first time, the condition of the windings is assessed by comparing the oscillograms of different phases. The higher sensitivity of the low-voltage pulse method compared to others is due to the fact that even relatively small displacements of winding elements (turns, coils) lead to significant local changes in the corresponding capacitances. A change in capacitance leads to a change in the natural oscillation frequency of the corresponding circuit, which is reflected in the oscillogram. This is the advantage of the LVP method over the method of measuring the winding's complex impedance Zk, which has high sensitivity mainly only to those deformations that change the transformer's main leakage channel.
The setup includes:
- a portable personal computer with software for performing diagnostics;
- analog-to-digital converter boards and object interface devices installed in the computer;
- a rectangular pulse generator designed to form probing pulses with an amplitude of up to 500 V, a duration of 1 μs, and a rise/fall time of 50 ns.
The software includes:
- a data acquisition program - testing of the measurement circuit, control of the acquisition procedure, noise filtering, recording to a database;
- a program for processing and analyzing diagnostic results - comparison of the reference and fault oscillograms and their spectra, statistical processing, analysis and evaluation of diagnostic results.
The diagnostic time for one transformer is about 1 hour.
Review questions
1 List the characteristic types of damage to power transformers.
2 What physical phenomena does the chromatographic method of power transformer diagnostics rely on?
3 How is the chromatogram of a gas mixture analysis interpreted?
4 What is the purpose, operating principle, and main technical characteristics of the KALISTO microprocessor-based electronic device?
5 Describe the technology for applying the thermal imaging method for inspecting power transformers.
6 How is the mathematical analysis of thermograms performed?
7 What are the specifics of diagnosing instrument transformers using the thermal imaging monitoring method?
8 What tasks are solved by using thermal imaging diagnostic software for transformers?
9 What physical phenomena underlie the diagnostics of transformers based on partial discharge characteristics?
10 What is the purpose, operating principle, and main technical characteristics of the Ganimed device for monitoring the condition of on-load tap-changer (OLTC) contacts and connections of oil-filled transformers?
11 The design and operating principle of sensors for measuring partial discharge parameters?
12 Describe the vibration method for assessing the clamping condition of active transformer components.
13 How is the diagnostics of mechanical deformations of transformer windings performed using the low-voltage pulse method?
14 How is the mathematical model of transformer load capacity used to solve diagnostic problems?

Comments