
Lecture
Temperature is a measure of the internal energy of bodies. In the process of heat exchange, energy passes from a hotter body to a colder one until thermal equilibrium is established and their temperatures equalize. This characterizes temperature as a physical quantity that determines the direction of heat energy transfer.
The main characteristic of the temperature field, serving as an indicator of defectiveness, is the value of the local temperature differential. The coordinates of the location of the differential, the topology of the temperature field, and its magnitude in degrees are a function of a large number of factors. These factors can be divided into internal and external. Internal factors are determined by the thermophysical properties of the object under inspection and the defect, as well as their geometric parameters. These same factors determine the time parameters of the heat transfer process, mainly the process of the development of the temperature differential. External factors are the characteristics of the heat exchange process at the surface of the object under inspection and the power of the heating source.
Contact and non-contact methods are used to measure temperature. Contact temperature measurement is carried out using liquid and pressure-type thermometers, thermocouples, resistance thermometers, and thermal indicators. Non-contact methods of thermal inspection are based on the use of infrared radiation emitted by all heated bodies. Infrared radiation occupies a wide range of wavelengths from 0.76 to 1000 microns. The spectrum, power, and spatial characteristics of this radiation depend on the temperature of the body and its emissivity, determined mainly by its material and the microstructural characteristics of the radiating surface. As temperature rises, the radiation power grows rapidly, and its maximum shifts toward shorter wavelengths. By the nature of the information obtained, a distinction is made between pyrometers for local temperature measurement at a given point of an object and pyrometers for analyzing temperature fields – thermal imagers. By operating principle, brightness, color, and radiation pyrometers are distinguished. The operating principle of brightness pyrometers is based on the dependence of the spectral brightness of heated bodies on temperature, described by Planck's and Wien's laws. The operation of color pyrometers is based on comparing the intensity of an object's radiation in two spectral ranges. The logarithm of their ratio is inversely proportional to the color temperature of the object. The operation of radiation pyrometers is based on the use of the Stefan-Boltzmann law, which expresses the dependence of the energy radiated by a body on its temperature.
At present, thermal imaging is being intensively applied throughout the entire cycle of electric power production and distribution, from power plants to electricity consumers. Thermal imaging is based on the ability to obtain a visible image of objects from their thermal (infrared) radiation, which makes it possible to evaluate the distribution of thermal fields and, as a result, determine the temperature at any point on the surface of an object. The main element of a thermal imaging system is a compact thermal imaging camera that allows images of an object to be taken in the infrared range. Modern thermal imaging cameras have high resolution and are capable of detecting a temperature difference on a surface with an accuracy of up to 0.05 °C. High mobility and the non-contact principle of operation allow the camera to be used to inspect any objects, including from the air, for example, from a helicopter. In addition, a thermal imaging system includes a personal computer and software designed to process the images obtained by the camera and to create databases based on the inspection results.
The thermal imaging method has enormous potential for the diagnosis and assessment of the condition of power equipment. It detects defects at an early stage of their development, which makes it possible to plan the scope and timing of equipment repairs based on its actual condition. The special value of thermal imaging is that diagnosis is carried out without taking the equipment out of operation. To date, considerable experience has been accumulated in the application of infrared technology at power industry enterprises. For example, RAO «UES of Russia» has developed thermal imaging diagnostic procedures for practically all types of electrical equipment. The method has become a standard and has been included in the sixth edition of RD 34.45 - 51.300 - 97 – «Scope and Standards of Electrical Equipment Testing». This marked the beginning of the widespread application of the method in all power systems. And the experience of applying thermal imaging at JSC «Lenenergo» showed its significant effectiveness, especially in the inspection of contact connections. For example, during the first inspection of a switchgear installation, up to 1-2% of all contact connections are rejected, which effectively helps prevent emergency situations.
The thermal imaging method is successfully used to inspect cooling systems, the condition of active steel, bearings, windings, excitation systems, and the brush-contact apparatus of large electrical machines. On power transformers, thermal imaging makes it possible to detect the sources of leakage field formation, disturbances in cooling operation, defects in oil-filled bushings, and current-carrying parts. When inspecting switching devices, infrared diagnostics covers current-collecting and arc-extinguishing devices, apparatus terminals, and bushings. Measuring transformers, valve arresters, surge arresters, overhead power lines, and pin and suspension insulation are also subject to inspection.
Speaking of the capabilities and experience of applying thermal imaging to solve problems of power equipment diagnostics, the following advantages of this method should be noted:
- it makes it possible to obtain information about the objects under inspection that cannot be obtained by other methods, or is technically so difficult that the economic feasibility of the work is lost;
- thermal imaging makes it possible to conduct inspections of a large number of objects in the shortest possible time and at minimal cost;
- inspections are carried out without taking the object under diagnosis out of service and at its nominal operating parameters;
- the wide range of objects for the application of the method allows the thermal imaging system to be used effectively both for energy and resource conservation, and for increasing the reliability and efficiency of the operation of engineering systems, reducing the accident rate, increasing the safety level of equipment, and reducing the costs of its operation.
To make full use of the capabilities of the thermal imaging diagnostic method, several conditions must be met:
- the availability of a modern thermal imager – convenient to use, providing a highly informative thermal image;
- the availability of well-trained specialists in infrared computer thermography, possessing knowledge in the field of thermal physics and familiar with the design and operating principles of power equipment;
- the availability of a methodological base and software that allow the condition of equipment to be reliably assessed.
Any electrical equipment having rotating or moving parts creates mechanical vibrations. The use of mechanical vibrations as an indicator of equipment condition is a recognized method of technical diagnostics and is called vibration diagnostics. Modern vibration diagnostics includes not only a simple determination of the overall level of mechanical vibrations, but also analysis of vibration spectra, waveform, phase angles of vibrations, envelope spectra of high-frequency vibration, etc. The application of modern vibration diagnostic methods makes it possible to obtain a warning of a fault or breakdown at an early stage of defect development. Analysis of the development over time of the frequency components of the vibration spectrum makes it possible to determine the moment when the fault reaches a critical level, and to take measures to prevent downtime or an accident. A change in the characteristic (baseline) vibration spectrum is used not only as a warning of an impending failure, but also to determine the existing fault. Determining the type of fault or the defective part of the equipment before it is taken out of operation provides valuable information for the proper preparation and execution of repairs. Using modern vibration diagnostic equipment, it is possible to detect incipient faults in sliding and rolling bearings, defects in gear meshing and belt drives, defects of an electrical nature in electric motors, shaft bending, loosening of mechanical connections, defects of various equipment elements (blades, impellers, knives), etc. Particular mention should be made of such areas of vibration diagnostics as balancing of rotors in the operating position and shaft alignment. These faults are the most commonly encountered in practice. The methods developed make it possible to accurately determine the presence of imbalance and misalignment and to eliminate them.
Vibration monitoring. Its objects are, above all, machines and equipment that are sources of vibration. A distinctive feature of such objects can be considered the presence in them of oscillatory forces arising, for example, from the movement of individual units or flows of liquid (gas), or from the action of alternating electromagnetic fields. Only in rare cases can the objects of monitoring be equipment that is not itself a source of oscillatory forces and vibration, but through which vibration from another source propagates.
The purpose of vibration monitoring is to detect changes in the vibration state of the object under inspection during operation, the causes of which are, in many cases, defects.
Monitoring of machines and equipment is carried out primarily using low-frequency and mid-frequency vibration, which propagates well from the point of origin to the points where it is measured. The number of such points can be reduced to a minimum, to one or two per monitored object with a common housing, and vibration measurements can be carried out without changing the operating mode of the object. In a monitoring system, if it is not included in a high-speed emergency protection system, equipment with a single vibration measurement channel may be used, to which all the vibration sensors used are connected in sequence.
Vibration diagnostics. Its objects are the same machines and equipment covered by vibration monitoring systems. Unlike monitoring, the purpose of vibration diagnostics during equipment operation is to detect changes in and forecast the development not of the vibration state, but of the technical condition, and specifically of each of its elements for which there is a real probability of failure between overhauls. For this purpose, not only low-frequency and mid-frequency, but also high-frequency vibration is measured, and more complex vibration analysis methods than those used in monitoring are employed, making it possible to obtain a full set of diagnostic information. Vibration is measured at each diagnosed unit, or at least at the points where high-frequency vibration transitions from the diagnosed unit to other units of the object that are accessible for vibration measurement. The equipment used may also have only a single channel for vibration measurement and analysis.
Rotor balancing. During the operation of machines, their vibration at the rotor rotation frequency can increase, and to reduce it the rotor has to be balanced directly at the site of operation of each machine. The objects of on-site balancing are, as a rule, machines in which there is access to balancing planes, i.e. to places where balancing masses can be attached to the rotating parts.
The primary purpose of balancing is to balance the rotor and, thereby, reduce low-frequency vibration of the machine. However, vibration at the rotor rotation frequency is far from always determined by centrifugal forces, so achieving significant and stable results is, in most cases, possible only by means of tools that determine the causes of vibration growth in each specific case, i.e. that also solve diagnostic tasks. Balancing at the machine's operating site is carried out based on vibration and using the same instruments as vibration diagnostics.
Main methods of monitoring and diagnostics. The main method of vibration monitoring is observing changes in the energy parameters of machine vibration and, above all, the power (level) of individual vibration components. The features of any approach to solving monitoring tasks are determined by three main factors. The first is the choice of vibration measurement points, the second is the number of separated components, and the third is the intervals between measurements.
The effectiveness of monitoring depends on the number of vibration components available for measurement. To increase their number, narrowband spectral analysis of vibration is performed in machines with rotating assemblies, which is most effective for analyzing periodic components of the signal. As an example, Figure 3.1 shows vibration spectra of a machine without defects and after the appearance of defects, accompanied by an increase in the level (power) of many components of the vibration spectrum.
Monitoring the vibrational state of the machine in this case consists of comparing the level of individual components with the thresholds shown in Figure 3.2 and analyzing changes in the level of individual components over the period of operation.
In practical vibration diagnostics of machines, there are two main approaches to solving diagnostic tasks. In the first case, diagnostics is performed only after changes in the vibrational state of the machine have been detected by monitoring tools, and its task is to interpret these changes. However, monitoring is usually carried out using low-frequency and mid-frequency vibration, which responds mainly only to the appearance of developed defects. It is these that lead to noticeable changes in the energy parameters of vibration, exceeding their natural fluctuations when the machine's operating modes change.
The second approach consists in using those diagnostic methods and tools that detect the main types of defects at the stage of their inception, even before significant energy changes occur in the overall vibration signal of the machine. Detecting defects at the inception stage makes it possible to observe their development and plan repair and maintenance work on the machine in a timely manner.
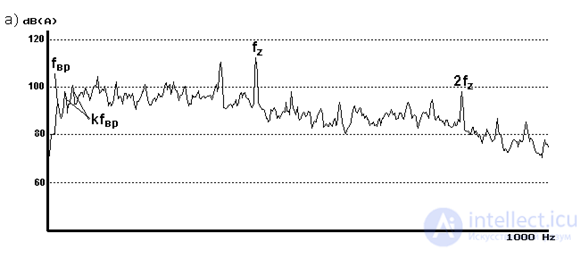
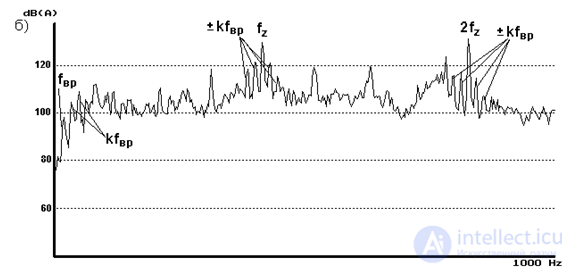
a) - defect-free machine; b) - machine with a defect;
frot - rotor rotation frequency; fz - tooth-mesh frequency
Figure 3.1 - Vibration spectra of a bearing assembly
To detect incipient defects in rotating assemblies, natural diagnostic features are used, determined by spectral analysis of the vibration signal itself or of power fluctuations of its components (envelope spectral analysis). Thus, the main indicator of defects in bearings is a change in the properties of friction forces and the high-frequency vibration they excite. These changes, which consist either in the appearance of micro-impacts or in a periodic change of the friction coefficient upon contact of defective sections of friction surfaces, are easily detected by spectral analysis of the envelope of high-frequency components of the bearing assembly housing vibration excited by friction forces (Figure 3.3).
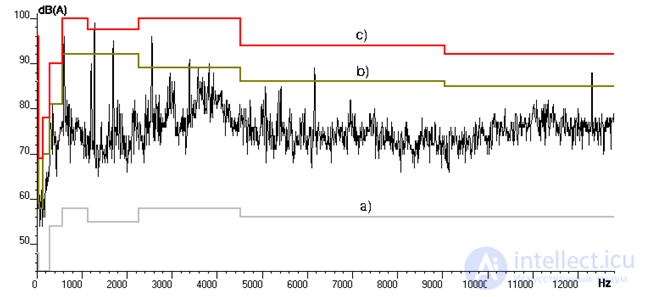
a) - weak vibration signal threshold; b) - medium vibration signal threshold; c) - strong vibration signal threshold
Figure 3.2 - Monitoring the vibrational state of a machine
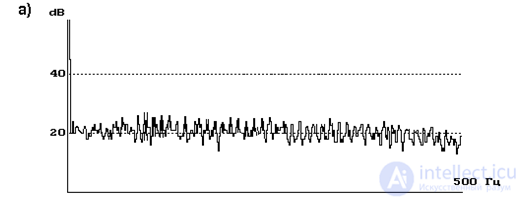
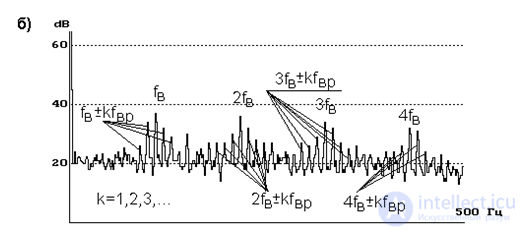
a) - without defects; b) - bearing with a spall on the inner ring; frot - inner ring rotation frequency; fc - rolling element pass frequency over the bearing inner ring
Figure 3.3 - Bearing vibration envelope spectrum
Friction forces in bearings and pressure pulsations in fluid or gas flows significantly change their properties upon the appearance of many, but not all, defects in the assemblies of rotating machines. Thus, a number of defects in electrical machines change the parameters of the electromagnetic field in the air gap, and additional electromagnetic forces and pulsating torques begin to act on the machine's rotor. Since defect-free machines have no pulsating torques, it is precisely these torques and the vibration they excite that are most effectively used to detect incipient defects.
Spectral analysis of the vibration of electrical machines at low and medium frequencies, measured in different directions, makes it possible to identify practically all defects of the electromagnetic system of electrical machines, except for insulation aging, since the electromagnetic field and machine vibration do not change until the moment of insulation breakdown.
Another property of vibration is used to detect rotor defects, especially in high-speed machines, which is related to changes in the magnitude and structure of centrifugal forces. Depending on the type of defect, low-frequency vibration increases and its spectral composition changes in a certain way, which is used for its identification.
Thus, practically all types of incipient defects in rotating equipment can be detected from the vibration signal without involving other types of physical processes for diagnostics. This means that stationary and portable vibration diagnostic systems, which do not require the installation of measuring sensors in the equipment and its assemblies, can be used for transitioning to maintenance and repair of this equipment based on actual condition.
Structure of vibration monitoring and diagnostic systems. The structure of a portable system for in-depth diagnostics of rotating equipment includes a vibration sensor, a device for analyzing the vibration signal, a computer, and software for diagnosing the assemblies of this equipment. For machines whose rotation frequency is not precisely known at the moment of vibration measurement, a rotor speed sensor is used in addition to the vibration sensor.
The main requirement for a vibration sensor is the ability to measure both high-frequency and low-frequency components of the vibration signal. The vibration analysis device must provide narrowband spectral analysis of both the vibration signal itself and the envelope of its high-frequency components, pre-extracted from the signal by a bandpass filter. The device can be made either as a separate instrument or as boards for a personal computer.
Systems for in-depth vibration diagnostics of machines can be produced for pre-repair defect detection of machines, for their output inspection after manufacturing or repair, and for monitoring the condition of machines or their assemblies during operation. They differ only in the features of their software. Thus, machines after repair and installation at the operating site do not have sufficient run-in time, so low-frequency and mid-frequency vibration is used to a greater extent for their diagnostics, and the reference pattern of a defect-free machine (assembly) is automatically built from a set of identical machines. In pre-repair defect detection, diagnostic features of defects contained in high-frequency vibration are also used to the fullest extent, and the reference pattern is also built from a set of machines. During operation, unlike pre-repair defect detection, reference patterns are built from the first three measurements, and are automatically adapted after subsequent measurements.
A system for in-depth diagnostics of rotating equipment, in the absence of a monitoring system, can easily take on its functions. It is only necessary to additionally use monitoring software, whose purpose is to plan measurements, store measurement results in a database, compare them with threshold values set automatically or manually by the user, and observe the development of changes occurring in the vibration signal or in its individual spectral components.
The in-depth diagnostic system under consideration can also be expanded into a stationary monitoring and diagnostic system. To do this, it is necessary to supplement the system with a group of vibration sensors and an electronically controlled switch (between the sensors and the vibration signal analysis device), an automatic system control program that provides planning and automatic control of measurements, and an output alarm device (Figure 3.4).
The new generation of systems for monitoring and in-depth vibration diagnostics of rotating equipment makes it possible to switch, in the shortest possible time, to maintenance and repair based on the actual condition of electric motors of both main and auxiliary process equipment. This does not require installing expensive stationary continuous monitoring systems on all types of equipment. It is sufficient to use portable monitoring and in-depth diagnostic systems that make it possible to detect practically all types of defects at the inception stage many months before a failure, and to plan the timing and scope of repairs in a timely manner.
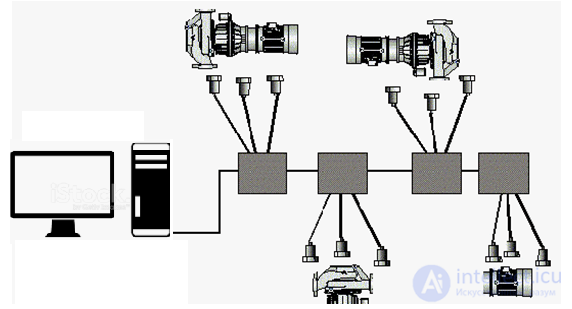
Figure 3.4 – Structure of a stationary system for in-depth diagnostics and monitoring of rotating equipment
One of the diagnostic methods that provide monitoring of the current condition of electrical equipment at its installation site under working voltage during normal operation is the method of monitoring the condition of high-voltage equipment insulation based on partial discharge (PD) characteristics. This method makes it possible to identify insulation defects at the earliest stages of their occurrence, track their development, assess the current condition of the insulation, and the possibility of further operation of the equipment.
Serious insulation defects are usually detected at the stage of acceptance high-voltage tests and tests at the installation site. If the equipment has passed these tests, then insulation defects not detected (or not manifested) during their conduct (which are practically always present) do not lead to a complete insulation breakdown under normal operating conditions. However, during further operation of the equipment, these defects develop and grow. Their growth is caused by the appearance of relatively small electrical discharges in the zone of increased field intensity near the defect, which are called partial discharges. Under the action of PD, insulation destruction begins, and the size of the defective area and the intensity of the discharges increase. As the defect develops, energy release in its zone grows, and insulation destruction accelerates due to thermal processes. An increase in the defective area leads to a growth in field intensity in the remaining part of the insulation gap, and, when the defective zone reaches sufficiently large dimensions, a through breakdown of the insulation becomes possible. As a rule, in the absence of extreme influences (such as overvoltages), the process of defect development from the nascent stage to complete breakdown lasts from several months to several years. Thus, the appearance of partial discharges indicates the presence of an insulation defect, and PD reach a detectable level already at the earliest stage of defect development. PD measurement can be carried out during normal operation of the equipment without taking it out of service.
The occurrence of an electrical discharge produces signals of three types: electrical, electromagnetic, and acoustic. The first two types of signals differ somewhat conditionally, since an electrical signal is always accompanied by an electromagnetic one, and the distinction between them relates more to the methods of detection - an electrical signal is measured in wires, while an electromagnetic signal is detected using an antenna. Accordingly, to detect PD, electrical sensors (connected to the input or output buses of the equipment or to its grounding buses through a coupling capacitor or current transformer), electromagnetic sensors (radio receivers with an external or internal antenna), and acoustic sensors (internal or external) can be used.
The most sensitive to PD signals are electrical sensors connected to the high-voltage bus of the monitored equipment through a coupling capacitor. However, a coupling capacitor has large dimensions and weight and can practically not be used in field work. Therefore, electrical sensors are usually connected to the taps or measuring terminals of high-voltage bushings (whose capacitance is used as a coupling capacitor) or to high-frequency current transformers placed on the grounding wires of high-voltage equipment elements that have capacitive coupling with the high-voltage bus.
Usually electrical sensors are only able to provide a very rough localization of the PD signal source, based solely on comparing signal intensities at various points of the equipment. Localization of the source by analyzing time delays of electrical signals requires quite expensive equipment and gives results only in distributed systems with a coaxial structure, such as SF6 switchgear (GIS). Therefore, acoustic sensors are usually used to localize the defect; these have significantly lower sensitivity, but, thanks to the relatively low propagation speed of acoustic signals, allow fairly accurate localization of the signal source inside the object. In this case, the delay of the arrival moment of the acoustic pulse relative to the electrical signal is measured at several points of the equipment, and based on this, the approximate position of the source is calculated taking into account the design of the specific object. Acoustic sensors are practically not subject to external interference on the power equipment of substations (excluding motors and generators).
Electromagnetic sensors detect electromagnetic PD signals using an antenna. This method is one of the earliest and most convenient methods of PD detection, since it provides remote measurements without connection to the object. In recent years there has been a transition to using the frequency range from several hundred megahertz to several gigahertz. In this frequency range the interference level is significantly lower and it is possible to use highly directional antennas, providing localization of the signal source with an accuracy of several tens of centimeters. These sensors are most sensitive to defects in the outer parts of the equipment (such as bushings and insulators); signals from defects located inside a metal tank are strongly attenuated.
The greatest difficulties in measuring electrical PD signals under operating conditions are caused by separating PD signals arising in the high-voltage insulation of the monitored equipment from external and internal interference of various origins. The sources of pulse signals (interference) detected at the bushings and grounding circuits of high-voltage equipment are:
- various types of converters (frequencies up to 1 MHz);
- switching of OLTC (on-load tap-changer) contacts and switches of adjacent lines, etc. (frequencies up to 10 MHz);
- corona on the incoming wires and surrounding equipment (frequencies up to approximately 400 MHz);
- defective insulators of adjacent portals, especially on 750 kV lines (in all ranges);
- defective insulators of 10 kV buses (especially pin-type insulators at old substations) (in all ranges);
- HF communication signals (frequencies up to 500 kHz) and many others.
Internal sources of interference are spark discharges in defective elements of the magnetic core and parasitic secondary circuits (in all ranges).
The intensity of interfering signals during field monitoring of equipment is quite high. Interference suppression is performed in several stages, starting with the selection of the frequency range of the recording equipment, measuring and subtracting the background, analyzing the amplitude-phase diagrams (APD) of the signals and their time dependences, and ending with comparison of signals from different channels (electrical, acoustic, and electromagnetic).
First of all, interference is suppressed by correctly selecting the frequency range in which the signal-to-interference ratio is maximum. The frequency range is determined based on considerations of maximum interference suppression while achieving sufficiently good detection of PD signals from insulation defects. When selecting the frequency range, the attenuation of PD signals as they travel from the point of origin to the point of equipment connection should also be taken into account.
The second stage of interference suppression is suppression of the background of external signals. This can be done by two methods:
- by measuring the background in the absence of voltage on the monitored object, with subsequent subtraction of it from the measurement results;
- by blocking the recording of PD signals when they coincide with the signals of an antenna sensor recording external interference signals.
The third stage is analysis of the APD of the signals and their time parameters. This makes it possible to cut off corona signals, which have a very characteristic shape and are easily recognized by their APD. Of course, corona signals can mask PD signals from insulation defects with the same amplitude and phase, however the range of phase angles in which corona signals are observed is small, and the probability of complete coincidence of the APD of signals from a defect and from corona is low. Signals from spark discharges in elements of the magnetic core also have a quite characteristic APD, however, the amplitude and intensity of these signals can be large, and against their background it is quite difficult to distinguish PD signals from defects in the high-voltage insulation. But, although magnetic core defects do not relate to insulation, their detection is also one of the tasks of diagnostics. In addition, strong vibration of the magnetic core leads to a fairly characteristic time dependence of the APD of these signals, which allows identification of defects of this type.
The final stage of separating PD signals in the high-voltage insulation from interference is comparison of the signals of the electrical channel with the signals of the acoustic and electromagnetic recording channels.
As a rule, the source of PD is located in the depth of the insulation, and it is impossible to place a measuring instrument there. Recording equipment can only be connected to the outer parts of the monitored equipment (excluding cases of built-in sensors). As the signal passes through the internal elements of the equipment it is attenuated, and its shape is distorted. The degree of signal attenuation and distortion of its shape depend on the type of signal source (defect), the location of its formation (which is initially unknown), the design of the equipment, the frequency range used, the connection method, etc. Therefore it is practically impossible to accurately estimate the initial magnitude of partial discharges and the degree of their danger based on measuring only the signal magnitude at the point of equipment connection (and this is practically all that is measured by virtually all PD meters existing today).
To determine the magnitude of PD at the point of origin, it is necessary to determine the location and type of the defect. Only then, knowing the design of the monitored object, can the attenuation of signals as they travel to the point of connection of the measuring equipment be estimated.
Determination of the type of PD signal source. After separating out interfering signals, the type of source of these signals can be determined from their amplitude-phase characteristic and its dependence on time. Localization of the location of the PD signal source, carried out approximately by comparing electrical and electromagnetic signals at various points of the equipment, and more precisely - by the delay of acoustic signals, greatly helps in analyzing the data. Identification of defects is carried out based on semi-empirical data and accumulated experience. At the level of today's knowledge, identifying the type of PD source from data obtained under real operating conditions is quite a labor-intensive task and requires great experience and high qualification. Despite the existing data on the APD of defects of various types, the analysis requires good knowledge of the design and parameters of the specific equipment, the conditions under which the measurement was carried out, etc. In addition, it is very important to comprehensively use all data obtained by other diagnostic means (measurement of insulation resistance and tgδ, chromatography of gases in oil, thermal imaging monitoring, etc.) and the history of the monitored object (service life, load, presence of short circuits, etc.).
Determination of the degree of danger of the PD source. Naturally, when diagnosing the condition of equipment insulation, basically only one question is of interest - how much longer will it operate? Determining the time after which partial discharges will develop into a complete insulation breakdown under real operating conditions is practically impossible, even without taking into account extreme influences (lightning and switching overvoltages, etc.). The behavior of PD in the process of defect development is statistically quite non-uniform. According to existing data, the amplitudes of PD signals immediately before breakdown even decrease, although their intensity, as a rule, increases. Therefore, today there are no sufficiently accurate methods for estimating the time remaining until complete insulation breakdown. The presence of extreme influences further aggravates the situation. A single measurement of PD signals does not allow a reliable assessment of the degree of danger of the defect and the time of trouble-free operation of the equipment. Periodic measurement of PD signal characteristics makes it possible to estimate the rate of defect development. The rate of change of PD characteristics increases sharply in the pre-breakdown stage, which serves as a fairly good indicator that the defect has reached this stage of development. It is precisely the high rate of change of PD signal characteristics that serves as a fairly reliable indicator of the proximity of complete breakdown.
To determine the degree of defect development, the PD signal measurement system must ensure recording of the amplitude-phase characteristics of PD signals with good statistics (500 - 5000 grid cycles). The most convenient is data accumulation over every 10 - 15 minutes over a period ranging from several hours to several days. Sufficiently accurate localization of the PD source is also necessary to assess signal attenuation and, accordingly, the magnitude of PD at the point of origin.
With this data available (together with chromatography data and others), it is possible to determine the probable stage of defect development - initial, intermediate, and final (pre-breakdown). Such a division is somewhat conditional, but it allows certain actions to be proposed. For example, if the defect is at the initial stage, the equipment can be left in operation and placed under periodic monitoring of gases in oil, insulation tgδ, etc. At the intermediate stage, with an increased content of gases in oil, a planned shutdown for repair can be recommended, or continued operation with more frequent monitoring of insulation parameters and their trend. If this is the final stage, the rate of gas increase is high and insulation heating is occurring (at this stage thermal imaging monitoring can already give results), then the equipment should be immediately taken out of service.
As a rule, the basis of operational methods for diagnosing electrical equipment is formed by physico-chemical methods. Energy exposure of the insulation of electrical devices leads to changes at the molecular level, regardless of the type of insulation, culminating in chemical reactions with the formation of new chemical compounds. All insulation elements are subject to energy exposure. With respect to liquid hydrocarbon insulation, which mineral oils and other organic liquids represent, these types of exposure initiate chemical processes of C-H and C-C bond breaking, as a result of which radical reactions occur, which, with the participation of oxygen and water always present in the insulation, and at elevated temperature, lead to a wide range of new chemical compounds: from light gases - hydrogen, carbon oxides and light hydrocarbons - to complex oxygen-containing and high-molecular-weight compounds - alcohols, organic acids, their salts (soaps), waxes. Electrical exposure of cellulose, which is an integral part of oil insulation (oil-barrier, paper-oil), also leads to the formation of water and carbon oxides. Powerful electrical discharges lead to the formation of carbon and water, while thermal exposure of paper initiates dehydration processes leading to the formation of water and furan-series compounds. Polymer insulation under the action of discharges and natural aging factors breaks down with the rupture of polymer bonds. The exposure of gaseous insulation to electrical discharges leads to the formation of chemically active substances, which in turn affect solid insulation made of composite or ceramic materials. Thus, physico-chemical diagnostic monitoring is based on an objective reality: as a result of any energy exposure, chemical processes of insulation degradation occur in the insulation of electrical apparatus, and the end products of these processes can be used to judge the quantitative characteristics of the energy exposure and the degree of insulation destruction. The formation of new chemical compounds is the ideological basis of physico-chemical diagnostics, and determining the amount of newly formed characteristic components and their rate of formation forms the basis for determining the state of the insulation and the depth of energy exposures on it.
Physico-chemical diagnostic monitoring methods have their own advantages and disadvantages. Among the advantages is the independence of physico-chemical determinations from electrical parameters, i.e., the latter do not create interference for the measurement.
Currently, more than 50 physico-chemical diagnostic monitoring methods are known, of which the following methods have found application in solving problems of diagnosing electrical equipment.
Voltammetry – an electrochemical method of quantitative and qualitative analysis and study of substances, based on determining the relationship between the current in the circuit of an electrolytic cell and the polarization voltage E during electrolysis of a solution or melt of the substance under study.
Electrochemical method – analysis of the physico-chemical properties of ionic systems, as well as phenomena occurring at the boundary of two phases involving charged particles (ions and electrons).
Infrared spectroscopy – studies vibrational and rotational transitions in molecules using emission, absorption and reflection spectra.
Photometry – measurement of extinctions at established wavelengths to determine solution concentrations.
Nephelometry – measurement of light scattering by turbid solutions and suspensions.
Mass spectrometric method – based on the property of gas ions, accelerated by an electric field, to deflect and move in a uniform magnetic field along different trajectories depending on the mass number of the ions.
Atomic emission spectroscopy – measurement of a parameter of the line spectrum of excited atoms to determine the nature and quantity of specific elements.
Spectrophotometry – performs photometry by comparing the measured radiation flux with a reference one.
Conductometric method – a set of electrochemical methods for the study and analysis of substances, based on measuring the electrical conductivity of electrolytes.
Atomic absorption spectroscopy – a method of elemental analysis and study based on atomic absorption spectra.
Ion exchange and liquid chromatography – based on the separating ability of the ions being separated in solution with respect to ion exchange with the ion exchanger (stationary phase).
Gas chromatography – based on the difference in the movement speeds of the concentration zones of the components under study, which move in the flow of the mobile phase (eluent) along the layer of the stationary phase.
Liquid chromatography – chromatography in which the mobile phase is a liquid. Depending on the state of aggregation of the stationary phase, a distinction is made between partition (or liquid-liquid) and adsorption (liquid-solid) chromatography.
Thin-layer chromatography – based on the difference in the movement speeds of the components of the analyzed mixture in a flat thin layer of sorbent as the solvent (eluent) moves through it.
In each specific case, chemical-analytical codes of the substances being determined are formed from the components of the chemical-analytical characteristics, allowing selective chemical analysis to be performed with the required accuracy. Such components include: chromatographic retention indices, spectrum peak intensities, detector calibration coefficients, and others, including double and triple component ratios. These codes can be mathematically formalized, which makes it possible to create computer programs for reliable identification of the substances being determined.
Chromatographic analysis of dissolved gases is a globally recognized, economically advantageous and most effective way of preventing damage to oil-filled electrical equipment. Monitoring of dissolved gases is a mandatory part of most condition-based maintenance programs.
Optical diagnostic methods are based on analyzing the interaction of optical radiation (OR) with the object under control (OC). The informational parameters of OR are the spatio-temporal distributions of its amplitude, frequency, phase, polarization and degree of coherence. To obtain diagnostic information, the change in these parameters is used during the interaction of OR with the OC in accordance with the phenomena of interference, diffraction, polarization, refraction, reflection, absorption, scattering, dispersion of light, as well as the change in the characteristics of the OC itself under the action of light as a result of the effects of photoconductivity, photochromism, luminescence, electro-optical, mechano-optical (photoelasticity), magneto-optical, acousto-optical and other phenomena.
The main informational parameters of optical monitoring objects are their spectral and integral photometric characteristics, which in the general case depend on the structure of the substance, its temperature, physical (aggregate) state, microrelief, angle of incidence of the radiation, degree of its polarization, and wavelength. The use of optical radiation as an information carrier is promising. The electromagnetic field is multidimensional by nature, which allows multichannel (multidimensional) information processing to be carried out by a single device with a high speed, determined by the speed of light in the given medium.
When working with visual inspection instruments, it is important to correctly use the properties of the operator's vision. Vision (seeing) is a complex dynamic nonlinear process, including scanning, convergence (focusing) and adaptation (change in pupil diameter) eye movements, and the processing of visual information in the human central nervous system. In practical work, the operator solves a visual task consisting of the following elements: detection against the background, discrimination of details, and recognition of a specific object as a generalized image. In a number of cases, measurement of the object's image or other operations related to its processing are necessary. The probability of successful solution of visual tasks depends on the contrast of the object, its angular size, the brightness of the background, and the observation time.
Among optical monitoring instruments, the use of laser sources is the most promising. The use of lasers makes it possible to significantly expand the boundaries of traditional diagnostic methods and create fundamentally new methods of optical diagnostics, for example, holographic, acousto-optical, etc., based on the use of the main properties of laser radiation – monochromaticity, coherence and directionality.
For monitoring the geometry of objects, optoelectronic instruments are widely used, which are usually divided into photocompensation, phototracking and photopulse types. Television, laser and raster systems are singled out into a separate group. The main part of the optical system of these instruments is the lens for obtaining an image of the object under control. In some cases, fiber-optic light guides are used. As scanners in modern instruments, photodiode or CCD arrays and two-dimensional matrices with a discrete structure of the photosensitive layer and an electronic scanning circuit are mainly used.
To monitor deformations, changes in gaps and vibration amplitudes, laser fiber-optic interferometers are used, allowing the registration of displacements of the order of 0.01 µm.
Instruments for inspecting internal surfaces and detecting defects in hidden places are called endoscopes and borescopes. The principle of operation of endoscopes consists of examining the object using a special optical system that allows the image to be transmitted over a considerable distance (up to several meters). In this case, the ratio of the length of the endoscope to its cross-section is >> 1. There are lens, fiber-optic and combined endoscopes.
Computer technologies in non-destructive testing. When considering the NDT task as an information process and abstracting from the physical methods of non-destructive testing used, the following three characteristic parts of this process can be distinguished:
- obtaining primary measurement information using transducers and bringing it into a form convenient for further processing;
- processing the information and presenting the processing results in a form suitable for analysis and further interpretation;
- analyzing the information obtained and forming a decision on the state of the object under control, the possibility of its normal functioning, or forecasting its remaining service life.
Transducers may be understood as any devices, whether active or passive in their operating principle, that provide a relationship between the monitored physical parameter (or several parameters) and a registrable output parameter of the transducer (response). In a number of NDT methods, the response can be registered in the form of an image, which can be directly subjected to analysis (capillary, optical methods). In other NDT methods, a response in the form of an electrical signal is used, which is the most convenient for registration and further processing. Primary information, as a rule, is registered in the form of a spatio-temporal distribution of responses. Further processing of information can be carried out both in analog and digital forms, depending on the complexity of the algorithm and cost-effectiveness. At present, the trend of using digital information processing, which provides a number of advantages, predominates.
Depending on the inspection method used, the algorithms for processing primary information may differ, but ultimately, the final result most suitable from the point of view of human perception is an image of the object under inspection (as a plan view, schematic, or three-dimensional projection) onto which the distribution of the physical quantity being sought is plotted (for example, a map of defects and their physical parameters). It is assumed that the values of the quantity being sought are reconstructed with sufficient accuracy on the basis of the primary information obtained. In addition to visual representation, it is necessary to have quantitative values of defect parameters, which are needed for further strength and service-life calculations, i.e., to simultaneously solve the problem of defect metrology.
Despite the wide variety of inspection methods used, types of controlled parameters and defects, the number of algorithms for obtaining the final result is not very large. It essentially comes down to various types of complex transformations, solutions of systems of equations, and inverse reconstruction methods (such as the Radon transform, the SAFT-C method, etc.). It should be noted that when using several NDT methods and comparing the results obtained, it is possible to achieve a super-additive effect.
The ultimate goal of NDT is not only to obtain information about the presence of defects and their physical parameters, but also to form a decision about the condition of the object under inspection, the possibility of its normal operation, or to predict its remaining service life. For a number of objects, strength calculations can be performed and conclusions drawn on their basis. For objects of the same type, methodological recommendations have been developed that formalize the decision-making process. In other cases, a heuristic approach or the use of associative decisions, made on the basis of sample destructive test results, is required. Often the decision is made subjectively by a person, based on accumulated empirical experience.
This link in the information process is the least amenable to formalization and algorithmization. This is due to the great diversity of controlled objects and their physical properties. But in a number of cases, where established methodological recommendations exist, it is advisable to implement them in the form of software that directly uses the results of previous information processing and automatically generates a conclusion about the state of the object under inspection. In the future, self-learning structures based on neural processors can be used for this purpose, which, given feedback confirming or refuting the correctness of the decision made, can increase the reliability of decision-making at the final stage of NDT. Moreover, when the locations of primary information acquisition, its processing, and decision-making are spatially separated, the Internet can serve as the connecting element.
Automation of diagnostic processes. The use of computing technology makes it possible to create flexible automated diagnostic systems that execute both established algorithms and can be reconfigured for new ones that are in the process of being developed. In this case, the basis is microprocessor technology, which serves to create electronic models for the purpose of more effective prediction of equipment reliability. The most promising are distributed automated diagnostic systems.
Let us consider a power unit diagnostic system using computing equipment (Figure 3.5). The system contains sensors D, ADC and DAC information converters, an IU executive device, N normalizers, a switch, and a computer. The sensors measure the characteristics of physico-chemical processes caused by defects in the object under test.
In modern power unit diagnostic systems, hierarchical structures are used: at the first level, local diagnostic systems (LDS), and at the second, central diagnostic systems (CDS). Diagnostic systems perform different functions at different levels of the hierarchy, for example, at the first level, fault detection, and at the second, their localization. The distribution of functions across hierarchy levels can be mixed.
In complex diagnostic systems, special telecommunication equipment is used to transmit information over significant distances. All hierarchical systems have an "engineer's console" on which summary information about the state of technical devices is displayed for timely decision-making regarding their operation.
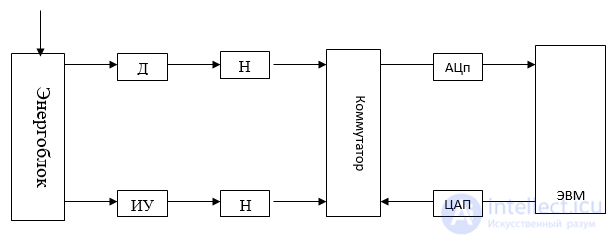
Figure 3.5 - Power unit diagnostic system
In a hierarchical system for diagnosing objects using microprocessors (Figure 3.6), individual sections of the object are checked by their own control microprocessors (CM), while the evaluation of results is carried out centrally.
Input - output
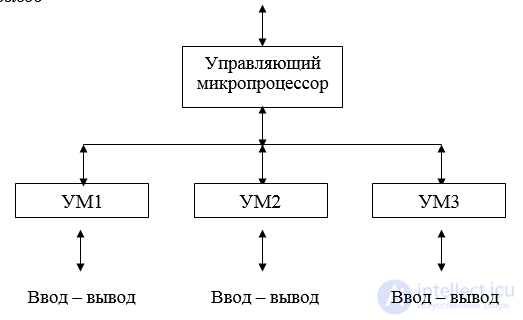
Figure 3.6 - Hierarchical diagnostic system
Mobile diagnostic laboratories. Mobile laboratories are designed for diagnosing the condition of electrical equipment and power lines, as well as for carrying out research, preventive, and repair work at power facilities of industrial enterprises. Mobile laboratories allow for the maximally effective use of highly qualified specialists carrying out diagnostics of electrical equipment and locating faults in electrical networks. Existing practice in the use of mobile laboratories shows that the main characteristics affecting operational effectiveness are laboratory safety, ergonomics, functionality, and reliability. Laboratory safety implies, first and foremost, protection of personnel from electric shock. The presence of visual and light signaling, interlock circuits, and emergency shutdown devices for the laboratory significantly reduce the likelihood of electric shock. Given that mobile laboratories operate 300 days a year in various weather conditions, it can be said that the presence of heating and air conditioning systems in the operator compartment is among the necessary conditions for ensuring safety and comfortable working conditions. The ergonomics of the laboratory, i.e., the simplicity and convenience of controlling all the equipment and measuring systems of the laboratory, is also inseparably linked to the issue of safety.
At present, domestic industry produces a series of specialized mobile diagnostic laboratories, MEGA:
- MEGA - 1: for diagnosing transformers, high-voltage bushings, and testing switchgear equipment;
- MEGA - 2: for testing power cables and locating faults;
- MEGA - 3: for diagnosing high-voltage circuit breakers and storage batteries;
- MEGA - 4: a complete complex for diagnosing equipment and cable lines;
- MEGA - 5: for diagnosing relay protection and automation devices.
Mobile laboratories are mounted on the base of off-road vehicles: KAMAZ, MAZ, URAL, GAZ-3308. All-metal panel vans are also used: Gazelle 2705 with high roof, Sobol 2752, Ford Transit VAN, BIS-1705, UAZ-39629, UAZ-3162, Volkswagen LT-35. All these laboratories are designed for operation at ambient temperatures ranging from -40 to 40 °C.
Review questions
1 What methods are used to measure equipment temperature?
2 What equipment vibration parameters are used to solve vibration diagnostics problems?
3 What is the difference between vibration monitoring systems and diagnostic systems?
4 What is the structure of vibration monitoring and diagnostic systems?
5 By what methods are partial discharge parameters measured?
6 What physical and chemical phenomena form the basis of physico-chemical diagnostic methods?
7 For solving which diagnostic tasks of electrical networks and electrical equipment are optical methods used?
8 For solving which diagnostic tasks of electrical networks and electrical equipment is non-destructive testing used?
9 List the main flaw detection methods. On what physical phenomena are they based?
10 What is introscopy? On what physical phenomena and signal processing methods are the various types of introscopy based?
11 For solving which diagnostic tasks of electrical networks and electrical equipment are diagnostic complexes and mobile diagnostic laboratories used?
продолжение следует...
Часть 1 3. Methods of Diagnosing Electrical Equipment

Comments