
Lecture
Metrics in the game industry are tools for collecting and analyzing data that make it possible to understand how players interact with a game. This data gives developers the ability to make more informed decisions about improving the gameplay. In recent years, metrics have become an integral part of game design, making it possible to create more interesting, balanced, and engaging projects.
Metrics are any values that relate to a particular entity. You will often hear definitions such as Retention, ROI, and others. However, these belong to product metrics and have nothing to do with level design.
Metrics are an important part of level design. They include the sizes of various entities, their movement capabilities, and the architectural features of how the world and rooms are built.
Metrics in level game design are used to analyze and improve game locations, ensuring higher-quality gameplay. These indicators help game designers evaluate various aspects of the player's interaction with the game and tune levels to achieve optimal balance, difficulty, dynamics, and motivation. Let's look at the key metrics:
This metric shows the percentage of players who successfully completed the level. It is important for assessing how difficult or intuitive a level is. If too many players are unable to complete it, this may indicate problems with difficulty balancing or poor placement of objects and enemies.
This metric measures how much time a player needs to complete a level. It allows you to judge the pace of the game: a level that is too short may not be enjoyable, while one that is too long may cause fatigue and boredom.
An indicator of how often a player dies on a level. A death rate that is too high may indicate a lack of difficulty balancing, or problems with gameplay elements that make progression difficult.
This metric tracks the specific points on the map where players die most often. This can help identify problematic sections of a level, for example, poorly designed enemy encounters or difficult platforming segments.
This metric tracks players' movement through a level. It can help identify which route the majority of players prefer to follow, as well as which zones of the level go unnoticed or ignored.
This metric shows how players use the level's resources, such as health, ammunition, or bonuses. If players constantly feel a shortage or, on the contrary, a surplus of resources, this may indicate insufficient balancing of the level.
Shows how often players interact with various objects on a level: whether they activate mechanisms, pick up items, or use cover. This makes it possible to determine how engaged the player is with the surrounding environment.
Tracks how much time a player needs to complete specific tasks on a level, such as solving puzzles, eliminating enemies, or overcoming obstacles.
Pacing is measured through the sequence of active and passive moments on a level. If a level consists only of intense combat scenes, it can tire the player out. If, on the contrary, it is too «calm», it can be boring.
This metric can be subjective, but it is often measured through surveys, reviews, or post-game questionnaires. It shows how much the player enjoyed a particular level and what exactly triggered positive or negative emotions.
Metrics are quantitative indicators that measure various parameters of player behavior, their interaction with the game, as well as successes and problems in the gameplay. This data can be collected using analytics tools and tracking systems.
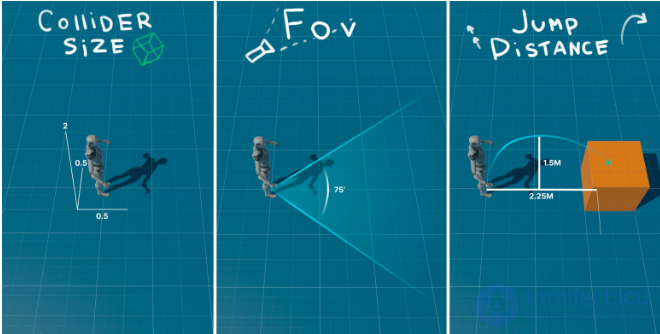
Metrics directly influence various aspects of game design, from the difficulty level to the structure of game levels. Let's look at how metrics affect the main elements of the gameplay.
Difficulty metrics help developers understand at which stages players experience difficulties. For example, if the data shows that many players quit the game at a certain level, this may indicate that it is too difficult or poorly designed.
Example: in games that use a difficulty curve, you can analyze how changes in the difficulty level (for example, adding more difficult enemies) affect player retention.
Metrics related to player behavior can help optimize in-game events and content so that they better match the interests of the audience. For example, if players frequently take part in multiplayer battles, you can put an emphasis on developing the game's PvP aspects.
Example: In mobile games, metrics show which in-game events attract a larger number of users, which helps developers repeat successful gameplay moments.
Metrics help evaluate which level design elements work best. If players frequently get stuck on one level, developers can change the structure or add hints to increase the game's dynamics.
Example: In platformers, the data can show which jumps or traps players clear least often, and this can lead to adjusting the difficulty or adding alternative paths.
Metrics have different significance depending on the game's genre. Each category of games develops its own methods of analysis, which influence the improvement process:
Today there are many tools for collecting and analyzing data about players:
These tools allow developers to respond promptly to changes in player behavior and make adjustments to the game's design.
Candy Crush Saga uses metrics to analyze at which levels players most often quit the game or make microtransactions. This data allows developers to optimize the game's economy and make levels more engaging.
Blizzard actively analyzes data about player behavior in World of Warcraft in order to optimize the balance between character classes, as well as to tune the difficulty of dungeons and raids in accordance with players' abilities.
Metrics play an important role in the process of developing and improving games. They help developers analyze player behavior, identify problems in the game design, and optimize the game to make it more engaging and accessible. Using data allows developers to create deeper and higher-quality game worlds that satisfy the needs of various groups of players.

Comments