Lecture
In the development and analysis of systems for the discretization and restoration of continuous images, the processed images are usually considered as deterministic fields. However, in some cases it is more convenient to assume that the input signal of the image processing system (especially noise origin) is the realization of a two-dimensional random process. Below, in analyzing the methods of discretization and restoration of continuous images, both of these approaches are used.
Let function  describes the original continuous image of infinite size, representing the distribution of brightness, optical density, or some other parameter of the real image. In an ideal image discretization system, spatial samples of the original image are actually obtained by multiplying this function with the spatial discretization function.
 (4.1.1)
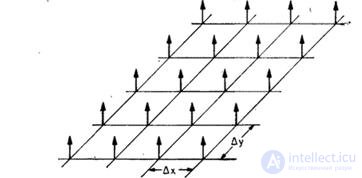
consisting of an infinite number of delta functions defined in lattice sites with a step  , as shown in Fig. 4.1.1. Then the discretized image is described by the relation
 (4.1.2)
which takes into account that the function  you can make a summation sign and set its values only in points of reference
  . Spectrum analysis is convenient for analyzing the sampling process.
  resulting from a continuous two-dimensional Fourier transform of a discretized image
 (4.1.3)

Fig. 4.1.1. A set of delta functions that discretize images.
According to the convolution spectrum theorem, the spectrum of a discretized image can be represented as a convolution of the spectrum of the original image.  and spectrum discretization function
  i.e.
i.e.
 (4.1.4)
The two-dimensional Fourier transform of the discretization function results in an infinite set of delta functions in the spatial frequency plane with a step  and
and  [4, p. 22], i.e.
 (4.1.5)
We will assume that the spectrum of the original image is limited in width so that  at
at  and
and  . Calculating the convolution according to equality (4.1.4), we find
 (4.1.6)
Changing the order of the operations of summation and integration and taking into account the main property of the delta functions, we obtain the expression for the spectrum of the discretized image
 (4.1.7)
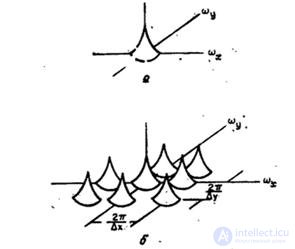
As shown in fig. 4.1.2, the spectrum of the sampled image is obtained by infinitely repeating the spectrum of the original image with a shift by multiples of  . It should be noted that if
  and
and  chosen too large compared to the width of the spectrum
  then the neighboring spectra will overlap with each other.
From samples of the function  You can get a continuous image by linear spatial interpolation or by using linear spatial filtering of a discretized image. Let be
  there is an interpolating filter impulse response, and
  - its frequency response. The reconstructed image is obtained as a convolution of a sequence of samples with a pulse response of the recovery filter. Thus, the reconstructed continuous image is described by the relation
 (4.1.8)
Substituting  from equality (4.1.2) and calculating convolution, we get
 (4.1.9)
This shows that the impulse response  performs the role of a two-dimensional function that interpolates counts on the entire plane. The spatial-frequency spectrum of the image reconstructed according to equality (4.1.8) is the product of the frequency response of the recovery filter with the spectrum of the sampled image, i.e.
 (4.1.10)
Taking into account equality (4.1.7), we obtain
 (4.1.11)

Fig. 4.1.2. Typical sampled image spectrum: a - original image; b - sampled image.
From this expression it is clear that if the spectra do not overlap, and the multiplier  suppresses all shifted spectra when
  then the spectrum of the reconstructed continuous image will coincide with the spectrum of the original image and therefore the images will also be the same. For images with a limited width of the spectrum, the first condition is satisfied if the sampling interval is chosen so that the rectangular region bounded by the upper boundary frequencies of the image spectrum
  , lies inside a rectangular area defined by the halves of the sampling rates
  . Therefore, inequalities must be satisfied

 (4.1.12а)
or
 ,
,  . (4.1.12b)
This means that the sampling step should not exceed half the period of the spatial harmonics corresponding to the smallest details of the image. This condition is equivalent to the one-dimensional signal discretization theorem, in which the requirement is formulated that the sampling frequency must be at least twice the highest frequency of the signal spectrum. If relations (4.1.12) are fulfilled with equality signs, then the image is discretized with the Nayquist (in the Russian literature, this statement is known as the Kotelnikov theorem) frequency; if a  and
and  less or more than what is required by the Nyquist criterion, it is said that the image is sampled with excessive or insufficient frequency.
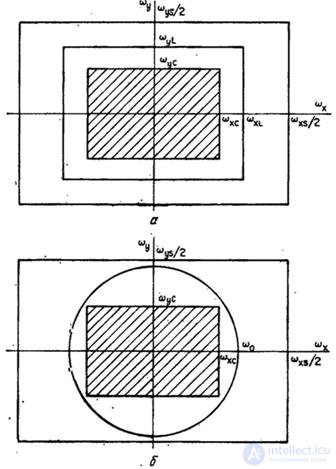
In cases where the spatial sampling rate of the image is sufficient to eliminate the superposition of spectra in the sampled image, the original image can be exactly restored by spatially filtering the samples using the appropriate filter. For example, a filter whose frequency response is shown in Fig. 4.1.3 and described by expressions
 at
at  and
and  (4.1.13a)
 in other cases, (4.1.13b)
Where  - scale constant, satisfies the condition of exact recovery, if
  and
and  . The point spread function (or impulse response) of this recovery filter is
 (4.1.14)
When using this filter, the image is restored using an infinite sum of functions of the form  . Another filter suitable for image restoration is a “circular” filter with frequency response (Fig. 4.1.3, b)
 at
at  (4.1.15a)
 in other cases, 4.1.15b)

Fig. 4.1.3. Filters for restoring sampled images: a - rectangular; b - circular.
if a  The impulse response of such a filter is
 (4.1.16)
Where  - Bessel function of the first order. There are many restoration filters (or corresponding interpolation functions) that can be used to restore images. However, in practice, in a digital image reproduction system, it is often difficult to implement an optimal recovery filter. One of the practical difficulties is that ordinary interpolation functions [for example, given by equalities (4.1.14) and (4.1.16)] accept not only positive, but also negative values, although the functions describing the reconstructed images are strictly positive. Such interpolation functions cannot be formed by optical means and, therefore, it is not possible to reconstruct the images by sequential weighting and addition. Richards [6] found a family of interpolation functions that can be applied to sequential optical interpolation, since their large values are positive.
Comments
To leave a comment
Digital image processing
Terms: Digital image processing