Lecture
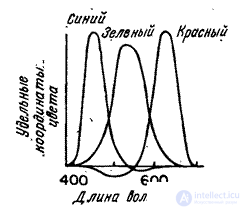
The coordinates of the color of an arbitrary radiation for a given set of primary colors can be calculated indirectly, if the addition functions are known for this set, i.e. the color coordinates of the spectral (narrow-band) radiation of a unit energy. Typical addition functions are shown in Fig. 3.4.1. The addition functions that define the colorimetric system are denoted as  ,
,  ,
,  where
where  - spectral color wavelength.

Fig. 3.4.1. The addition function for typical primary colors is red, green and blue.
Monochromatic light  with wavelength
  and the unit energy has a spectral density
  . In this case, the following relationship is true:
 . (3.4.12)
Consider now an arbitrary color.  with spectral density
  .
.  units of this light at wavelength
  have color coordinates
  ,
,  ,
,  . Consequently,
 . (3.4.13)
Integrating both sides of this equality  and using the main property of the delta function, we get
 . (3.4.14)
A comparison of this equality with the relation (3.4.7) shows that the color coordinate  there is
 . (3.4.15)
As can be seen from fig. 3.4.1, the coordinates of some spectral colors may have negative values. On the other hand, the color coordinate is proportional to the intensity of the primary color, which cannot be negative. Negative coordinate values are interpreted as follows: the primary color corresponding to the negative coordinate value must be added to the original color, after which an equalization is achieved with a mixture of the two remaining primary colors. In this sense, any color can be equalized with a mixture of any primary colors. However, colors with negative coordinates cannot be reproduced using a real device with specified primary colors (for example, in a color television receiver). Fortunately, you can choose primary colors so that most ordinary natural colors are reproducible.

Fig. 3.4.2. Color space for typical primary colors.
Color coordinates  ,
,  ,
,  can be considered as coordinates of points in a certain three-dimensional space (Fig. 3.4.2). This color can also be represented as a vector. In fig. 3.4.2 shows the triangle, called the Maxwell triangle. The distances from the vertices of this triangle to the intersection of the color vector with the plane of the triangle characterize the color tone and color saturation.

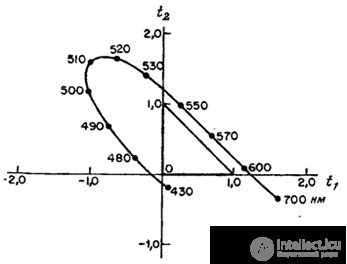
Fig. 3.4.3. Graph color for typical primary colors.
Often, when describing a color, its brightness is of no interest. In such cases, color tone and color saturation  can be expressed in terms of chromaticity coordinates, which are normalized color coordinates:
 , (3.4.16a)
 , (3.4.16b)
 . (3.4.16в)
It's obvious that  and, therefore, only two coordinates are needed to describe chromaticity. In fig. 3.4.3 shows a graph of chromaticity for a set of typical primary colors. With the help of real light sources, you can physically reproduce only those colors that are inside the triangle defined by the three primary colors.
Comments
To leave a comment
Digital image processing
Terms: Digital image processing