Lecture
The Haar transform [1, 23] is based on the orthogonal Haar matrix. Below are examples of fourth and eighth order orthormal Haar matrices:
 (10.6.1)
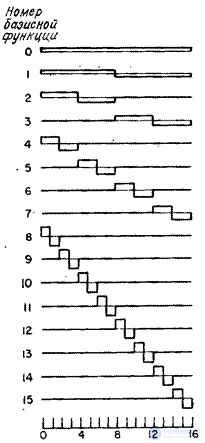
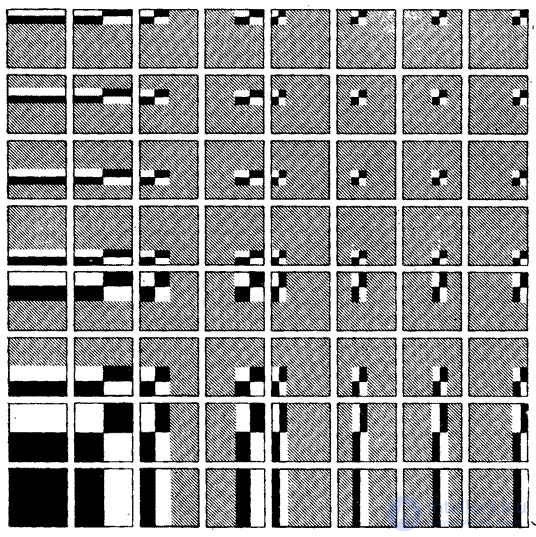
Higher-order Haar matrices are constructed according to the same rules as matrices (10.6.1) and (10.6.2). In fig. 10.6.1 shows the graphs of basis functions of the Haar transform when  . The base images of the same transformation for the sample matrix containing
  elements are presented in fig. 10.6.2.
The Haar transformation can be viewed as a process of discretization of the original signal, in which, with the transition to the next line, the discretization step is halved.

Fig. 10.6.1. Basic functions transform haar with  .
.

Fig. 10.6.2. Basic Images of the Haar Transform  . Black color corresponds to +1. white - value -1, hatching - 0.
In image processing problems, the Haar spectrum describes the distribution of the energy of components corresponding to differences in brightness of neighboring elements, differences in average values of brightness of neighboring pairs of elements, and in general differences in average values of brightness from neighboring groups of  items.
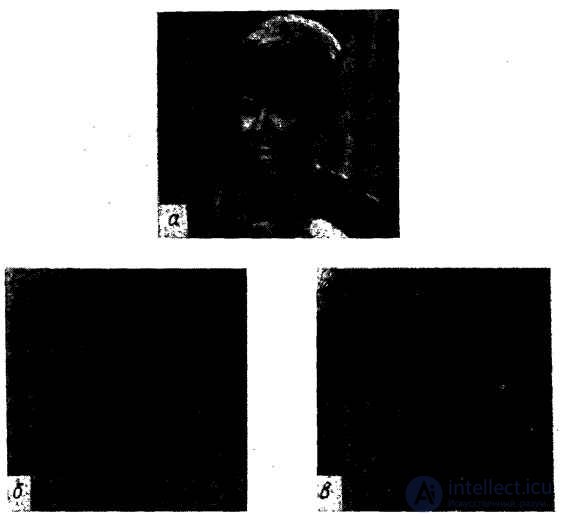
In fig. 10.6.3 shows an example of the Haar transform for a particular image. In the photo with a logarithmic scale, the concentration of energy is clearly visible, especially in areas with high sequences. It should be noted that in the spectrum of the Haar energy concentration is also observed in areas with low sequences.

Fig. 10.6.3. Convert Haar image "Portrait".
a - the original image; b - Haar spectrum in a logarithmic scale along the amplitude axis; c - spectrum with limited greatest harmonics.
Comments
To leave a comment
Digital image processing
Terms: Digital image processing