Lecture
The first step in creating an image reproduction fidelity criterion is to introduce a metric to quantify the perceived differences in brightness, color tone, and saturation of a point light source. There are two types of measures for differences in the characteristics of light: global and local. Global measures are suitable for describing the properties of any light sources, regardless of the specific features of the perception of this light. Local measures characterize only small changes in the parameters describing light sensations.
Consider a source of white light  having brightness
  and located in close proximity to the second white light source
  having the same emission spectrum and brightness
  . Measurements of contrast sensitivity, described in Sec. 2.3, showed that the ratio of Weber
  i.e. the ratio of the barely noticeable (threshold) difference in brightness to the absolute value of brightness
  in a fairly wide range of values
  almost constant and equal to 1-2%. On this basis, it can be argued that the increment of lightness of the second source relative to the first should be determined by the logarithmic expression
 . (7.3.1)
not the difference in brightness  . Since the differential logarithm of brightness is
 , (7.3.2)
then the increment of the logarithm of brightness is equal to the ratio of Weber. Manne and Sukrison [2] studied the possibility of measuring the fidelity of reproducing monochrome images using the relation (2.4.8). In this case, the measure of the increment of lightness becomes
 , (7.3.3)
Where  -constant. In Kornsvit's work [12], it was suggested that the response of retinal photoreceptors is described by a non-linear law (2.4.7). Then the corresponding measure of lightness increment
 , (7.3.4)
Where  and
and  - permanent.
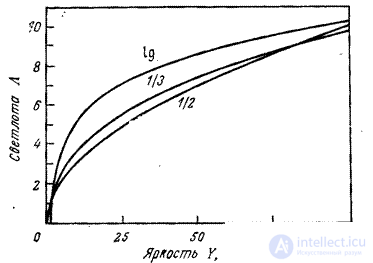
Measures (7.3.1), (7.3.3) and (7.3.4) relate to local measures of lightness change. Often used and global measures that are used to compare the brightness of very different light sources. Such measures were obtained on the basis of empirical models built on experimental material. In fig. 7.3.1 shows the graphs of lightness  from the brightness of the white light source. Priest, Gibsoi and McNicols [13] suggested a simple correlation
 , (7.3.5)
where brightness is measured as a percentage  and lightness varies from 0 to 10. Ladd and Pinney [14] used the scale with a cubic root
 , (7.3.6)
where brightness is also measured in percent. In addition to these dependencies, Foss [15] introduced a logarithmic scale:
 . (7.3.7)

Fig. 7.3.1. Lightness scales.
The difference between the three curves shown in Fig. 7.3.1, mainly due to the difference in the levels of background illumination used in the respective experiments [16, p. 453]. Judd [17] introduced the lightness scale, which takes into account the level of background lighting.  . In this case, the lightness is determined by the expression
 . (7.3.8)
It is interesting to note that the Judd empirical scale is similar in its form to relation (2.4.7) describing the nonlinear model of retinal photoreceptor response.
Comments
To leave a comment
Digital image processing
Terms: Digital image processing