Lecture
The FFT convolution algorithm, discussed in the previous section, is often used in computer simulation of linear analog filters. In this section, the errors inherent in this method of modeling are analyzed, and methods are described for determining the discrete frequency response from a given continuous frequency response. In order to simplify the presentation, only one-dimensional signals are described here.
Consider a long one-dimensional continuous signal.  whose spectrum
  equals zero if
  more cutoff frequency
  . It is necessary to find the convolution of the signal with a continuous impulse response.
  whose frequency response is
  also limited by frequency
  . As mentioned in ch. 1, convolution can be performed either in the spatial domain in accordance with the ratio
 , (11.4.1а)
either in the frequency domain
 . (11.4.1b)
In ch. 9 describes the discretization method of the convolution integral (11.4.1). Continuous impulse response  must be truncated by multiplying it by the weight function
  . The result is a weighted impulse response.
 , (11.4.2)
Where  at
at  . The weight function reduces the effects associated with truncation. The convolution integral is approximated by an expression.
 . (11.4.3)
Then in  point take samples of the output signal with an interval
  , and the continuous integral is replaced by the sum with the same step
  . The result is a discrete representation.
 , (11.4.4)
Where  - integer closest to the fraction value
  .
.
To calculate the sum (11.4.4) using the discrete Fourier transform, you can apply the algorithm described in sect. 11.3. In the first stage as the first  items
items  -element sequences are taken weighted impulse response responses, and as follow
  elements are zeros. In this way,
 , (11.4.5)
Where  . Sequence elements
  can be obtained from continuous impulse response
  and weight function
  by discretizing the product of these functions, i.e.
 . (11.4.6)
In the next step, the discrete Fourier transform is calculated.  at
at  points
 , (11.4.7)
Where  . After substitution of the expression for
  in the formula (11.4.7) and transformations it turns out that the discrete frequency response of the filter is associated with the analog frequency response
  and Fourier Spectrum
  weight function by
 , (11.4.8а)
 , (11.4.8b)
Where  , but
, but  .
.
Equalities (11.4.8) define the desired connection between discrete and continuous frequency characteristics. If continuous frequency response  and Fourier spectrum
  the weight function is known and specified in an analytical form, then in principle the samples of the discrete frequency response can be obtained by analytically performing a convolution (11.4.8b) and finding the numerical values of the function obtained at the same time in points
  for each parameter value
  . In practice, it is often not possible to calculate the convolution analytically, especially for two-dimensional signals, and it turns out to be easier to perform the inverse Fourier transform of the frequency response.
  to get the analytical expression of the impulse response and then take the samples
  in accordance with the formula (11.4.6). You can use another approach: according to equality (11.4.8), take samples of the discrete inverse Fourier transform
  multiply the extended sequence of samples of the impulse response to the weighting function, and then, by performing a discrete Fourier transform, obtain
  .
.
Multiplication by a weight function, which can be performed according to equality (11.4.6) or implicitly in the spectral domain using the relation (11.4.8), is absolutely necessary if it is necessary to suppress those described in ch. 9 cyclical errors. When filtering images, a typical error is usually made when a sequence of samples of a continuous pulse response is taken as a discrete impulse response. Then, in general, all  elements of the corresponding extended discrete impulse response will be nonzero, i.e. the length
  discrete impulse response, "immersed" in the extended vector (11.4.5), will be implicitly taken to be
  . Therefore, all filtered samples will be distorted due to cyclical error.
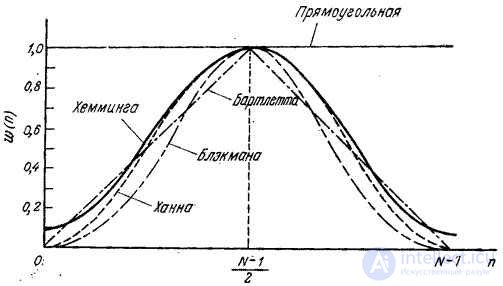
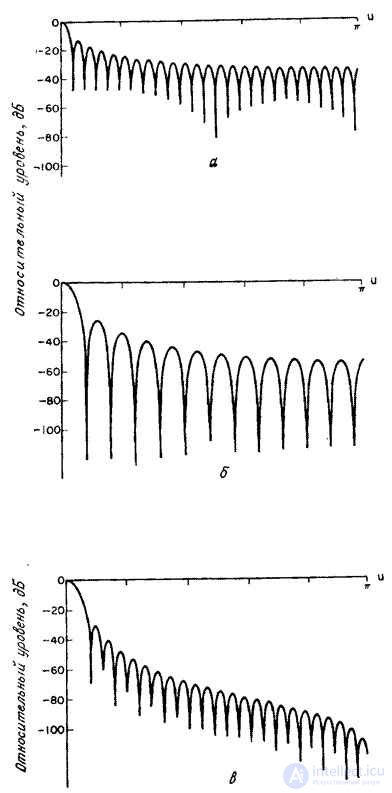
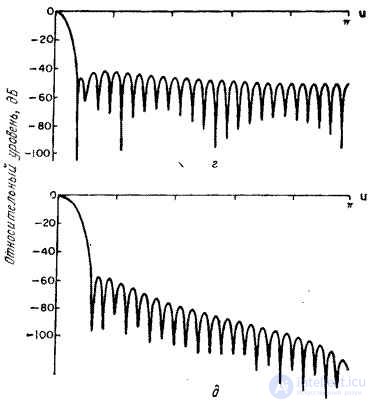
It is known [10-12] several types of weight functions suitable for use in discrete linear filtering. Some of them, most often found in practice, are given in table. 11.4.1, and their graphics - in Fig. 11.4.1. In fig. 11.4.2 shows the corresponding spectra consisting of the main lobe and a set of side lobes, the amplitudes of which usually decrease with increasing frequency. Analysis of the expression (11.4.8) shows how the shape of the weight function and its spectrum affect the output signal. The shape of the main lobe of the spectrum of the weight function determines the signal distortion in the range from 0 to  . Side lobes cause spectral overlap because the weighted impulse response
  has a range of unlimited width. Smooth weight functions have weak side lobes, which reduces the overlapping errors of the spectra, but the main lobe in these cases turns out to be wider, which leads to a smoothing of the signal spectrum. When designing filters, it is necessary to find a compromise between these two types of errors. Both errors can be reduced by increasing the length of the weighted impulse response, but this will either reduce the length of the processed signal or increase the amount of computation.
Table 11.4.1. Weight functions
Function | Definition |
Rectangular |  |
Bartlett (triangular) |  |
Hannah |  |
Hamming |  |
Blackman |  |
Kaiser |
|

Fig. 11.4.1. One-dimensional weight functions [10].


Fig. 11.4.2. Spectra of one-dimensional weight functions [10].
a - rectangular; b - triangular (Bartlett); in - Hanna; g - Hamming; d - Blackman.
Comments
To leave a comment
Digital image processing
Terms: Digital image processing