
Lecture
A mathematical model is a model that reflects the essential features of an object by means of mathematical relations (systems of equations, inequalities, logical relations).
Three groups of mathematical modelling methods are distinguished –
analytical, numerical and simulation methods.
Analytical modelling is the construction of mathematical models that make it possible to obtain explicit formulas for determining the quantities of interest to the researcher for any arbitrary
values of the input parameters (see Example 10.1). Analytical modelling provides the most complete solution to the problem (compared with numerical and simulation methods). The price paid for the completeness of the solution is the difficulty of obtaining the result and the need for substantial simplification of the model (so that it allows an analytical solution).
190
190
Numerical modelling is a process that includes two stages: 1) constructing expressions containing the relationships of interest to the researcher in implicit form; 2) numerically finding the values
of the quantities of interest to the researcher for given values of the input parameters. Numerical modelling provides a less complete solution to the problem, but the range of models that can be worked with
using numerical methods is significantly wider (compared with analytical methods).
Simulation modelling is a special type of numerical modelling. Its specific feature is that, in the process of simulation, the calculation algorithm reproduces the logic of functioning of the object–
original (whereas in the case of numerical modelling, the calculation algorithm and the algorithm of functioning of the real object have nothing in common). Important stages of simulation modelling are
the planning of experiments with the model and the processing of experimentation results. Simulation modelling methods are applied to objects that are characterised by stochasticity, nonlinearity of relations, variability over time, and also
by the presence of multiple contradictory criteria for evaluating the results
of the activity.
A mathematical model of an economic object (in other words,
an economic-mathematical model) – is a description of an economic object in mathematical language, that is, by symbolic mathematical means (see Example 10.1).
Economic-mathematical models are classified according to several criteria. From the point of view of their general purpose, economic-mathematical models are divided into theoretical and applied
[24].
Theoretical models make it possible to study the general properties
and regularities of economic processes.
Applied models are used to solve specific
economic problems and make it possible to take practical decisions.
191
191
According to the degree of aggregation of the objects being modelled, models are divided into macroeconomic and microeconomic.
Macroeconomic models describe the functioning
of the economy as a single whole.
Microeconomic models describe the behaviour of individual elements of the economic system.
According to the type of mathematical apparatus used, models are distinguished as linear and nonlinear programming models, correlation-regression models, matrix models, network models, models
of queueing theory, game theory models, and the like.
Economic systems constitute a specific
object of modelling, characterised by the following features:
- in economic systems, subjective factors operate
connected with human activity;
- economic systems are characterised by high dimensionality,
complexity of structure, purposefulness of activity, and self-organisation of elements;
- economic systems are characterised by fundamental nonlinearity of relations between elements (including due to scientific and technological progress);
- economic processes are stochastic in nature;
- economic processes are dynamic in nature,
- economic processes are characterised by inertia and "counter-intuitiveness" (unpredictability of consequences).
Example 10.1
Modelling of the commodity-money exchange between two economic systems
In a certain conventional (fictitious) world there exist two states isolated from the external environment: the river country A and
the plateau country B. Since the natural conditions in these states
192
192
are different, they have to conduct active trade exchange with each other:
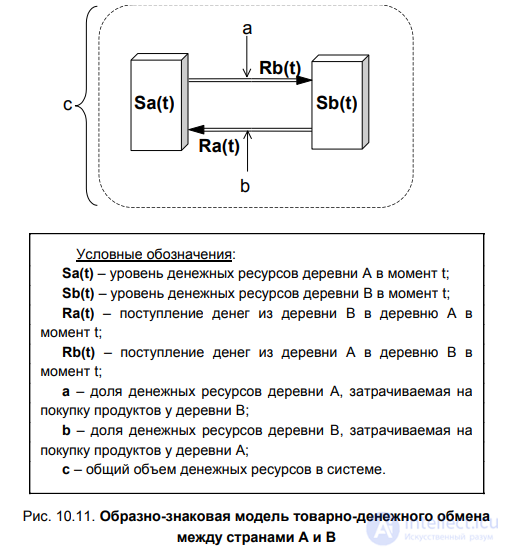
country A buys meat and milk from country B, while country B buys fish from country A. Each country spends a fixed share of its monetary resources on purchasing this produce (country A – 1%, country B – 2%).
Owing to the isolation of the countries, the total sum of their monetary resources is a constant quantity. Owing to the existence of commodity-money exchange between the countries, the sum of monetary resources of each
country is a variable quantity (Fig. 10.11).
The governments of the countries set themselves a strategic goal: over time, to bring the distribution of the total sum of monetary
resources between the two countries to the following level: 40% for country A
and 60% for country B (whereas at the present moment this ratio
does not hold). In order to develop measures for achieving the planned ratio, two tasks were set before the scientists of the two countries:
Task No. 1: to investigate the regularities of the redistribution of monetary resources between the two countries.
Task No. 2: to determine what actions each country must take to achieve the set goal
To solve Task No. 1, a model was developed, presented in Fig. 10.12. Investigation of this model using analytical methods made it possible to formulate the following conclusions:
1) Over time, the system under consideration, consisting of two states, arrives at a state of stable equilibrium. This means that
the volume of monetary resources of each country tends towards a certain fixed "equilibrium" level (SaL and SbL, respectively).
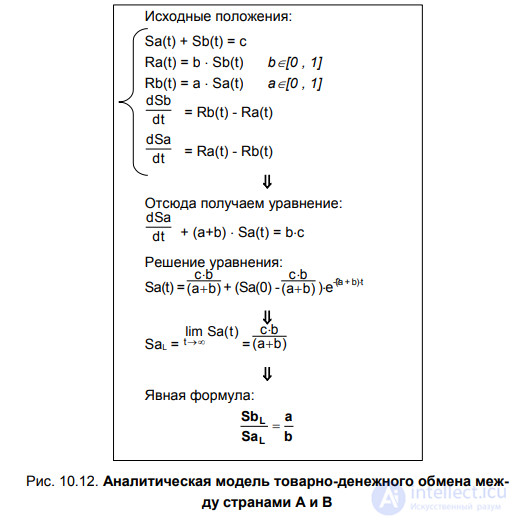
2) The equilibrium ratio of the monetary resources of the two countries, to which the system under consideration tends in the long run, depends
only on which shares of their monetary resources each of the countries
spends on purchasing produce abroad:

3) Proceeding from equality (10.1), the development of the existing trends
in the absence of active control actions will lead to the following:
the ratio of monetary resources of the two countries in the long run will correspond to the following proportion: SaL/SbL = b/a = 2/1 = 2.
To solve Task No. 2, on the basis of relation (10.1), the following
model was formed:
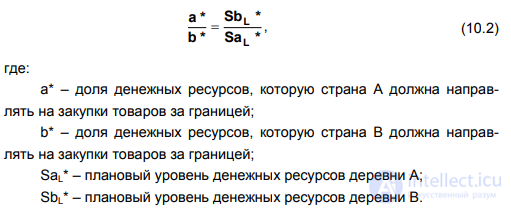
Model (10.2) shows that in order to achieve the set goal,
countries A and B must coordinate their shares of monetary resources
directed towards purchasing goods abroad, and set them in accordance with the following ratio: a*/b* = SbL*/SaL* = 60/40 = 1.5.
Let us summarise the example considered and classify the models used to solve the given problem. The model presented in Fig. 10.7 is a descriptive figurative-symbolic
(graphical) model. The model presented in Fig. 10.8 is a
descriptive mathematical model that has an analytical solution. The model represented by formula (10.2) is normative. All three of the models named belong to the class of dynamic and deterministic models.
PRACTICAL COMPONENT
FIGURATIVE-SYMBOLIC MODELS IN SCIENTIFIC RESEARCH
Purpose of the assignment:
- to acquire skills in creating figurative-symbolic models of economic processes.
196
196
Supplementary material
Let us consider the process of constructing a figurative-symbolic model for the system described in Example 10.1.
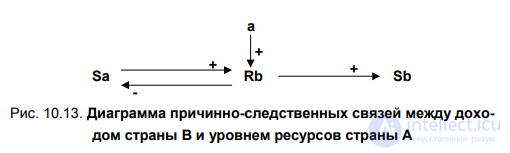
As follows from the conditions of the problem, country A spends a fixed share a of its monetary resources Sa on purchasing produce. Naturally,
the money spent by the residents of country A turns into income for country
B (Rb). This relationship can be clearly represented using a causal loop diagram (CLD), whose elements
are factors (causes), responses (effects), and the links between them, indicated by arrows (Fig. 10.13). The CLD also contains
symbols "+", denoting positive links between elements
(in which an increase in the values of the factor leads to growth in the values
of the response), and symbols "-", denoting negative links (in which an increase in the values of the factor leads to a decrease in the values of the response).
Similarly, country B spends a fixed share b of its monetary resources Sb on purchasing produce. The money spent by the residents of country B turns into income Ra for country A (Fig. 10.14).
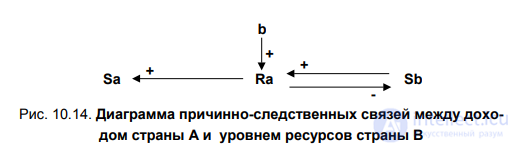
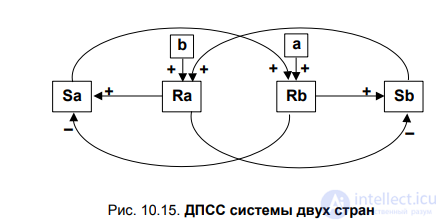
The final form of the CLD describing the interaction of the two countries is presented in Fig. 10.15. If we note that the variables Sa and Sb represent the levels of resources, and Ra and Rb represent the change in these levels, then we can further construct another figurative-symbolic model of the two-country system, known as a flow diagram.
The flow diagram (FD) is based on an analogy between the processes of resource exchange and the processes of water flow circulation in communicating vessels [55]. If we represent countries A and B as reservoirs of resources, the corresponding flow diagram will take the form presented in Fig. 10.16.
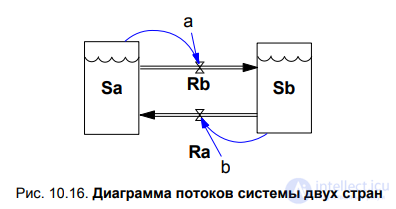
The figurative-symbolic models considered, CLD and FD, are excellent means of visualisation that facilitate the identification and understanding of the regularities in the course of the processes under study. Moreover, constructing a CLD and an FD is the first stage in creating mathematical simulation models.
Assignment
1. Investigate the activity of the private enterprise "Elita" using methods of figurative-symbolic and mathematical modelling:
a) construct a causal loop diagram describing the main regularities of the enterprise's activity;
b) based on the diagram constructed, form the mathematical relations of the simulation model;
c) conduct a simulation experiment.
The purpose of the study is to determine what share of funds (Di) should be
directed towards the development of the enterprise "Elita" in order to maximise
the owner's total income (Sum) over a period of 5 years.
Description of the activity of private enterprise "Elita"
The enterprise purchases raw materials and supplies and produces
consumer goods. The value of output (V) amounts to 200% of
the cost of raw materials and supplies (RM). The goods produced go to sale.
Revenue from sales (R) is distributed as follows:
20% of the revenue goes to taxes (T),
20% of the revenue - to staff wages (W),
Of the monetary resources remaining at the enterprise's disposal
(MRE), a certain share Di is invested in the development of production, 10% -
is withdrawn from the sphere of production and spent by the owner of the enterprise
on personal consumption (D). The remaining funds make up the volume of monetary resources intended for maintaining the production cycle (C). That is, they are again directed towards purchasing raw materials and supplies. The initial level of such resources at the starting moment in time
amounts to 10,000 monetary units.
Expenditure on the development of the enterprise (I) makes it possible to improve product quality and, consequently, increase the value of output. One
hryvnia invested in the development of the enterprise makes it possible to increase the ratio of the value of output to the cost of raw materials (O) by 0.01%.
2. Construct a causal loop diagram describing the process of an employee performing overtime work. Take into account
the influence of the employee's fatigue factor. Also take into account that if
the work is performed at an insufficient level of quality, it is considered
a defect and has to be redone (that is, in effect, done twice).
In the causal loop diagram, use the following variables:
Work – the volume of work performed in the current time period.
Defects – the volume of defects in the current time period (that is, the volume
of work that will need to be redone).
Defect rate – the share of defects in the work performed in the current time period.
Fatigue – the employee's fatigue in the current time period.
Norm – the labour productivity norm, that is, the volume of work
that the employee performs per unit of time in the absence of fatigue.
Completed – all the work done (that is, the volume of work performed since the start of activity).
Remainder – the remaining volume of work.
REVIEW QUESTIONS
1. Give a definition of the concept of "model".
2. What does the requirement of model adequacy mean?
3. List the types of models studied.
4. Give an example of a normative and a descriptive model.
5. How does a structural diagram differ from a model of a system's structure?
6. What is a mathematical model?
7. Give a comparative analysis of analytical, numerical and simulation modelling methods.
8. What is an economic-mathematical model?
9. On what basis are economic-mathematical models classified?
10. What are the peculiarities of the economy as an object of modelling?
CONCLUSIONS
Having studied Chapter 10, you have learned the following:
The reason for the widespread use of the modelling method in
scientific research is the fact that models contain within themselves
so-called potential knowledge, which endows them with explanatory and predictive power.
The main requirement for a model is the requirement of its adequacy to the object and purpose of the research.
The universal language of modelling is the artificial
language of mathematics. This language is free from the ambiguity and approximateness of natural languages. A description of the object under study by means of the mathematical language is called the mathematical model
of the object. If the object under study is an economic system or process, then the result of the modelling is
an economic-mathematical model.
The application of mathematical modelling methods in economics is complicated by the presence in economic systems of subjective factors, nonlinearity of relations, dynamism, stochasticity, and
counter-intuitiveness of economic processes

Comments