
Lecture
Recall that empirical research is factual
research that is aimed, primarily, at identifying
connections in the object under study and relies on data from observations and
experiments (Chapter 3).
The main methods of empirical research include
observation, comparison, measurement and experiment. These methods allow the researcher to obtain primary information in the form of a set of empirical data.
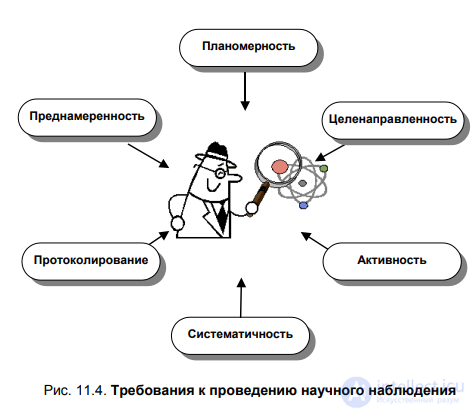
Observation is the systematic, purposeful perception of phenomena of objective reality, in the course of which
the researcher gains knowledge about the external aspects, properties and
relations of the objects under study.
In other words, observation is a study in which the experiment is set by nature itself, and the researcher acts as a "chronicler", recording the manifestations of the observed phenomenon (Fig. 11.4).
Comparison is the process of establishing the similarity and difference
of objects and phenomena of reality.
For the successful application of the comparison method, the following requirements must be met:
- first, the phenomena compared must have
a certain objective commonality between them;
- second, the comparison must be carried out according to those features
which are essential from the point of view of the stated purpose
of the research.
The objects under study can be compared in two ways:
1) directly;
2) through their comparison with some third object – a standard (reference).
In the first case, the results of the comparison are formulated in terms of "more – less". In the second case (when compared with a standard)
it becomes possible to obtain quantitative characteristics of the relationship between objects. Such comparisons are called measurements.
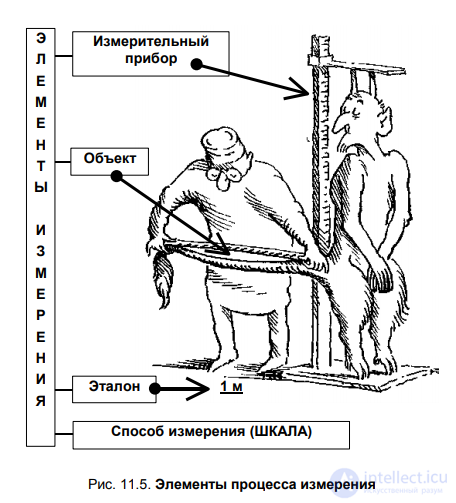
Measurement is a procedure for the quantitative comparison of objects; it is the process of assigning numbers to objects in such a way
that the relations between the numbers reflect the relations between the objects being measured (Fig. 11.5).
There are 4 ways (scales) of measurement:
- nominal scale,
- ordinal scale (rank scale),
212
212
- interval scale,
- ratio scale.
The nominal scale and the rank scale belong to non-metric
scales, since numbers are not directly assigned to phenomena. The
metric scales include the interval scale and the ratio scale.
The nominal scale (nominative, classification,
naming scale) is the simplest, qualitative scale, which is used to describe the belonging of objects to particular classes.
In the nominal scale, numbers are used only to designate
classes of objects. All objects of the same class are assigned one and
the same number. No relation of preference between objects is established.
The ordinal (rank) scale is a scale that is used to measure the ordering of objects by one or a set of features. The rank scale establishes an order in the degree of
expression of a feature – from the object with the most pronounced property to the object with the least pronounced property (or vice versa).
The order is, as a rule, numbered with natural numbers.
In the ordinal scale, numbers are used only to determine the
order in which objects follow one another. The numbers assigned to objects do not allow one to assert by how much or by what factor one object is preferable to another.
The interval scale is used to display the quantitative difference between properties of objects. This scale is based on the assumption that the difference in the manifestation of a feature in two objects corresponds to the difference of the two numbers assigned to
these objects. The interval scale allows one to say "by
how much" the property of one object exceeds the property
of another object.
213
213
Unlike the ratio scale, the interval scale is characterized by
the absence of an objective zero point. This scale may have arbitrary reference points.
Examples of the application of the interval scale: temperature measurement,
the release date of a product, a turner's grade, a school grade.
The ratio scale is used to display the quantitative difference between properties of objects in the presence of
an objective zero. In this scale, numbers reflect the relations of
the properties of objects. The ratio scale is based on the assumption that the ratio (division) of the degrees of manifestation of
a feature in two objects corresponds to the ratio (division) of the two
numbers assigned to these objects. The ratio scale allows one to
say "how many times" the property of one object exceeds the property of another object.
The interval scale is used when measuring the values of physical quantities – distance, weight, speed, etc.
The scales described are not mutually exclusive. There is
a possibility of converting data from one scale to another, which is illustrated in Example 11.3.
E
Example 11.3
Measurement scales and their conversion
At a certain enterprise, employees are tested
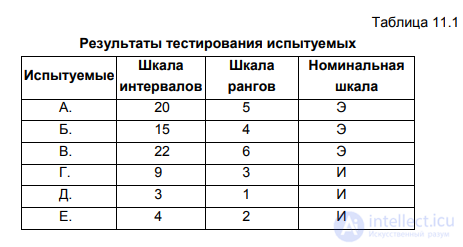
to analyze their sociability. The results of testing six subjects on the "extravert-introvert" scale of the Eysenck test are presented in Table 11.1 [49].
The first column of the table gives the names of the subjects, the second column gives the score describing the degree of "extraversion" of each
subject, in the third column the subjects are assigned ranks (the first
rank was given to the subject with the lowest score), in the fourth
column – in accordance with the initial scores the subjects are divided into two classes: the class of introverts "I" (scores from 0 to 12) and the class of
extraverts "E" (scores from 13 to 24).
214
214
Thus, the table presents measurements of the quality of extraversion-introversion of employees in accordance with the interval scale (column no. 2), the rank scale (column no. 3), and the nominal
scale (column no. 4).
Using the example of the table presented, it is easy to see that when moving from one scale to another, part of the information about the objects under study is lost. For example, as a result of ranking, a difference of one
rank is obtained by employees D. and E., who have a difference in interval
scores of one point, and employees B. and G., who have a difference in interval scores of six points. When distributing the subjects into classes,
one class includes employees who have very different
scores.
Experiment is a method of studying an object through active and purposeful influence on it by means of creating artificial conditions necessary for revealing the corresponding
properties of the object.
The advantages of experimental study of an object compared with observation are:
- controllability (the ability to actively control the process);
215
215
- "purity" of the research (in the course of the experiment one can study
the phenomenon "in pure form", eliminating incidental, non-essential factors);
- repeatability (trials can be conducted as many times as
necessary).
Depending on the means used to influence the object,
experiments are divided into natural and artificial.
An artificial experiment is an experiment in which
the object of research is isolated from ordinary conditions to some
required degree. Artificial experiments are typical of
the natural sciences.
A natural experiment is an experiment in which
the object of research is not isolated from ordinary conditions; they are only
supplemented with factors necessary for revealing the properties of the object
under study. Natural experiments are used in
the study of social phenomena.
A specific type of experiment is the social experiment.
A social experiment is the organization on a small
scale of new forms of social activity with the aim of their
scientific study.
Social experiments include economic experiments, pedagogical, psychological, socio-administrative ones and
so on. As an example of an economic experiment one can recall
the experiments in creating free economic zones in Ukraine and
Russia.
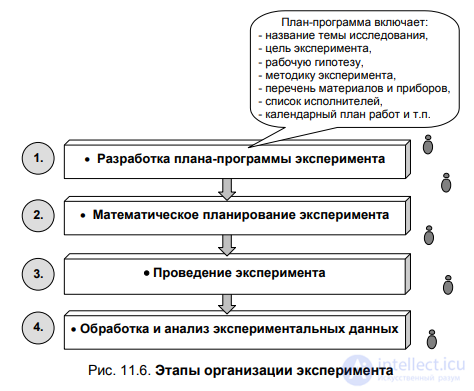
The stages of organizing an experiment are shown in Fig. 11.6. Stage
No. 2 – mathematical planning of the experiment involves the application of methods of mathematical statistics for the purpose of rationally organizing the experiment. Mathematical planning of the experiment
allows one to answer the question: how many and which trials (tests) should be included in the experiment in order to obtain a mathematical description
of complex objects of research. The benefit of logical and mathematical planning of experiments is illustrated in Example 11.4.
Example 11.4.
An experiment at the counter
Imagine that you are a customer and you suspect a certain
shop assistant of shortchanging customers on weight by slipping a "makeweight" under the scale pan. When making the purchase you cannot establish
the fact of deception, since you have no means of verifying the scale, and you do not want to
carry weights around with you. In such a situation two variants of your
actions are possible [21].
Variant No. 1. You buy the goods, come home, weigh
the goods on your own scale and discover that you have indeed been cheated: you
were charged for goods of weight B, whereas the true weight of the goods equals Bi.
217
217
Here B = Bi + Bn, where Bn is the weight of the "makeweight" placed under the scale
pan.
Variant No. 2. The shop assistant weighs the goods and tells you
the weight of the goods – B. After that you apologize, and ask to weigh two
portions of the goods separately (say, one part for you and one part for your beloved
mother-in-law). The shop assistant again weighs the goods and tells you the weight
of the two portions: B1 and B2. After that you analyze the result obtained. If the shop assistant did not resort to deception, the obvious equality B1 + B2 = B should hold. But if the shop assistant did after all use a "makeweight" under the scale, this equality will be violated: you
will see that B1 + B2 > B, or more precisely B1 + B2 = B + Bn. The reason for this is that
when weighing two portions of the goods, the weight of the "makeweight" will be
counted twice:  – the true weight
of the portions of goods. Hence 
(recall that B = Bi + Bn). This means that the difference between the results of the two
weighing stages will show by how much they are trying to cheat you.
In this way you can expose a dishonest shop assistant, and
experiment planning, which is used to
carry out the second weighing of the goods, will help you with this.
PRACTICAL COMPONENT
METHODS OF MATHEMATICAL STATISTICS
Purpose of the assignment:
- to become familiar with methods of processing empirical data;
- to acquire skills in calculating the pairwise correlation coefficient.
Supporting material
In the study of economic systems, a number of typical problems arise that are related to processing data from observations and experiments. What these problems have in common is that they consider
mass phenomena characterized by probabilistic relation-
218
218
ships. To solve problems of this kind, methods of mathematical statistics are used.
Mathematical statistics is the science that studies methods
for revealing regularities characteristic of large populations
of homogeneous objects, based on a sample survey of them.
Methods of mathematical statistics are methods intended for studying stochastic (probabilistic) dependencies.
Common methods of mathematical statistics include the methods of correlation, regression, variance and covariance analysis.
Correlation analysis is a set of methods of mathematical statistics intended to establish the fact
of the presence or absence of relationships between two or more quantitative indicators (variables, features) without describing
the form of these relationships.
One of the techniques of correlation analysis is the calculation of the pairwise correlation coefficient. This estimate allows one to study
the relationship between two indicators with an interval measurement scale.
The pairwise correlation coefficient r is calculated according
to the following formula:
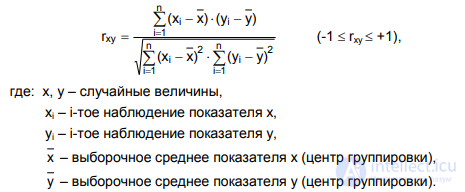
A positive sign of the pairwise correlation coefficient means
that as the values of one studied variable increase, the values of
219
219
the other also increase; a negative sign means that as one
variable increases, the other decreases. The absolute value (modulus) of the correlation coefficient indicates the strength of the relationship. By convention it is accepted that:
0 ≤ |r| ≤ 0.3 – weak relationship; 0.3 < |r| ≤ 0.7 – moderate relationship;
0.7 < |r| ≤ 1 – strong relationship. The relationship between indicators can be
complete, that is, functional, in which case the coefficient equals 1 or -1, or it
may be absent altogether, in which case the coefficient equals 0. If the dependence is incomplete, because it is distorted by the influence of other, extraneous
factors, then the coefficient will take intermediate values
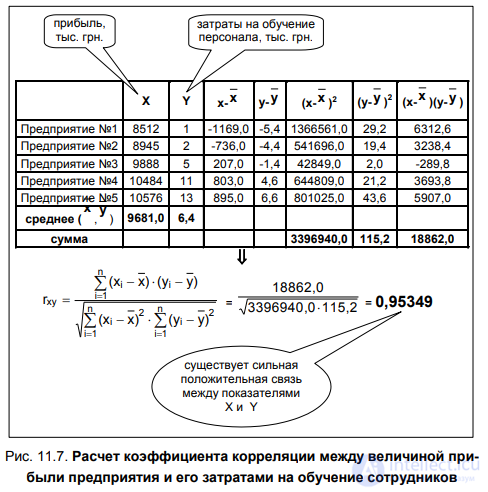
(between –1 and 0, or between 0 and 1) depending on the closeness of the relationship (Fig.
11.7). Thus, workers' labor productivity depends on length of service,
but there are also other factors that change this dependence (the worker's health, for example).
With the help of the correlation coefficient one can obtain answers
to the following questions: Is there a relationship between indicators x and y?
How close is the relationship between indicators x and y?
Here it should be remembered that the correlation coefficient is applicable
only to random variables that have a normal distribution.
Regression analysis is a method of mathematical statistics intended for revealing the analytical form
221
221
of the relationship between several indicators and describing the revealed dependencies by means of sufficiently simple mathematical expressions.
In regression analysis, among all the indicators (features, variables) under consideration, one indicator is regarded as the resultant feature (response), and this indicator is influenced by
the remaining explanatory variables (regressors).
Using the same data as correlation analysis, regression analysis attempts to fit a function that would best describe the dependence of the response on the regressors. The method of least
squares is used as the method for fitting such a function.
The method of least squares is a statistical technique used to estimate the unknown parameters of the relationship between indicators. Here, the criterion used for fitting the parameters is the minimization of the sum of squared deviations of the experimentally obtained values of the indicators from their
expected values (obtained in accordance with the regression
equation).
The equation of multiple linear regression has the form:

where y is the response, x are the regressors.
Analysis of variance is a method of establishing the fact
of the presence or absence of influence of one or several qualitative factors on a dependent variable.
Analysis of variance is used when all the explanatory variable-factors are qualitative, that is, their numerical or symbolic values determine the belonging of the given
observation (object) to one or another group, class. For example, a qualitative variable may have two values – M and F, determining the belonging of the objects under consideration to the male or female sex.
Covariance analysis is a set of methods of mathematical statistics intended for revealing the dependence of the mean value of some random variable on a set of variables that includes both quantitative and non-quantitative factors.
For the successful application of methods of mathematical statistics
the following conditions must be present:
1. The possibility of forming a population of observations, i.e. the possibility of repeatedly measuring the parameters of the same phenomenon under
different conditions (for example, measuring labor productivity at
different enterprises of a region, or at one and the same enterprise over
different years).
2. Qualitative homogeneity of the population – within the range of variation there should be no qualitative jump in the nature
of the phenomenon being reflected.
3. Sufficient dimension (size) of the population
of observations – only in a large population does a regular relationship between phenomena appear more stable than random coincidences.
Assignment
Calculate the pairwise correlation coefficient between two indicators characterizing phenomena of the subject
area you are studying. Draw conclusions about the relationship between the indicators considered.
REVIEW QUESTIONS
1. What is the difference between theoretical and empirical research?
2. List the methods of theoretical research.
3. Carry out a comparative analysis of the methods studied for constructing scientific theories.
4. List the methods of empirical research.
5. What requirements apply to the organization of observation of
the objects under study?
6. What is the difference between comparing and measuring objects?
7. Name the metric and non-metric measurement scales.
8. What is the difference between observation and experiment?
9. What types of experiments are distinguished?
10. List the main stages of organizing an experiment.
11. For solving which problems are methods of mathematical statistics applied?
12. What is the essence of correlation, regression, variance and covariance analysis?
13. How is the pairwise correlation coefficient calculated?
SUMMARY
Having studied Chapter 11, you have learned the following:
The general scientific methods of theoretical research include:
the thought experiment, idealization, formalization, the method of ascent from the abstract to the concrete, as well as methods of constructing scientific theories (the axiomatic method and the hypothetico-deductive method).
The general scientific methods of empirical research include
observation, comparison, measurement and experiment. Comparison is
the establishment of similarity or difference between objects. Measurement is the quantitative comparison of objects. Experiment is the study of an object
through active and purposeful alteration of its ordinary conditions.
Observation is an experiment that is set by nature itself.
There are four measurement scales: nominal, ordinal,
interval and ratio. Numbers play different roles in these scales. In
the nominal scale they denote classes of objects, in the ordinal scale
– ranks of objects, in the interval scale – the difference in the manifestation of a feature,
and in the ratio scale – the ratio of the degrees of manifestation of a feature in
objects.
To solve problems of processing data from observations and experiments in economic systems, methods of mathematical statistics are used. The methods of mathematical statistics include the methods of correlation, regression, variance and covariance analysis.
One of the techniques of correlation analysis is the calculation
of the pairwise correlation coefficient. This coefficient allows one to
establish the fact of the presence or absence of a relationship between two quantitative indicators, as well as to describe the strength of this relationship.

Comments