
Lecture
The study of attention is an important aspect of psychological research. There are many methods and tests for studying attention. Here are several of them:
The DVIT Test (Differential Verbal Intelligence Test): This test measures the ability to concentrate attention on verbal tasks. It includes various categories of tasks, such as logic, analysis, and synthesis.
The D2 Test (Test d2): This test is widely used to study selective attention and concentration. It includes rows of letters in which certain symbols must be identified while ignoring others.
The Stroop Test: This test measures the ability to suppress automatic reactions and maintain focus on the required task. It is often used to study attentional inhibition.
The Vigilance Task: This test is aimed at studying sustained attention over time. Participants must watch a monitor for a long period and respond to specific stimuli.
The Continuous Performance Test (CPT): This test is used to study the level of attention and the ability to sustain attention on a monotonous task for a long time.
The Digit Span Test: This test measures working memory and the ability to hold attention on a sequence of numbers.
The Trail Making Test: This test measures the ability to switch between different types of tasks and studies attentional flexibility.
The Cognitive Estimation Test: This test is aimed at studying the ability to estimate complex cognitive tasks and requires analysis of information.
The Simon Task: This test is used to study attention and the mechanisms of attention related to spatial orientation.
The Time Perspective Test: This test helps study how attention relates to time and how people evaluate the past, present, and future.
Program A.
What type of attention predominates in the student during the lesson?
Note instances of concentration, stability, distribution, and switching of attention, and its distraction. What causes them?
What techniques did the teacher use to maintain attention during the lesson?
What external signs can be used to judge the presence of attention in students?
What are the causes of students' inattentiveness during the lesson?
Program B.
Observation protocol for students' attention during the lesson?
Purpose of the observation:
Recording the state of students' attention at different stages of the lesson.
Identifying the means used by the teacher to activate students' attention.
Formulating brief recommendations for managing students' attention during the lesson.
Date of observation:
Class, school:
Subject: Lesson topic:
Teacher's full name:
|
Time stages of the lesson |
Structural stages of the lesson |
Teacher's activity |
Students' activity |
Assessment of students' attention on a scale (1 to 5) |
|
|
|
|
|
|
Based on the observed facts recorded in the protocol, a graph of the fluctuation of students' attention during the lesson is compiled.
Purpose of the study: to determine the level of attention selectivity.
Materials and equipment: a test form, a pencil, and a stopwatch.
Study procedure
The study is conducted in pairs consisting of an experimenter and a subject. The experimenter reads the instructions to the subject, presents the test form, and records the time taken to complete the task.
Instructions to the subject: "You will be given a test with letters and words printed line by line. Find and underline the words in it. Try not to miss a single word and work quickly, since the time is being recorded. If everything is clear and you have no questions, then 'Begin!'"
The test form looks as follows:
|
Subject: |
|
Experimenter: |
|
Test |
|
|
After the experiment, the subject reports on how they performed the assigned task.
Processing and analysis of results
The indicators of attention selectivity in this study are the time taken to complete the task and the number of errors and omissions in finding and underlining the words. There are a total of 25 words in this test: sun, district, news, fact, exam, prosecutor, theory, hockey, throne, television, memory, perception, love, performance, joy, people, report, competition, personality, swimming, comedy, despair, laboratory, foundation, psychiatry.
The results are evaluated using a scoring scale, in which points are awarded depending on the time spent searching for words. One point is deducted for each missed word.
|
Time (in sec.) |
Score |
Level of attention selectivity |
|
250 or more |
0 |
I low |
|
240–249 |
1 |
I low |
|
230–239 |
2 |
I low |
|
220–229 |
3 |
I low |
|
210–119 |
4 |
I low |
|
200–209 |
5 |
I low |
|
190–199 |
6 |
I low |
|
180–189 |
7 |
II medium |
|
170–179 |
8 |
II medium |
|
160–169 |
9 |
II medium |
|
150–159 |
10 |
II medium |
|
140–149 |
11 |
II medium |
|
130–139 |
12 |
II medium |
|
120–129 |
13 |
II medium |
|
110–119 |
14 |
III high |
|
100–109 |
15 |
III high |
|
90–99 |
16 |
III high |
|
80–89 |
17 |
III high |
|
70–79 |
18 |
III high |
|
60–69 |
19 |
III high |
|
Less than 60 |
20 |
IV very high |
The points on the proposed scoring scale make it possible to establish absolute values of qualitative assessments of the level of attention selectivity. In cases where a subject scores from 0 to 3 points, it is important, based on self-report and observation of the course of the experiment, to determine the cause of the poor selectivity. These may include: a state of strong emotional experience, external interference that led to frustration in the subject, a hidden reluctance to be tested, and so on.
In most cases there is a connection between the missed and found words and the individual experience and activities of the person being tested.
Attention selectivity can be trained. Exercises similar to this test can be suggested to improve it.
A very high level of attention selectivity is evidence of phenomenal mental activity in a person.
Purpose of the study: to determine the level of concentration of attention.
Materials and equipment: a Pieron-Ruser test form, a pencil, and a stopwatch.
Study procedure
The study can be conducted with a single subject or with a group of 5–9 people. The main conditions when working with a group are to comfortably seat the subjects, provide each with test forms and pencils, and ensure silence is maintained during testing.
Instructions to the subject: "You are given a test showing a square, a triangle, a circle, and a rhombus. At the signal 'Begin,' place the following marks in these geometric shapes as quickly and accurately as possible: in the square — a plus, in the triangle — a minus, in the circle — nothing, and in the rhombus — a dot. Place the marks in sequence, row by row. You have 60 seconds to complete the task. Stop placing marks at my signal 'Stop!'"
The form with the geometric shapes for the Pieron-Ruser test looks as follows:
Subject: ____________ Date _______
Experimenter: _________ Time _______
Test
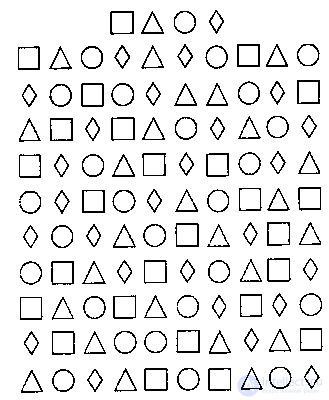
During the study, the experimenter keeps track of time using a stopwatch and gives the commands "Begin!" and "Stop!"
The reliability of the study results is achieved through repeated testing, which is best conducted at significant time intervals.
Processing and analysis of results
The results of this testing are: the number of geometric shapes processed by the subject in 60 seconds, including the circles, and the number of errors made.
The level of attention concentration is determined using the table.
|
Number of shapes processed |
Rank |
Level of attention concentration |
|
100 |
1 |
very high |
|
91–99 |
2 |
high |
|
80–90 65–79 |
3 4 |
medium low |
|
64 or fewer |
5 |
very low |
The rank is reduced for errors made while performing the task. If there are 1–2 errors, the rank is reduced by one; if there are 3–4, the concentration of attention is considered worse by two ranks; and if there are more than 4 errors, the rank is reduced by three.
When analyzing the results, it is necessary to establish the causes that led to these results. Among them, an important factor is the subject's mindset — their readiness to follow the instructions and process the shapes by placing marks in them as quickly as possible, versus their orientation toward error-free completion of the test. In some cases, the concentration score may be lower than possible due to an excessive desire on the person's part to demonstrate their abilities and achieve the maximum result (that is, a kind of competitiveness). Reduced concentration of attention can also be caused by fatigue, poor eyesight, or illness.
Purpose of the study: to determine the level of attention-switching ability.
Equipment: a stopwatch and a modified numeric Schulte table. The table has 49 squares containing black and red numbers arranged in a random combination that rules out memorization. The cells with numbers measure 5x5 cm and are arranged in rows of 7 — 7 horizontally and 7 vertically. The lines dividing the working field into cells are thin and black.
Study procedure
Three people take part in the testing: the experimenter, the subject, and an observer-recorder.
The study consists of three series conducted one after another. In the first series, the subject is asked to name and point to the black numbers in ascending order; in the second, the red numbers in descending order; and in the third, they must name and point to black and red numbers alternately, with the black numbers named in ascending order as in the first series, and the red numbers in descending order.
The table of black-and-red numbers looks as follows:
|
15 |
17 |
13 |
6 |
7 |
3 |
1 |
|
4 |
2 |
8 |
22 |
20 |
14 |
20 |
|
19 |
18 |
24 |
4 |
18 |
10 |
16 |
|
6 |
23 |
9 |
13 |
25 |
5 |
7 |
|
2 |
21 |
21 |
16 |
10 |
14 |
22 |
|
11 |
3 |
9 |
23 |
1 |
19 |
11 |
|
17 |
5 |
12 |
15 |
8 |
12 |
24 |
The subject is seated comfortably at a table and given a small pointer.
The experimenter's task is to instruct the subject before each series, give the command "Begin!" for the search and naming, and monitor with a stopwatch the time spent by the subject completing the series.
The observer-recorder helps the experimenter identify errors made by the subject during the task and keeps a record of the study.
Subject: ________ Date: _________
Experimenter: ____ Time: _________
|
Series 1 |
Series 2 |
Series 1 + Series 2 |
Series 3 |
||||
|
time |
errors |
time |
errors |
time |
errors |
time |
errors |
|
|
|
|
|
|
|
|
|
The table is presented to the subject in each series only after the instructions, at the signal "Begin!", so that the subject does not search for the location of the corresponding numbers in advance.
Instructions to the subject for the first series: "Take the pointer. You will be shown a table with red and black numbers. As quickly and accurately as possible, find and point to all the black numbers in ascending order from 1 to 25. There is no need to name the color, only the number itself. If everything is clear, then get ready. Begin!"
Instructions to the subject for the second series: "On the same table, find and point to all the red numbers in descending order from 24 to 1. Try to work quickly and without errors. There is no need to name the color of the number, name only the number itself. Get ready! Begin!"
Before the start of each series, a 3–4 minute break is given for the subject to rest.
Instructions to the subject for the third series: "On the table of black-and-red numbers, as quickly and accurately as possible, find, name, and point to red and black numbers alternately. The black numbers should increase in sequence, and the red numbers should decrease. Begin with the black number 1 and the red number 24. There is no need to name the color of the number, only the number itself. If everything is clear and you have no questions, then get ready. Begin!"
If the subject makes a mistake during any of the series, they must find the error themselves; in rare, particularly difficult cases, a hint from the observer-recorder is allowed. The stopwatch is not stopped during this.
After the entire study is completed, the subject gives a self-report. Use the self-report to determine the strategy used to search for the numbers and the features of how the tasks were performed.
Processing of results
During the processing of results, it is necessary to:
Compile a graph of the time spent by the subject completing the three series of the study.
Determine the attention-switching time. The attention-switching time is calculated as the difference between the time for the third series and the combined time of the first and second series. The switching time indicator "T" is calculated using the formula:
T = T3 – (T1+T2),
where T1 — the time spent by the subject completing the first series;
T2 — the time spent completing the second series;
T3 — the time spent completing the third series.
Analysis of results
The subject's level of development of attention-switching ability is determined using the table.
|
Switching time T (in sec.) |
Rank |
Level of attention switching |
|
less than 60 sec |
1 |
high |
|
60–90 |
2 |
high |
|
91–100 |
3 |
medium |
|
101–120 |
4 |
medium |
|
121–150 |
5 |
medium |
|
151–180 |
6 |
medium |
|
181–200 |
7 |
medium |
|
201–250 |
8 |
low |
|
251 or more |
9 |
low |
Since the speed of completing the first and second series significantly affects the final attention-switching score, if the subject completed the tasks in the first or second series in less than 33 seconds, the final score should be increased by raising the rank by one or two. If in the first or second series the subject spent more than 60 seconds searching for the numbers, the rank number is increased by 1 or 2, meaning the switching level is determined to be lower.
If the switching time turns out to be less than or equal to "0," the experiment must be repeated. This means the subject did not follow the instructions in the first or second series.
When analyzing the results, it is important to trace the specifics of how the subject searched for the numbers, and the features of how they got out of difficulties when a number could not be found immediately for some reason. Some people experience difficulty when the sought-after number is located near the one just found, while others have difficulty when it is far away.
Based on the analysis of quantitative indicators, the graph of the time taken to complete the three series, the number of errors made, the subject's verbal report, and the observations of the experimenter and recorder, one can describe the character of attention switching, taking into account the features of concentration, and suggest recommendations for its development. In adolescence, students can train their switching ability by changing types of activity, alternating self-study across academic subjects in different ways. Exercises suited to this test are those involving switching attention from one object of observation to others, and alternately performing different actions.
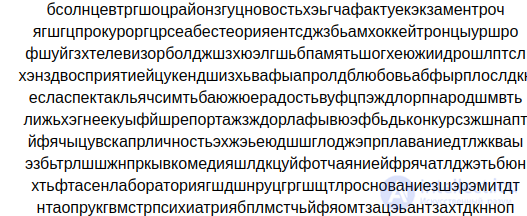
The method is aimed at determining attention selectivity. It is recommended for use in professional selection for occupations that require good selectivity and concentration of attention, as well as high noise immunity.
Instructions: Among the letter text there are words. Your task is to underline these words while reading the text as quickly as possible.
Example: ryuklbyusradostufrknp''
Working time — 2 min.
The method is used both in groups and individually. The number of words identified and the number of errors (missed and incorrectly identified words) are evaluated.
Stimulus material

Subject's name _________________________________________
Purpose: to measure the degree of concentration and stability of visual attention using the "Tangled Lines" method (fig. 1.3).
Equipment: stopwatches, special forms).
Procedure. The experiment can be conducted either individually or in a group. Before starting the work, the subjects are read the following instructions: "In front of you on the form is a series of lines tangled together. Each of them begins on the left and ends on the right. Your task is to trace each line from left to right and write its number in the cell where it ends. Start with line 1, then move to line 2, and so on to the end. You must follow the lines only with your eyes; you may not help yourself with your fingers or a pencil. Try to work quickly and make no mistakes."
If the experiment is conducted collectively, the following is added to the instructions: "When you finish the task, raise your hand. I will tell you the time it took you to complete the task, and you should write it down at the bottom of the form."
Another version of the experiment involves a time limit for completing the task, after which the command "Stop!" is given and work stops (depending on the composition of the subjects, a 7- or 10-minute interval can be set).
While observing subjects performing the task, the experimenter watches for what predominates in the subject — a focus on speed or on accuracy; whether the subject is confident, whether they check themselves or not; whether they experience difficulty in tracing (at the beginning, middle, or end of the task); and whether they try to help themselves (despite the prohibition) with a finger or pencil. In doing so, one can record the time it takes the subject to trace every 5 lines in order (1 through 5, 6 through 10, and so on), which will make it possible to judge the effect of fatigue on task performance. In this case, the protocol form for the study is the same as for the Schulte tables. After finishing the work, the subject should be asked what difficulties they experienced, whether they think they did the task well or not, and why they think so.
Form for the "Tangled Lines" method
Full name______________ Date________
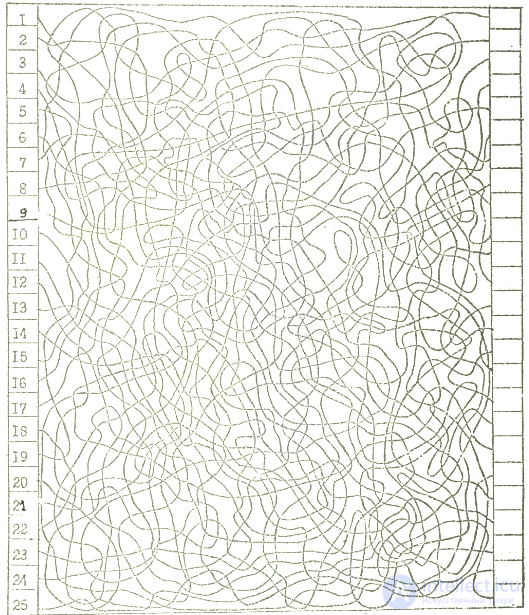
Processing of results. In the time-limited version, processing comes down to counting (using a pre-prepared "key") the number of correctly traced lines (the number of errors and the number of lines left untraced); in the version without a time limit, the time taken to complete the task is also added. In the latter case, one can calculate a task-success indicator (Y):

where T — the time taken to complete the task (min),
N cor. — the number of correctly traced lines.
The resulting scores are interpreted on the basis that errors in tracing the lines and a slow pace of work (a long search time), with normal visual acuity, indicate weak concentration of attention. The stability (or, conversely, the exhaustibility) of concentrated attention is judged by whether the pace of work is maintained (or decreases) from the beginning to the end of the task.
After obtaining individual success scores (Y) or the number of correctly traced lines (in the time-limited version), the corresponding group-average scores are calculated, 95% confidence intervals are constructed, and diagnostic conclusions are drawn. The results can be compared with data obtained from various groups of subjects.
Scoring criteria for the "Tangled Lines" method:
|
19 or more |
– excellent; |
4–9 |
– satisfactory; |
|
10–18 |
– good; |
3 or fewer |
– unsatisfactory. |
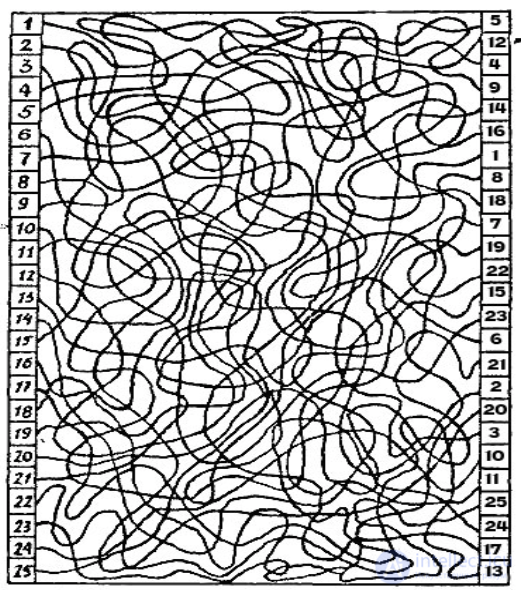
Figure 1.3. Key to the "Tangled Lines" method
The method is designed to assess voluntary attention. It is recommended for use in professional selection for occupations requiring well-developed attention functions.
Instructions: Within 2 minutes, you must arrange, in the free cells of the answer form, in ascending order the numbers that are placed in random order in the 25 cells of the stimulus-material square.
Stimulus material Answer form
|
16 |
37 |
98 |
29 |
54 |
|
|
|
|
|
|
|
80 |
92 |
46 |
59 |
35 |
|
|
|
|
|
|
|
43 |
21 |
8 |
40 |
2 |
|
|
|
|
|
|
|
65 |
84 |
99 |
7 |
77 |
|
|
|
|
|
|
|
13 |
67 |
60 |
34 |
18 |
|
|
|
|
|
|
Numbers are written row by row; no marks may be made in the left square.
Evaluation is based on the number of correctly recorded numbers. The average norm is 22 numbers or more.
The method is convenient for group testing. Group testing is recommended to be conducted in the presence of the experimenter.
Key
|
2 |
7 |
8 |
13 |
16 |
|
18 |
21 |
29 |
34 |
35 |
|
37 |
40 |
43 |
46 |
54 |
|
59 |
60 |
65 |
67 |
77 |
|
80 |
84 |
92 |
98 |
99 |
The method is designed to assess the volume, distribution, and switching of attention. It is applied both in groups and individually.
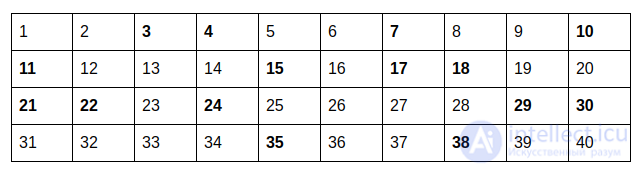
In a square with 25 cells, numbers from 1 to 40 are arranged in random order. 15 numbers are omitted. The subject must cross out, in the numeric sequence, the numbers that are missing from the square.
Instructions: In front of you is a square with 25 numbers and a numeric sequence of 40 numbers. You need to cross out 15 numbers in the numeric sequence that are missing from the square. It is desirable to work without corrections. Completion time — 1.5 minutes.
Stimulus material:
|
14 |
5 |
31 |
27 |
37 |
|
40 |
34 |
23 |
1 |
20 |
|
19 |
16 |
32 |
13 |
33 |
|
2 |
6 |
8 |
25 |
9 |
|
12 |
26 |
36 |
28 |
39 |
|
1 |
2 |
3 |
4 |
5 |
6 |
7 |
8 |
9 |
10 |
|
11 |
12 |
13 |
14 |
15 |
16 |
17 |
18 |
19 |
20 |
|
21 |
22 |
23 |
24 |
25 |
26 |
27 |
28 |
29 |
30 |
|
31 |
32 |
33 |
34 |
35 |
36 |
37 |
38 |
39 |
40 |
Evaluation of results.
When processing, the number of correct answers is counted. Omissions and corrections are counted as errors.
Scoring scale (distribution of attention)
|
Number of correct answers |
15 |
14 |
12–13 |
10–11 |
8–9 |
6–7 |
5 |
4 |
3 |
|
Score in points |
9 |
8 |
7 |
6 |
5 |
4 |
3 |
2 |
1 |
Key
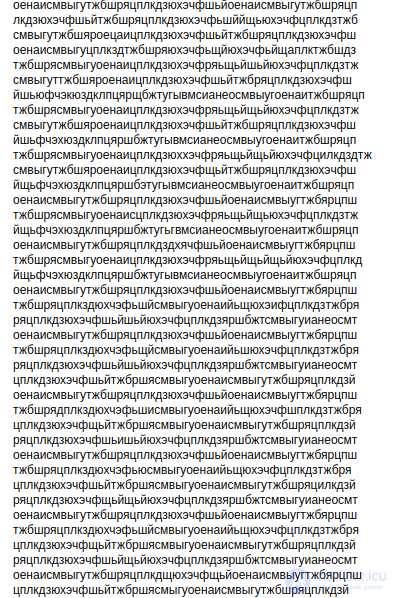
To conduct the study, a standard "Proofreading Test" form and a stopwatch are required. The form has some letters of the Russian alphabet printed in random order, including the letters "к" and "р"; a total of 2000 characters, 50 letters per line.
Procedure. The study should be conducted individually. It should begin only after making sure that the subject wants to complete the task. The subject should not get the impression that they are being examined. The subject should sit at a table in a position comfortable for performing this task. The experimenter hands them the "proofreading test" form (see appendix 1) and explains the following instructions: "The form has letters of the Russian alphabet printed on it. Going through each line in sequence, find the letters 'к' and 'р' and cross them out. The task must be completed quickly and accurately." The subject begins working on the experimenter's command. When, after some time, the experimenter says: "Line!" — you should draw a vertical line at the point in the row where the command caught you. After ten minutes, the last letter examined is marked.
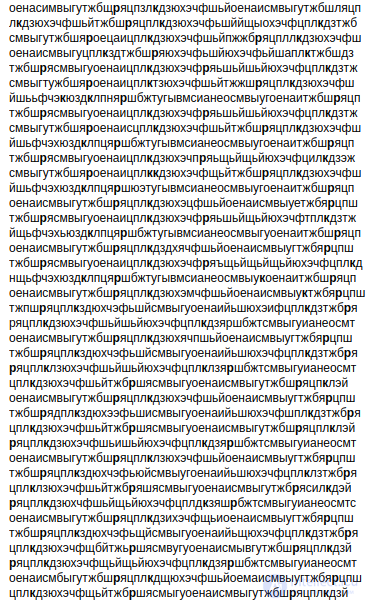
When processing the data obtained, the psychologist checks the results in the subject's proofreading forms against the program — the key to the test.
The following data are entered from the session protocol into the student's psychological record: the total number of letters reviewed in 10 minutes, the number of correctly crossed-out letters during the work time, and the number of letters that needed to be crossed out.
PROTOCOL OF THE STUDY OF ATTENTION STABILITY ASSESSMENT
Student __________________________________________ Class ______
Age ______________ Sex __________ Date __________________
|
Indicators |
Results |
|
Number of letters reviewed in 10 min |
|
|
Number of correctly crossed-out letters |
|
|
Number of letters that needed to be crossed out |
|
|
Accuracy of task completion, % |
|
|
Accuracy score, points |
|
|
Productivity score, points |
|
|
Attention stability score, points |
|
Attention productivity is calculated as the number of letters reviewed in 10 minutes, and accuracy is calculated using the formula:
K = m/n 100%
where K — accuracy, n — the number of letters that needed to be crossed out, m — the number of correctly crossed-out letters during the work.
The normative indicators for mentally healthy young people are up to 10–15 errors during ten minutes of work.
In order to obtain an integral indicator of attention stability, the accuracy and productivity scores must be converted into corresponding points using Table 1.1, obtained through standard scaling.
Table 1.1 Assessment of attention stability in points
|
Productivity |
Accuracy |
Productivity |
Accuracy |
||||
|
characters |
points |
% |
points |
characters |
points |
% |
points |
|
less than 1010 |
1 |
less than 70 |
1 |
2660–2825 |
16 |
84–85 |
12 |
|
1010–1175 |
3 |
70–72 |
2 |
2825–2990 |
17 |
85–87 |
13 |
|
1175–1340 |
5 |
72–73 |
3 |
2990–3155 |
18 |
87–88 |
14 |
|
1340–1505 |
7 |
73–74 |
4 |
3155–3320 |
19 |
88–90 |
15 |
|
1505–1670 |
9 |
74–76 |
5 |
3320–3485 |
20 |
90–91 |
16 |
|
1670–1835 |
10 |
76–77 |
6 |
3485–3650 |
21 |
91–92 |
17 |
|
1835–2000 |
11 |
77–79 |
7 |
3650–3815 |
22 |
92–94 |
18 |
|
2000–2165 |
12 |
79–80 |
8 |
3815–3980 |
23 |
94–95 |
20 |
|
2165–2330 |
13 |
80–81 |
9 |
3980–4145 |
24 |
95–96 |
22 |
|
2330–2495 |
14 |
81–83 |
10 |
4145–4310 |
25 |
96–98 |
24 |
|
2495–2660 |
15 |
83–84 |
11 |
more than 4310 |
26 |
more than 98 |
26 |
The integral indicator of attention stability (A) is calculated using the formula: A = B + C, where B and C are the point scores for productivity and accuracy respectively.
To compare data on attention stability with other properties of the attentional function, it is necessary to again convert the integral attention-stability indicator into scale scores using Table 1.2.
Table 1.2 – Scale for converting attention property indicators into comparable scale scores
|
Scale score |
Attention stability |
Attention switching |
Attention span |
Scale score |
Attention stability |
Attention switching |
Attention span |
|
19 |
more than 50 |
more than 217 |
less than 115 |
9 |
25–27 |
172–181 |
216–235 |
|
18 |
– |
– |
– |
8 |
23–24 |
158–171 |
236–265 |
|
17 |
48–49 |
214–216 |
116–125 |
7 |
20–22 |
149–157 |
266–295 |
|
16 |
46–47 |
211–213 |
126–135 |
6 |
16–19 |
142–148 |
296–335 |
|
15 |
44–45 |
208–210 |
136–145 |
5 |
14–15 |
132–141 |
336–375 |
|
14 |
39–43 |
205–209 |
146–155 |
4 |
12–13 |
122–131 |
376–405 |
|
13 |
36–38 |
201–204 |
156–165 |
3 |
9–11 |
114–121 |
406–455 |
|
12 |
34–35 |
195–200 |
166–175 |
2 |
– |
110–113 |
– |
|
11 |
31–33 |
189–194 |
176–195 |
1 |
– |
– |
– |
|
10 |
28–30 |
182–188 |
196–215 |
0 |
less than 9 |
less than 109 |
more than 456 |
"Proofreading Test"
Key
To conduct the study, Gorbov-Schulte tables measuring 49 x 49 cm with numbers from 1 to 25 in black and from 1 to 24 in red (fig. 2), a stopwatch, and a pointer are required. A protocol must be prepared in advance for recording the time and errors made while searching for the numbers.
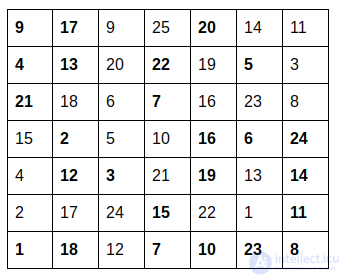
Figure 1.2 – Black-and-red Gorbov-Schulte table for studying attention switching.
Note. The highlighted numbers are black.
Procedure. The session is conducted individually with each subject. A black-and-red table is placed vertically on the table in front of them, a pointer is given, and the following instructions are provided: "The table contains 25 black numbers from 1 to 25 and 24 red numbers from 1 to 24. You need to point to and name the black numbers in ascending order from 1 to 25, and the red numbers in descending order from 24 to 1. You must count alternately: first name a black number, then a red one, then a black one again, followed by a red one, and so on until the count is finished. The task must be performed quickly and without errors." The experimenter records in the protocol the time separately for each of the five stages (ten numbers per stage) and the subject's errors of the following types: order substitution – an error in which the subject, while naming numbers in ascending order, begins naming them in descending order, or vice versa; number substitution – changing its sequential position: naming 21 instead of 23; color substitution – naming and pointing to a red number instead of a black one.
The task takes approximately 90 seconds to complete.
Protocol for assessing attention switching
|
Time recording by stage, sec |
Black numbers |
Error recording |
Red numbers |
Error recording |
|
|
1 |
|
24 |
|
|
|
2 |
|
23 |
|
|
t 1 |
3 |
|
22 |
|
|
|
4 |
|
21 |
|
|
|
5 |
|
20 |
|
|
|
6 |
|
19 |
|
|
|
7 |
|
18 |
|
|
t 2 |
8 |
|
17 |
|
|
|
9 |
|
16 |
|
|
|
10 |
|
15 |
|
|
|
11 |
|
14 |
|
|
|
12 |
|
13 |
|
|
t 3 |
13 |
|
12 |
|
|
|
14 |
|
11 |
|
|
|
15 |
|
10 |
|
|
|
16 |
|
9 |
|
|
|
17 |
|
8 |
|
|
t 4 |
18 |
|
7 |
|
|
|
19 |
|
6 |
|
|
|
20 |
|
5 |
|
|
|
21 |
|
4 |
|
|
|
22 |
|
3 |
|
|
t 5 |
23 |
|
2 |
|
|
|
24 |
|
1 |
|
|
|
25 |
|
|
|
Interpretation of results: An increase in time and number of errors from the 1st to the 5th interval indicates depletion of nervous processes and a slowing of their mobility toward the end of the task.
When processing the results, the overall attention-switching index is calculated, equal to the sum of the indicators for the five stages. To calculate it, the success of performing the "number search with switching" task must be determined separately for each stage. The single evaluation criterion reflecting the attention-switching index equals the number-search time adjusted for errors made. It is calculated using the formula:
A = T – E, where
A – the attention-switching index,
T and E – the scaled scores for time and errors, respectively.
The scaled scores for time and errors in attention switching are given in Tables 3 and 4.
To compare cross-modal attentional characteristics, the individual attention-switching index must be converted into scaled scores (Table 1.3).
Table 1.3 – Attention-switching score
|
Stages |
|||||||||
|
1 |
2 |
3 |
4 |
5 |
|||||
|
time |
score |
time |
score |
time |
score |
time |
score |
time |
score |
|
less than 16 |
44 |
less than 29 |
44 |
less than 32 |
44 |
less than 28 |
45 |
less than 30 |
44 |
|
17–21 |
43 |
29–34 |
43 |
31–40 |
43 |
29–34 |
44 |
31–34 |
43 |
|
22–26 |
42 |
35–39 |
42 |
41–48 |
42 |
35–39 |
43 |
35–38 |
42 |
|
27–30 |
41 |
40–44 |
41 |
49–56 |
41 |
40–45 |
42 |
39–42 |
41 |
|
31–35 |
40 |
45–49 |
40 |
57–64 |
40 |
46–50 |
41 |
43–46 |
40 |
|
36–40 |
39 |
50–54 |
39 |
65–76 |
39 |
51–56 |
40 |
47–50 |
39 |
|
41–45 |
38 |
55–59 |
38 |
77–84 |
38 |
57–62 |
39 |
51–54 |
38 |
|
46–50 |
37 |
60–64 |
37 |
85–92 |
37 |
63–67 |
38 |
55–58 |
37 |
|
51–54 |
36 |
65–69 |
36 |
93–100 |
36 |
68–73 |
37 |
59–62 |
36 |
|
55–59 |
35 |
70–74 |
35 |
101–108 |
35 |
74–78 |
36 |
63–66 |
35 |
|
60–64 |
34 |
75–79 |
34 |
109–116 |
34 |
79–84 |
35 |
67–70 |
34 |
|
65–69 |
33 |
80–84 |
33 |
117–124 |
33 |
85–90 |
34 |
71–74 |
33 |
|
70–74 |
32 |
85–89 |
32 |
125–132 |
32 |
91–95 |
33 |
75–78 |
32 |
|
75–78 |
31 |
90–94 |
31 |
133–140 |
31 |
96–101 |
32 |
79–82 |
31 |
|
79–83 |
30 |
95–99 |
30 |
141–148 |
30 |
102–106 |
31 |
83–86 |
30 |
|
84–88 |
29 |
100–104 |
29 |
149–156 |
29 |
107–112 |
30 |
87–90 |
29 |
|
89–93 |
28 |
105–109 |
28 |
157–164 |
28 |
113–118 |
29 |
91–94 |
28 |
|
94–98 |
27 |
110–114 |
27 |
165–172 |
27 |
119–123 |
28 |
95–98 |
27 |
|
99–102 |
26 |
115–119 |
26 |
173–180 |
26 |
124–129 |
27 |
99–102 |
26 |
|
103–107 |
25 |
120–124 |
25 |
181–188 |
25 |
130–134 |
26 |
103–106 |
25 |
|
108–112 |
24 |
125–129 |
24 |
189–196 |
24 |
135–140 |
24 |
107–110 |
24 |
|
113–117 |
23 |
130–134 |
23 |
more than 196 |
23 |
141–146 |
23 |
111–114 |
23 |
|
more than 117 |
22 |
135–139 |
22 |
– |
22 |
147–151 |
22 |
115–118 |
22 |
|
– |
– |
more than 139 |
21 |
– |
– |
more than 151 |
– |
119–122 |
21 |
|
– |
– |
– |
– |
– |
– |
– |
– |
more than 122 |
20 |
It makes sense to analyze the experimental data in several directions. First, by comparing the data, it is necessary to draw a conclusion about the presence or absence of age-related differences across the groups examined as a whole. Second, the degree of individual variation should be assessed, that is, the extent to which the data obtained for a given subject differ from the group-average indicators. And finally, if we have experimental data on the development of other attentional characteristics, an inter-individual analysis can be performed by relating the scaled scores for different attentional properties to one another.
Table 1.4 Score for attention-switching errors
|
Stages |
Number of errors |
Errors, points |
||
|
color |
number |
order |
||
|
I |
1 2 3 |
2 4 6 |
2 6
|
4 8 |
|
II |
1 2 3 4 |
1.5 3 4.5 6 |
1.5 3 4.5 7.5 |
4.5 6 |
|
III |
1 2 3 4–5 |
1 2 3 6 |
1 2 3 |
1 4 6 |
|
IV |
1 2 3 |
2 5 8 |
1.5 3 8 |
2 |
|
V |
1 2 3 |
2 5 8 |
1.5 3 8 |
2
|
The method is borrowed from occupational psychology (the so-called Schulte tables), but has wide application in the field of pathology. It can be used to study mental tempo, more precisely to detect the speed of exploratory-search eye movements, and to study attention span (with respect to visual stimuli).
To conduct the test, five tables measuring 60x60 cm are needed, with numbers from 1 to 25 written on them in random order (Figure 1.1). The numbers are arranged differently on each of the five tables. In addition, a stopwatch and a small pointer, about 30 cm long, are needed. The test can be conducted with subjects who have completed at least 4 years of schooling.
Figure 1.1. Tables for locating numbers.
|
21 |
12 |
7 |
1 |
20 |
|
9 |
5 |
11 |
23 |
20 |
|
14 |
18 |
7 |
24 |
21 |
|
6 |
15 |
17 |
3 |
18 |
|
14 |
25 |
17 |
19 |
13 |
|
22 |
1 |
10 |
9 |
6 |
|
19 |
4 |
8 |
25 |
13 |
|
3 |
21 |
7 |
16 |
1 |
|
16 |
5 |
8 |
20 |
11 |
|
24 |
2 |
22 |
10 |
5 |
|
18 |
12 |
6 |
24 |
4 |
|
23 |
2 |
25 |
3 |
15 |
|
9 |
14 |
11 |
23 |
16 |
|
8 |
15 |
10 |
2 |
22 |
|
19 |
13 |
17 |
12 |
4 |
|
|
|
|
|
|
|
|
|
|
|
|
|
|
|
|
|
|
|
|
|
22 |
25 |
7 |
21 |
11 |
|
|
|
5 |
14 |
12 |
23 |
2 |
|
|
|
|
|
6 |
2 |
10 |
3 |
23 |
|
|
|
16 |
25 |
7 |
24 |
13 |
|
|
|
|
|
17 |
12 |
16 |
5 |
18 |
|
|
|
11 |
3 |
20 |
4 |
18 |
|
|
|
|
|
1 |
15 |
20 |
9 |
24 |
|
|
|
8 |
10 |
19 |
22 |
1 |
|
|
|
|
|
19 |
13 |
4 |
14 |
8 |
|
|
|
21 |
15 |
9 |
17 |
6 |
|
|
The subject is briefly shown the table, with the accompanying words: "On this table, the numbers from 1 to 25 are arranged out of order." The table is then covered, i.e., placed face down on the table, and the instruction continues: "You will need to use this pointer to point to and name aloud all the numbers in order from 1 to 25. Try to do this as quickly as possible, but without making mistakes, understood?" (If the subject does not understand, the instructions are explained again, without showing the table). Then the experimenter simultaneously places the table vertically directly in front of the patient's face, at a distance of 70–75 cm from him, and, starting the stopwatch, says: "Begin!"
While the subject points to and names the numbers, the experimenter monitors the correctness of their actions, and when the subject names the number "25," the experimenter stops the stopwatch.
After the first table, without any additional instructions, the subject is asked to find the numbers on the 2nd, 3rd, 4th, and 5th tables in the same way.
The test protocol takes the following form:
|
Table |
Time in seconds |
Notes |
|
1 |
|
|
|
2 |
|
|
|
3 |
|
|
|
4 |
|
|
|
5 |
|
|
The notes should indicate whether the subject finds the numbers at an even pace or occasionally struggles for a long time to find a particular number.
When evaluating the results, the first thing that becomes apparent is the difference in the amount of time the subject spends locating the numbers on a single table. Mentally healthy young people spend between 30 and 50 seconds per table, most often 40–42 seconds.
Normally, approximately the same amount of time is spent on all the tables.
The method can be used for repeated trials. In this case, there is no need to change the tables – the same five tables can be used for the first, second, and, if necessary, third attempt.
The choice of method depends on the specific research objectives and the characteristics of the participants. Combining several methods can also provide a more complete picture of attention and its features.

Comments