
Lecture
Vector graphics is a form of computer graphics in which visual images are created directly from geometric shapes defined on a Cartesian plane, such as points, lines, curves, and polygons. Related mechanisms may include vector hardware for display and printing, vector data models and file formats, and software based on these data models (especially graphic design software, computer-aided design, and geographic information systems). Vector graphics is an alternative to raster or bitmap graphics, each of which has its own advantages and disadvantages in certain situations.
While vector hardware has largely disappeared in favor of raster monitors and printers, vector data and software continue to be widely used, especially when a high degree of geometric precision is required, and when complex information can be decomposed into simple geometric primitives. Thus, it is the preferred model for fields such as engineering design, architecture, surveying, 3D rendering, and typography, but is entirely unsuitable [citation needed] for applications such as photography and remote sensing, where raster is more efficient and productive. Some application areas, such as geographic information systems (GIS) and graphic design, sometimes use both vector and raster graphics, depending on the purpose.
Vector graphics is based on the mathematics of analytic or coordinate geometry and is not related to other mathematical uses of the term vector. This can lead to some confusion in disciplines that use both meanings.
The logical data model of vector graphics is based on the mathematics of coordinate geometry, in which shapes are defined as a set of points in a two- or three-dimensional Cartesian coordinate system, as p = ( x, y ) or p = ( x, y, z ). Since almost all shapes consist of an infinite number of points, the vector model defines a limited set of geometric primitives that can be specified using a finite sample of prominent points called vertices. For example, a square can be uniquely defined by the locations of three of its four corners, from which the software can interpolate the connecting boundary lines and the interior space. Since it is a regular shape, a square can also be defined by the location of one corner, a size (width=height), and a rotation angle.
The basic geometric primitives are:
Various more complex shapes may be supported:
In many vector datasets, each shape may be combined with a set of properties. The most common are visual characteristics such as color, line thickness, or dash pattern. In systems in which shapes represent real-world objects, such as GIS and BIM, various attributes of each represented feature can be stored, such as name, age, size, etc.
In some vector data, especially in GIS, information about topological relationships between objects can be represented in the data model, for example, tracking connections between road segments in a transportation network.
If a dataset stored in one vector file format is converted to another file format that supports all the primitive objects used in that particular image, the conversion can be performed without loss.
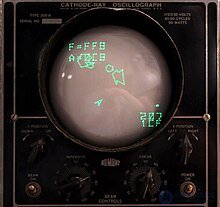
A free Asteroids-style video game that can be played on a vector monitor.
Vector devices, such as the vector CRT and the pen plotter, directly control the drawing mechanism to create geometric shapes. Because vector display devices can define a line by dealing with just two points (that is, the coordinates of each end of the line), the device can reduce the overall amount of data it has to handle by organizing the image as pairs of points.
Vector graphics displays were first used in 1958 by the US SAGE air defense system. Vector graphics systems were decommissioned in the US in 1999. [citation needed] Vector graphics was also used on the TX-2 at MIT's Lincoln Laboratory by computer graphics pioneer Ivan Sutherland to run his Sketchpad program in 1963.
Subsequent vector graphics systems, most of which iterated through dynamically modifiable stored lists of drawing instructions, included the IBM 2250, the Imlac PDS-1, and the DEC GT40. There was a game console that used vector graphics called Vectrex, as well as various arcade games, such as Asteroids, Space Wars, Tempest, and many Cinematronics titles, such as Rip Off and Tail Gunner, that used vector monitors. Storage tube displays, such as the Tektronix 4014, could display vector images but could not modify them without first erasing the display. However, they were never used as widely as the raster scanning displays used for television, and largely disappeared by the mid-1980s, except in specialized applications.
Plotters used in technical drawing still draw vectors directly on paper by moving a pen directionally across the two-dimensional space of the paper. However, as with monitors, they have largely been replaced by wide-format printers, which print a raster image (which can be derived from vector data).
Because this model is useful in various application domains, many different programs have been created for drawing, processing, and rendering vector graphics. Although they are all based on the same basic vector data model, they may interpret and structure shapes quite differently, using entirely different file formats.
Working with the CorelDRAW vector editor involves many tools and techniques for creating professional graphic work. Here is a brief guide to the main aspects:
Working with text in CorelDRAW involves two main types of text objects: Artistic Text and text blocks (Paragraph Text). Here is a detailed explanation of each:
1. Artistic Text
This type of text is used to create short captions, headings, and decorative text.
This type of text is used for long text, such as articles, paragraphs, or descriptions.
In CorelDRAW, text can be converted and various effects applied to it to achieve a unique design. After completing the work, it is important to properly prepare the materials for output (for example, printing or exporting). Here is how to do it:
Converting text to curves:
Separating text and its outline:
CorelDRAW offers many tools for creating effects with text:
For successful printing or export, it is important to properly prepare the file:
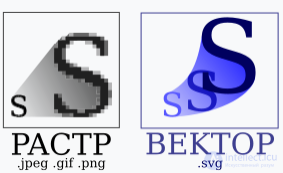
A raster image contains information about points, while a vector image contains information about shapes (form). This shows the key advantage of "vector" over "raster" in terms of scaling for illustrative purposes. A vector (SVG format) image demonstrates several unique features of vector graphics compared to raster graphics: along a rounded edge there is no spectrum overlap (which would lead to digital artifacts in raster graphics), all color gradients are smooth, and the user can resize the image infinitely without loss of quality.
Vector graphics today is typically found in the SVG, WMF, EPS, PDF, CDR, or AI graphic file formats and is inherently different from more common raster graphics file formats, such as JPEG, PNG, APNG, GIF, WebP, BMP, and MPEG4.
The World Wide Web Consortium (W3C) standard for vector graphics is Scalable Vector Graphics (SVG). The standard is complex and has been established relatively slowly, at least in part due to commercial interests. Many web browsers now have some support for rendering SVG data, but full implementations of the standard are still comparatively rare.
In recent years, SVG has become a significant format that is completely independent of the resolution of the rendering device, usually a printer or monitor. SVG files are essentially printed text describing both straight and curved paths, as well as other attributes. Wikipedia prefers SVG for images such as simple maps, line illustrations, coats of arms, and flags, which typically do not resemble photographs or other continuous-tone images. [citation needed] Rendering SVG requires conversion to a raster format at a resolution appropriate for the current task. SVG is also a format for animated graphics.
There is also a version of SVG for mobile phones. In particular, a special format for mobile phones is called SVGT (SVG Tiny version). These images can count references, as well as use anti-aliasing. They can also be displayed as wallpapers.
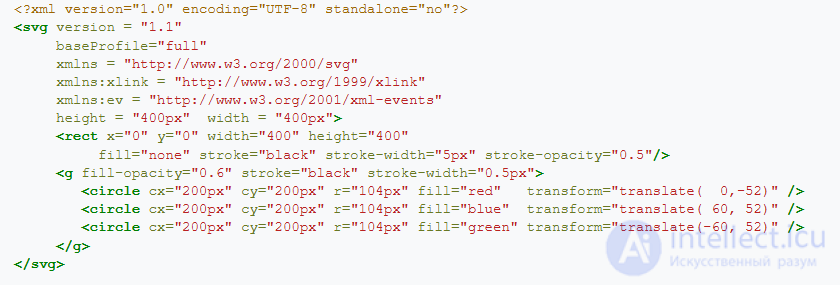
The first line is a standard XML header, an XML declaration, specifying the XML version (version) (usually "1.0") and the character encoding (encoding):
The second and third lines should contain the DOCTYPE header, defining the Document Type Definitions (DTD):
Unfortunately, in some cases, when using Mozilla Firefox with its built-in SVG viewer, the content of the DOCTYPE declaration can be a source of errors. There are recommendations not to use the DOCTYPE declaration in SVG version 1.0. Instead, it is recommended to include the baseProfile attribute in the root element with the value "full" .
If for some reason a DOCTYPE declaration is required in the document, it is recommended to use an empty declaration, as in the example.
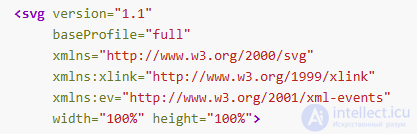
The fourth line contains the root element of the document, specifying the SVG namespace.
Next comes the rest of the document text, nested within the root element, where the elements describing the content of the encoded scene are actually located.
The document always ends with the closing of the root tag 
CAD software uses its own vector data formats, usually proprietary formats created by software vendors, such as DWG from Autodesk, and publicly available exchange formats, such as DXF. Throughout history, hundreds of different vector file formats have been created for GIS data, including proprietary formats such as the Esri file geodatabase, proprietary but publicly available formats such as Shapefile and the original KML, open-source formats such as GeoJSON, and formats created by standards bodies such as Simple Features and GML from the Open Geospatial Consortium.

Original photo before vectorization

Details can be added to or removed from vector graphics.
Modern displays and printers are raster devices; vector formats must be converted to raster format (bitmaps – arrays of pixels) before they can be rendered (displayed or printed). The size of the bitmap/raster format file generated by the conversion will depend on the required resolution, but the size of the vector file that generates the bitmap/raster file will always remain the same. Thus, it is easy to convert a vector file into a range of bitmap/raster file formats, but much more difficult to go in the reverse direction, especially if subsequent editing of the vector image is required. It can be advantageous to save an image created from a vector source file in bitmap/raster format, since different systems have different (and incompatible) vector formats, and some may not support vector graphics at all. However, once a file is converted from a vector format, it is likely to become larger and lose the advantage of scalability without loss of resolution. It will also no longer be possible to edit individual parts of the image as discrete objects. The file size of a vector graphic image depends on the number of graphic elements it contains; it is a list of descriptions.
Vector graphics is ideal for printing because it consists of a series of mathematical curves; it will print very sharply even when resized. For example, you can print a vector logo on a small sheet of copy paper and then enlarge the same vector logo to billboard size while retaining the same crisp quality. Low-resolution raster graphics will become excessively blurry or pixelated if enlarged from business-card size to billboard size. (The exact raster resolution required for high-quality results depends on the viewing distance; for example, a billboard may still look high-quality even at low resolution if the viewing distance is great enough.)
If we consider typographic characters as images, then the same considerations we made for graphics apply even to the composition of written text for printing (typesetting). Older character sets were stored as raster images. Therefore, to achieve maximum print quality, they had to be used only at a set resolution; these font formats are considered non-scalable. High-quality typography today is based on character drawings (fonts) that are typically stored as vector graphics and, as such, scale to any size. Examples of these vector formats for characters are Postscript fonts and TrueType fonts.
The advantages of this drawing style over raster graphics:
For example, consider a circle of radius r. The basic data a program needs to draw this circle are as follows:
Vector formats are not always suitable for graphic work and also have numerous drawbacks. For example, devices such as cameras and scanners produce essentially continuous-tone raster graphics, which it is impractical to convert into vectors, and so for this type of work an image editor will work with pixels rather than with drawing objects defined by mathematical expressions. Complex graphic tools will combine images from vector and raster sources and may provide editing tools for both, since some parts of an image may come from a camera source while others may be drawn using vector tools.
Some authors have criticized the term vector graphics as confusing. In particular, vector graphics does not simply refer to graphics described by Euclidean vectors. Some authors have proposed using the term object-oriented graphics instead. However, this term can also be confusing, since it can be interpreted as any kind of graphics implemented using object-oriented programming.
Vector graphics editors typically allow moving, rotating, mirroring, stretching, skewing, affine transformations, changing z-order (roughly, what is in front of what), and combining primitives into more complex objects. More complex transformations include set operations on closed shapes (union, difference, intersection, etc.). In SVG, compositing operations are based on alpha compositing.
Vector graphics is ideal for simple or composite drawings that need to be device-independent, or that do not need to achieve photorealism. For example, the PostScript and PDF page description languages use the vector graphics model.
Many stock photo sites offer vector versions of the images they host, while certain repositories specialize in vector images, given their growing popularity among graphic designers.
| List of Vector Image Repositories | |
|---|---|
| Repository/Company | License |
| Vecteezy | paid |
| VectorStock | paid |
| Vectezy | Freemium |
| Freepik | paid |
| Envato Elements | paid |
| Depositphotos | paid |




Comments