
Lecture
In computer graphics and digital photography, raster graphics represents a two-dimensional image as a rectangular matrix or grid of pixels, viewable on a computer display, paper, or other medium. A raster image is technically characterized by its width and height in pixels and by the number of bits per pixel. Raster images are stored in image files with various formats of distribution, production, generation, and acquisition.
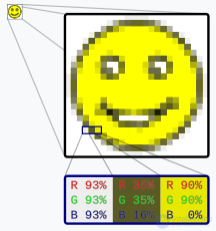
The smiley face in the upper left corner is a raster image. When enlarged, individual pixels look like squares. Upon further enlargement, each pixel can be analyzed, and its color can be constructed by combining values of red, green, and blue
In printing and prepress, raster graphics are known as contones (from continuous tones). By contrast, line art is usually implemented as vector graphics in digital systems.
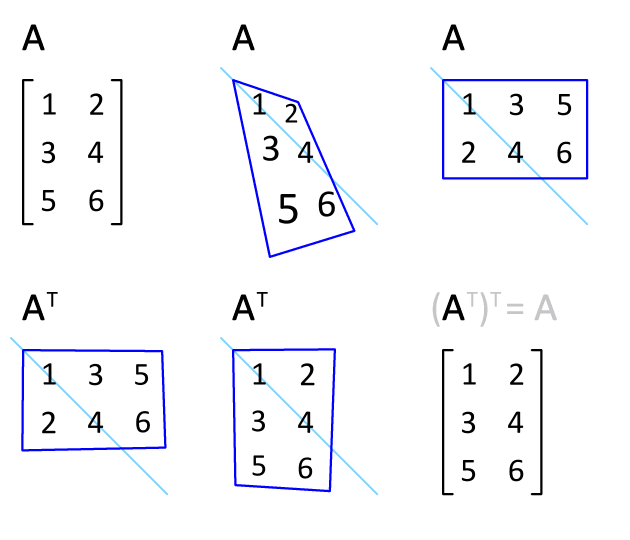
Transposing an image into a hidden raster organization (a relatively costly operation for packed formats with less than one byte per pixel); composing an additional mirroring of the raster row (almost free), either before or after, is equivalent to rotating the image by 90° in one direction or the other.
Many raster manipulations correspond directly to the mathematical formalisms of linear algebra, where mathematical objects with a matrix structure play a central role.
The word "raster" comes from the Latin rastrum (rake), which derives from radere (to scrape). It originates from the raster scanning of cathode-ray tube (CRT) video monitors, which draw an image line by line by steering a focused electron beam magnetically or electrostatically. By association, it can also refer to a rectangular grid of pixels. The word rastrum is now used to denote a device for drawing staff lines in music notation.
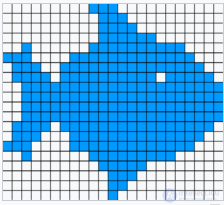
Simple raster graphics
The fundamental strategy underlying the raster data model is the tessellation of the plane into a two-dimensional array of squares, each called a cell or pixel (from "picture element"). In digital photography, the plane is the field of view projected onto an image sensor; in computer art, the plane is a virtual canvas; in geographic information systems, the plane is a projection of the Earth's surface. The size of each square pixel, known as the resolution or support, is constant across the entire grid. Raster or grid data may be the result of a gridding procedure.
A single numeric value is then stored for each pixel. For most images this value is the visible color, but other measurements are possible, even numeric codes for qualitative categories. Each raster grid has a defined pixel format, a data type for each number. Common pixel formats are binary, grayscale, palette-based, and full-color, where color depth determines the precision of the represented colors, and color space determines the range of color coverage (which is often less than the full range of human color vision). Most modern color raster formats represent color using 24 bits (more than 16 million distinct colors), with 8 bits (values 0–255) for each color channel (red, green, and blue). Digital sensors used for remote sensing and astronomy are often capable of detecting and storing wavelengths beyond the visible spectrum; the large raster CCD sensor at the Vera C. Rubin Observatory captures 3.2 gigapixels in a single image (6.4 GB raw) across six color channels, exceeding the spectral range of human color vision.

Using a raster to summarize a point pattern
Most computer images are stored in raster graphics formats or compressed variants, including GIF, JPEG, and PNG, which are popular on the World Wide Web. The structure of raster data is based on a (usually rectangular, square) tessellation of the 2D plane into cells, each containing a single value. To store the data in a file, the two-dimensional array must be serialized. The most common way to do this is a row-major format, in which cells along the first (usually top) row are listed from left to right, immediately followed by the cells of the second row, and so on.
In the example on the right, the tessellation cells A are overlaid on the point pattern B, resulting in an array C of quadrant counts representing the number of points in each cell. A lookup table was used to color each of the cells for visualization in image D. Here are the numbers as a sequential row-by-row array:
1 3 0 0 1 12 8 0 1 4 3 3 0 2 0 2 1 7 4 1 5 4 2 2 0 3 1 2 2 2 2 3 0 5 1 9 3 3 3 4 5 0 8 0 2 4 3 2 8 4 3 2 2 7 2 3 2 10 1 5 2 1 3 7
To reconstruct the two-dimensional grid, the file must include a header section at the beginning that contains at least the number of columns and the pixel data type (specifically the number of bits or bytes per value), so that the reader knows where each value ends in order to begin reading the next one. Headers may also include the number of rows, georeferencing parameters for geographic data, or other metadata tags, such as those specified in the Exif standard.
High-resolution raster grids contain a large number of pixels and thus consume a large amount of memory. This has led to the emergence of several approaches for compressing the volume of data into smaller files. The most common strategy is to search for patterns or trends in pixel values and then store a parameterized form of the pattern instead of the original data. Common raster compression algorithms include run-length encoding (RLE), JPEG, LZ (the basis for PNG and ZIP), Lempel–Ziv–Welch (LZW) (the basis for GIF), and others.
For example, run-length encoding looks for repeating values in the array and replaces them with the value and the count of its occurrences. Thus the raster above would be represented as:
| values | 1 | 3 | 0 | 1 | 12 | 8 | 0 | 1 | 4 | 3 | ... |
|---|---|---|---|---|---|---|---|---|---|---|---|
| lengths | 1 | 1 | 2 | 1 | 1 | 1 | 1 | 1 | 1 | 2 | ... |
This method is very effective when there are large areas with identical values, such as a line drawing, but for a photograph, where pixels usually differ slightly from their neighbors, an RLE file will be twice as large as the original.
Some compression algorithms, such as RLE and LZW, work losslessly, where the original pixel values can be perfectly reconstructed from the compressed data. Other algorithms, such as JPEG, are lossy, since the parameterized patterns are only an approximation of the original pixel values, so the latter can only be estimated from the compressed data.
Vector images (lines) can be rasterized (converted into pixels), and raster images can be vectorized (raster images converted into vector graphics) using software. In both cases some information is lost, although some vectorization operations can recreate essential information, as in the case of optical character recognition.
Early mechanical televisions, developed in the 1920s, used raster principles. Electronic television based on cathode-ray tube displays has a raster scan with horizontal raster lines drawn from left to right, and raster lines drawn from top to bottom.
Modern flat-panel displays, such as LED monitors, still use the raster approach. Each pixel on the screen directly corresponds to a small number of bits in memory. The screen is refreshed simply by scanning the pixels and coloring them according to each set of bits. The refresh procedure, being speed-critical, is often implemented by dedicated circuitry, frequently as part of a graphics processing unit.
Using this approach, the computer contains a memory area that holds all the data to be displayed. The central processing unit writes data to this memory area, and the video controller reads it from there. The bits of data stored in this memory block are linked to the final pattern of pixels that will be used to build the image on the display.
The first scanning raster computer graphics display was invented in the late 1960s by A. Michael Noll at Bell Labs, but his patent application, filed on February 5, 1970, was rejected by the Supreme Court in 1977 due to the question of the patentability of computer software.
In the 1970s and 1980s, pen plotters, using vector graphics, were common for creating precise drawings, especially on large-format paper. Since then, however, almost all printers produce a printed image as a raster grid, including both laser and inkjet printers. When the source information is vector-based, rendering specifications and software, such as PostScript, are used to create the raster image.
Three-dimensional voxel raster graphics are used in video games, as well as in medical imaging, for example in MRI scanners.
Geographic phenomena are typically represented in raster format in GIS. A raster grid is georeferenced, so that each pixel (usually called a cell in GIS, since the part of "pixel" denoting "picture" is meaningless) represents a square area of geographic space. The value of each cell then represents some measurable (qualitative or quantitative) property of that area, usually conceptualized as a field. Examples of fields commonly represented in rasters include: temperature, population density, soil moisture, land cover, surface elevation, etc. Two sampling models are used to derive cell values from a field: in a lattice, the value is measured at the central point of each cell; in a grid, the value is a summary (usually the mean or mode) of the value across the entire cell.
Raster graphics is resolution-dependent, meaning it cannot be scaled to an arbitrary resolution without loss of apparent quality. This property contrasts with the capabilities of vector graphics, which scales easily to the quality of the device displaying it. Raster graphics handles photographs and photorealistic images more practically than vector graphics, while vector graphics is often better suited for typesetting or graphic design. Modern computer monitors typically display about 72–130 pixels per inch (PPI), and some modern consumer printers can resolve 2400 dots per inch (DPI) or more; determining the most appropriate image resolution for a given printer resolution can be difficult, since the printed output may have a higher level of detail than a viewer can distinguish on a monitor. Generally, a resolution of 150 to 300 PPI is well suited for printing using the 4-color process (CMYK).
However, for printing technologies that perform color mixing through dithering (halftoning) rather than through overlay (practically all home/office inkjet and laser printers), printer DPI and image PPI have a completely different meaning, and this can be misleading. Since in the dithering process the printer creates one image pixel from several printer dots to increase color depth, the printer's DPI setting must be set much higher than the desired PPI to ensure sufficient color depth without compromising image resolution. Thus, for example, printing an image at 250 PPI may actually require a printer setting of 1200 DPI.
Raster image editors, such as PaintShop Pro, Corel Painter, Adobe Photoshop, Paint.NET, Microsoft Paint, Krita, and GIMP, revolve around editing pixels, as opposed to vector image editors, such as Xfig, CorelDRAW, Adobe Illustrator, or Inkscape, which revolve around editing lines and shapes (vectors). When an image is rendered in a raster image editor, it consists of millions of pixels. At its core, a raster image editor works by manipulating each individual pixel. Most pixel-based image editors work using the RGB color model, but some also allow the use of other color models, such as the CMYK color model.
A raster image consists of pixels — small colored dots, each with a specific color and location. Software tools for processing raster images allow such images to be edited by changing their appearance, adding effects, adjusting colors, and performing many other operations.
Popular programs for processing raster images:
Layers are a key concept in image processing, allowing you to work with different elements of an image independently of each other.
Channels contain information about the color and transparency of an image.
Adobe Photoshop — a professional tool for image processing with a wide range of functions.
Creating or opening an image.
Working with layers.
Using tools.
Color correction.
Working with channels.
Saving.
Layers in Photoshop allow you to work with images on separate levels, making processing more flexible and convenient. Interaction between layers opens up wide possibilities for creating complex compositions and effects.
Layer blending modes:
These modes determine how one layer interacts with those below it.
Opacity and fill:
Grouped layers:
Merging layers:
Linking layers:
Adjustment layers:
Correction allows you to improve an image by changing its color, brightness, contrast, and other parameters.
Adjustment layers:
Adjustments panel:
Manual correction:
Filters:
Masks allow you to hide or partially display layer elements without deleting them. This is one of the most powerful tools for precise editing.
Layer Mask:
Vector Mask:
Clipping Mask:
Masks and layer interaction provide enormous scope for creativity, allowing you to create complex and professional-looking compositions.
Shape cropping is the process of cutting out an image within a specified shape, such as a circle, star, text, or arbitrary outline. This technique is used to create interesting compositions, collages, or graphic designs.
Create a shape:
Apply the mask:
Shape cropping makes images more expressive and helps bring creative ideas to life in graphic design.
Plugins extend the capabilities of raster editors, such as Adobe Photoshop and GIMP, by adding new tools, effects, and functions. They save time and allow you to achieve professional results.
Nik Collection (by DxO)
Topaz Labs Plugins
Alien Skin Exposure X
Portraiture (by Imagenomic)
Beauty Box (by Digital Anarchy)
G'MIC (GREYC’s Magic for Image Computing)
Resynthesizer
Liquid Rescale
Digital Film Tools
ON1 Effects
Magic Bullet Looks (by Red Giant)
Plugins significantly extend the functionality of editors and simplify the completion of complex tasks

Comments