
Lecture
2D computer graphics is the computer generation of digital images — mainly from two-dimensional models (such as 2D geometric models, text, and digital images) and by techniques specific to them. This may refer to the branch of computer science that encompasses such techniques, or to the models themselves.

Raster graphics sprites (left) and masks
Two-dimensional computer graphics is mainly used in applications that were originally developed with traditional printing and drawing technologies, such as typography, cartography, technical drawing, advertising, and so on. In these applications, the two-dimensional image is not merely a representation of a real object but an independent artifact with added semantic value; therefore two-dimensional models are preferred, since they give more direct control over the image than three-dimensional computer graphics (whose approach is closer to photography than to typography).
In many fields, such as desktop publishing, engineering, and business, a document description based on 2D computer graphics techniques can be much smaller than the corresponding digital image — often by a factor of 1/1000 or more. Such a representation is also more flexible, since it can be rendered at different resolutions to suit different output devices. For these reasons, documents and illustrations are often stored or transmitted as 2D graphics files.
2D computer graphics emerged in the 1950s based on vector graphics devices. In subsequent decades these were largely superseded by raster devices. The PostScript language and the X Window System protocol became landmark developments in this field.
2D graphics models can combine geometric models (also called vector graphics), digital images (also called raster graphics), text for typesetting (defined by content, font style and size, color, position, and orientation), mathematical functions and equations, and much more. These components can be modified and manipulated through two-dimensional geometric transformations such as translation, rotation, and scaling. In object-oriented graphics, the image is indirectly described by an object endowed with a self-rendering method — a procedure that assigns colors to the image's pixels by means of an arbitrary algorithm. Complex models can be built by combining simpler objects, in the paradigms of object-oriented programming.

Under a translation, every point of a figure or space is moved by the same amount in a given direction.
In Euclidean geometry, a translation (geometry) moves every point a constant distance in a specified direction. A translation can be described as a rigid motion: other rigid motions include rotations and reflections. A translation can also be interpreted as the addition of a constant vector to every point, or as a shift of the origin of the coordinate system. The translation operator is the operator Tδ 
If v is a fixed vector, then the translation T v will act as T v ( p ) = p + v .
If T is a translation, then the image of a subset A under the function T is the translate of A by T. The translate of A by T v is often written as A + v .
In Euclidean space, any translation is an isometry. The set of all translations forms a translation group T , which is isomorphic to the space itself, and is a normal subgroup of the Euclidean group E ( n ). The quotient group E ( n ) by T is isomorphic to the orthogonal group O ( n ):
E ( n ) / T ≅ O ( n ).
Since translation is an affine transformation, but not a linear one, homogeneous coordinates are normally used to represent the translation operator with a matrix, and thereby give it linearity. Thus we write the 3-dimensional vector w = ( w x , w y , w z ) using 4 homogeneous coordinates as w = ( w x , w y , w z , 1).
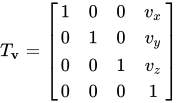
To translate an object by a vector v , each homogeneous vector p (written in homogeneous coordinates) must be multiplied by this translation matrix:
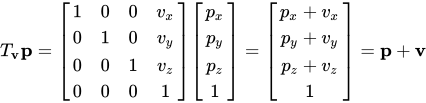
As shown below, the multiplication will give the expected result:
The inverse of a translation matrix can be obtained by reversing the direction of the vector:

Similarly, the product of translation matrices is obtained by adding the vectors:

Because vector addition is commutative, multiplication of translation matrices is also commutative (unlike multiplication of arbitrary matrices).
In linear algebra, a rotation matrix is a matrix that is used to perform a rotation in Euclidean space.
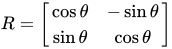
rotates points in the Cartesian xy-plane counterclockwise through an angle θ about the origin of the Cartesian coordinate system. To perform the rotation using a rotation matrix R, the position of each point must be represented by a column vector v containing the coordinates of the point. The rotated vector is obtained by the matrix multiplication R v . Since matrix multiplication has no effect on the zero vector (i.e., on the coordinates of the origin), rotation matrices can only be used to describe rotations about the origin of the coordinate system.
Rotation matrices provide a simple algebraic description of such rotations and are widely used for computations in geometry, physics, and computer graphics. In 2-dimensional space, a rotation can simply be described by an angle θ of rotation, but it can also be represented by the 4 entries of a rotation matrix with 2 rows and 2 columns. In 3-dimensional space, every rotation can be interpreted as a rotation by a given angle about a single fixed axis of rotation (see Euler's rotation theorem), and hence it can simply be described by an angle and a vector with 3 entries. However, it can also be represented by the 9 entries of a rotation matrix with 3 rows and 3 columns. The notion of rotation is not commonly used in dimensions higher than 3; there is instead the notion of a rotational displacement, which can be represented by a matrix but has no single associated axis or angle.
Rotation matrices are square matrices with real entries. More specifically, they can be characterized as orthogonal matrices with determinant 1:
 .
.
The set of all such matrices of size n forms a group known as the special orthogonal group SO( n ) .
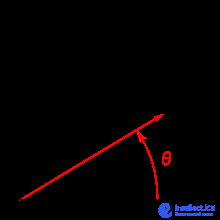
Rotation of a vector counterclockwise through an angle θ . The vector is initially aligned with the x-axis.
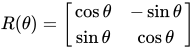
In two dimensions, every rotation matrix has the following form:
 .
.
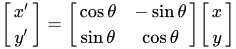
This rotates column vectors by means of the following matrix multiplication:
 .
.
So the coordinates (x',y') of the point (x,y) after rotation are:
 ,
,
 .
.
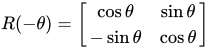
The direction of rotation of the vector is counterclockwise if θ is positive (for example, 90°), and clockwise if θ is negative (for example, -90°).
 .
.
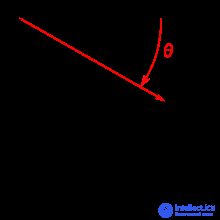
Rotation through an angle θ with non-standard axes
If a standard right-handed Cartesian coordinate system is used, with the x-axis to the right and the y-axis up, the rotation R( θ ) is counterclockwise. If a left-handed Cartesian coordinate system is used, with the x-axis pointing to the right and the y-axis down, then R( θ ) is clockwise. Such non-standard orientations are rarely used in mathematics, but are common in 2D computer graphics, which often has its origin in the upper-left corner with the y-axis pointing down the screen or page.
Below are some other alternative conventions that can change the direction of rotation produced by a rotation matrix.
Rotation matrices for 90° and 180° are especially useful:
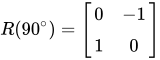 (90° counterclockwise rotation)
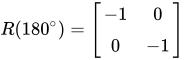 (180° rotation in either direction – a half-turn)
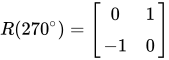 (270° counterclockwise rotation, the same as a 90° clockwise rotation)
More general is scaling with a separate scale factor for each axis direction. Non-uniform scaling (anisotropic scaling, non-homogeneous dilation) occurs when at least one of the scale factors differs from the others; a special case is directional scaling, or stretching (in a single direction). Non-uniform scaling changes the shape of an object; for example, a square may turn into a rectangle or into a parallelogram if the sides of the square are not parallel to the scaling axes (angles between lines parallel to the axes are preserved, but not all angles).
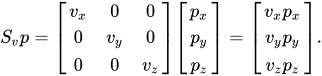
Scaling can be represented by a scaling matrix. To scale an object by a vector v = ( v x , v y , v z ), each point p = ( p x , p y , p z ) must be multiplied by this scaling matrix:
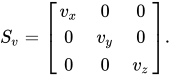
As shown below, the multiplication will give the expected result:
.
Such scaling changes the diameter of an object by a factor intermediate between the scale factors, the area by a factor intermediate between the smallest and largest product of two scale factors, and the volume by the product of all three.
Scaling is uniform if and only if the scale factors are equal ( v x = v y = v z ). If all but one of the scale factors are equal to 1, we have directional scaling.
In the case where v x = v y = v z = k , the scaling is also called an enlargement or dilation by a factor of k , increasing the area by a factor of k 2 and the volume by a factor of k 3 .
Scaling in the most general sense is any affine transformation with a diagonalizable matrix. This includes the case where the three scaling directions are not perpendicular. It also includes the case where one or more of the scale factors is zero (projection), and the case of one or more negative scale factors. The latter corresponds to a combination of proper scaling and a kind of reflection: along lines in a given direction we take the reflection at the point of intersection with a plane, which need not be perpendicular; hence it is more general than an ordinary reflection in a plane.
In projective geometry, often used in computer graphics, points are represented using homogeneous coordinates. To scale an object by a vector v = ( v x , v y , v z ), each homogeneous coordinate vector p = ( p x , p y , p z , 1) must be multiplied by this projective transformation matrix:
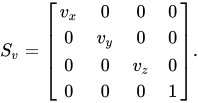
As shown below, the multiplication will give the expected result:
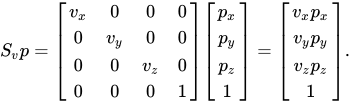
Since the last component of the homogeneous coordinate can be regarded as the denominator of the other three components, uniform scaling by a common factor s (uniform scaling) can be performed using the following scaling matrix:
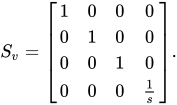
For every vector p = ( p x , p y , p z , 1) we will have
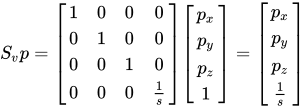
which will be homogenized to
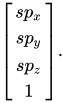
A convenient way to create a complex image is to start with a blank raster "canvas" (a pixel array, also known as a bitmap) filled with some uniform background color, and then "draw," "paint," or "paste" simple colored patches onto it in an appropriate order. In particular, the canvas may be a frame buffer for a computer display.
Some programs set pixel colors directly, but most rely on some 2D graphics library or the computer's graphics card, which usually implement the following operations:
Text, shapes, and lines are rendered using a color specified by the client. Many libraries and cards provide color gradients, which are convenient for creating smoothly varying backgrounds, shading effects, and so on (see also Gouraud shading). Pixel colors can also be taken from a texture, such as a digital image (thus emulating rubbed-on screentones and the legendary "Ben-Day dot" coloring that used to be available only in cartoons).
Coloring a pixel with a given color usually replaces its previous color. However, many systems support drawing with transparent and semi-transparent colors, which only modify the previous pixel values. Two colors can also be combined in more complex ways, for example by computing their bitwise exclusive or. This method is known as color inversion or color inverting and is often used in graphical user interfaces for highlighting, rubber-band drawing, and other transient painting, since redrawing the same shapes with the same color will restore the original pixel values.

A two-dimensional animated character composited over a three-dimensional background using layers.
Models used in 2D computer graphics generally do not provide for three-dimensional shapes or three-dimensional optical phenomena such as lighting, shadows, reflection, refraction, and so on. However, they can usually model several layers (conceptually of ink, paper, or film; opaque, semi-transparent, or transparent) stacked in a certain order. The order is usually defined by a single number (the layer's depth, or distance from the viewer).
Layered models are sometimes called "2 1 ⁄ 2 -D computer graphics." They allow traditional film- and paper-based drawing and printing techniques, such as cutting and pasting, to be emulated, and allow the user to edit any layer without affecting the others. For these reasons they are used in most graphics editors. Layered models also allow improved spatial anti-aliasing of complex drawings and provide a reliable model for certain techniques, such as miter joins and the even-odd rule.
Multi-layer models are also used to allow the user to hide unwanted information when viewing or printing a document, for example roads or railways on a map, certain process layers on an integrated circuit diagram, or handwritten notes on a business letter.
In a layer-based model, the target image is created by "drawing" or "pasting" each layer onto a virtual canvas in order of decreasing depth. Conceptually, each layer is first rendered on its own, producing a digital image at the desired resolution, which is then rendered onto the canvas, pixel by pixel. Fully transparent parts of a layer, of course, do not need to be rendered. Rendering and painting can be performed in parallel, i.e., each pixel of a layer can be drawn onto the canvas as soon as it is produced by the rendering procedure.
Layers consisting of complex geometric objects (such as text or polylines) can be broken down into simpler elements (characters or line segments, respectively), which are then drawn as separate layers in some order. However, this approach can create unwanted aliasing artifacts wherever two elements overlap the same pixel.
Portable Document Format#Layers .
Modern computer graphics cards overwhelmingly use raster techniques, dividing the screen into a rectangular grid of pixels, owing to the relatively low cost of raster video hardware compared to vector graphics hardware. Most graphics hardware has built-in support for blitting or sprite-drawing operations. A coprocessor dedicated to blitting is known as a blitter chip.
Classic 2D graphics chips and graphics processors of the late 1970s through the 1980s, used in 8-bit and early 16-bit arcade games, game consoles, and home computers, include:
Many graphical user interfaces (GUIs), including macOS, Microsoft Windows, or the X Window System, are primarily based on 2D graphics concepts. Such software provides a visual environment for interacting with the computer and usually includes some form of window manager to help the user conceptually distinguish between different applications. The user interface within individual software applications is also usually 2D in nature, partly because most common input devices, such as the mouse, are constrained to two dimensions of movement.
2D graphics is very important in peripheral control devices, such as printers, plotters, cutting machines, and so on. It was also used in most early video games and is still used in card and board games, such as solitaire, chess, mahjong, and so on.
2D graphics editors, or drawing programs, are application-level software for creating images, diagrams, and illustrations through direct manipulation (using a mouse, graphics tablet, or similar device) of 2D computer graphics primitives. These editors typically provide geometric primitives as well as digital images; and some even support procedural models. An illustration is usually represented internally as a multi-layer model, often with a hierarchical structure, to make editing more convenient. These editors typically output graphics files in which layers and primitives are separately preserved in their original form. MacDraw, introduced in 1984 with the Macintosh line of computers, was an early example of this class; recent examples are the commercial products Adobe Illustrator and CorelDRAW, as well as free editors such as xfig or Inkscape. There are also many 2D graphics editors specialized for particular kinds of drawings, such as electrical, electronic, and VLSI circuit diagrams, topographic maps, computer fonts, and so on.
Image editors specialize in processing digital images, mainly through freehand drawing/painting and signal processing operations. They typically use a direct-painting paradigm, in which the user controls virtual pens, brushes, and other artistic tools to apply paint to a virtual canvas. Some image editors support a multi-layer model; however, to support signal processing operations such as blurring, each layer is typically represented as a digital image. Therefore, any geometric primitives provided by the editor are immediately converted to pixels and drawn onto the canvas. The name raster graphics editor is sometimes used to contrast this approach with that of general editors, which also handle vector graphics. One of the first popular image editors was MacPaint from Apple, a companion to MacDraw. Modern examples are the free editor GIMP and the commercial products Photoshop and Paint Shop Pro. This class also includes many specialized editors — for medicine, remote sensing, digital photography, and so on.
With the resurgence of 2D animation, free and proprietary software packages have become widely available to hobbyist and professional animators alike. With software such as RETAS UbiArt Framework and Adobe After Effects, coloring and compositing can be done in less time.
Various approaches have been developed to make the process of digital 2D animation easier and faster. For example, by creating vector illustrations in a tool such as Adobe Flash, an artist can use program-driven automatic coloring and tweening effects.
Programs such as Blender or Adobe Substance allow the user to create 3D animation, 2D animation, or combine them within their software, enabling experimentation with different forms of animation.

Comments