
Lecture
Modern graphics processors, or GPUs (Graphics Processing Units), are the core component for building images in computer graphics. They provide the high performance needed to process enormous volumes of data and allow the creation of visual effects that once seemed impossible. In this article we will look at how GPUs work, what stages the image-building process includes, and why using them efficiently matters so much.
GPUs specialize in performing parallel computations, which makes them ideal for processing graphics. Unlike the central processing unit (CPU), which executes tasks sequentially, a GPU can process thousands or even millions of tasks simultaneously. This is especially important for building images, where each pixel or vertex can be processed independently.
The main tasks of a GPU are:
Geometry processing: converting 3D objects into two-dimensional images.
Lighting: calculating the interaction of light with surfaces to create realistic illumination.
Texturing: applying textures to 3D objects.
Rasterization: converting geometric data into pixels on the screen.
Post-processing: applying effects such as blur, color correction, and others.
Every member of the team is responsible for the game's speed, regardless of their role. We, the 3D programmers, have wide-ranging ways to control GPU performance: we can optimize shaders, sacrifice image quality for speed, use trickier rendering techniques… However, there is one aspect we cannot fully control, and that is the game's graphics assets.
We hope that artists will create assets that not only look good but are also efficient to render. If artists learn a bit more about what happens inside the GPU, it can have a major effect on the game's frame rate. If you're an artist and want to understand why aspects like draw calls, levels of detail (LOD), and MIP textures matter for performance, read this article. To account for the impact your graphics assets have on game performance, you need to know how a polygon mesh gets from the 3D editor onto the game screen. That means you need to understand how the GPU works — the chip that drives the graphics card and is responsible for real-time 3D rendering. Armed with this knowledge, we'll look at the most common performance problems, break down why they're a problem, and explain how to deal with them.
Before we begin, I'd like to stress that I will deliberately simplify a lot for the sake of brevity and clarity. In many cases I'm generalizing, describing only the most typical cases, or simply leaving out some concepts. In particular, for simplicity's sake, the idealized version of a GPU described in the article most closely resembles the previous generation (the DX9 era). However, when it comes to performance, all the reasoning presented below applies quite well to modern PC and console hardware (though perhaps not to all mobile GPUs). If you understand everything written in the article, it will be much easier for you to handle the variations and complexities you'll encounter later if you want to dig deeper.
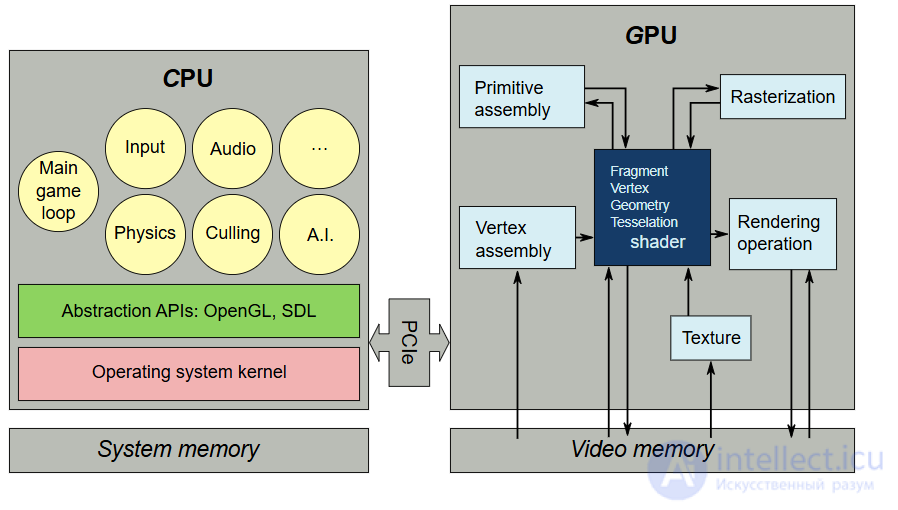
Illustration of the division of tasks between the CPU and GPU.
The process by which GPUs build an image can be divided into several stages:
Model Stage At this stage, data about three-dimensional objects is prepared and passed to the GPU. Objects are described using vertices and polygons, as well as textures and materials.
Vertex Processing The GPU converts vertex coordinates from local coordinate space into screen space. Effects such as animation or object deformation may also be applied here.
Rasterization This stage converts triangles and other primitives into pixels. Each pixel receives information about color, texture, and lighting.
Fragment Processing At this stage, the color of each pixel is calculated taking into account textures, materials, light sources, and other effects. Anti-aliasing may also be applied to smooth object edges.
Post-Processing The final stage includes applying effects such as motion blur, depth of field, HDR (high dynamic range), and other visual enhancements.
To display a polygon mesh on screen, it has to pass through the GPU for processing and rendering. Conceptually this path is very simple: the mesh is loaded, vertices are grouped into triangles, triangles are converted into pixels, each pixel is given a color, and the final image is ready. Let's take a closer look at what happens at each stage.
After a mesh is exported from a 3D editor (Maya, Max, etc.), the geometry is usually loaded into the game engine in two parts: a Vertex Buffer (VB) containing the list of the mesh's vertices along with their associated properties (position, UV coordinates, normal, color, etc.), and an Index Buffer (IB), which lists the vertices from the VB connected into triangles.
Along with these geometry buffers, the mesh is also assigned a material, which defines its appearance and behavior under various lighting conditions. For the GPU, this material takes the form of specially written shaders — programs that determine how vertices are processed and what color the final pixels are. When choosing a material for a mesh, you need to configure various material parameters (for example, the base color value or the choice of texture for various maps: albedo, roughness, normal maps, etc.). All of these are passed to the shader programs as input data.
The mesh and material data are processed through various stages of the GPU pipeline to produce the pixels of the final render target (the image the GPU writes to). This render target can then be used as a texture in subsequent shaders and/or displayed on screen as the final frame image.
For the purposes of this article, the important parts of the GPU pipeline, from top to bottom, are the following:
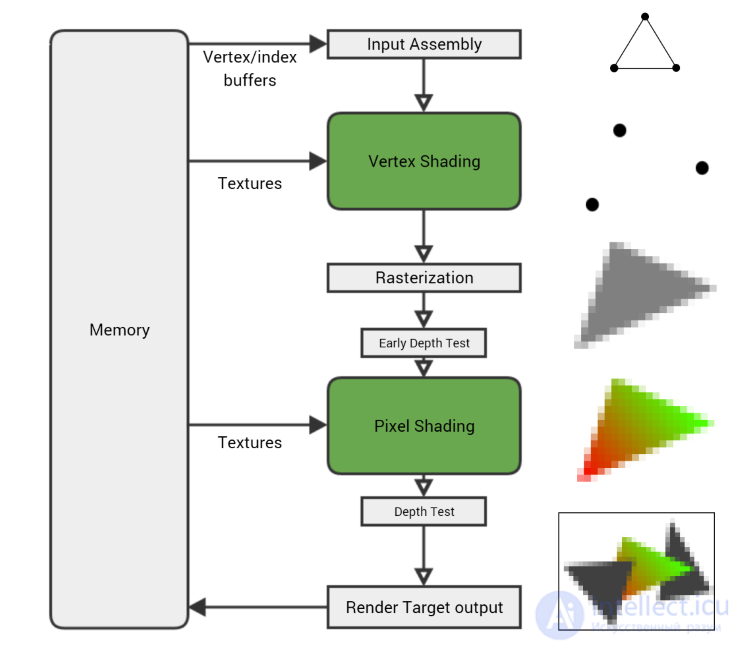
Many more actions are performed than this, but that's the basic process: for each vertex in the mesh the vertex shader runs, each three-vertex triangle is rasterized into pixels, for each rasterized pixel the pixel shader runs, and then the resulting colors are written to the render target.
Shader programs, which define a material's appearance, are written in a shader programming language, for example HLSL. These shaders run on the GPU in much the same way ordinary programs run on the CPU — they receive data, execute a set of simple instructions to modify the data, and output a result. But while CPU programs can work with any type of data, shader programs are specifically designed to work with vertices and pixels. These programs are written to give a rendered object the appearance of the desired material — plastic, metal, velvet, leather, and so on.
Let me give a concrete example: here is a simple pixel shader that performs Lambertian lighting calculations (i.e., simple diffuse only, no reflections) for material color and texture. This is one of the simplest possible shaders, but you don't need to understand it — it's enough to see what shaders look like in general.
float3 MaterialColor;
Texture2D MaterialTexture;
SamplerState TexSampler;

float3 LightDirection;
float3 LightColor;

float4 MyPixelShader( float2 vUV : TEXCOORD0, float3 vNorm : NORMAL0 ) : SV_Target
{
   float3 vertexNormal = normalize(vNorm);
   float3 lighting = LightColor * dot( vertexNormal, LightDirection );
   float3 material = MaterialColor * MaterialTexture.Sample( TexSampler, vUV ).rgb;

   float3 color = material * lighting;
   float alpha = 1; return float4(color, alpha);
}
A simple pixel shader that performs a basic lighting calculation. Inputs such as MaterialTexture and LightColor are passed in by the CPU, while vUV and vNorm are vertex properties interpolated across the triangle during rasterization.
Here are the generated shader instructions:
dp3 r0.x, v1.xyzx, v1.xyzx
rsq r0.x, r0.x
mul r0.xyz, r0.xxxx, v1.xyzx
dp3 r0.x, r0.xyzx, cb0 .xyzx
mul r0.xyz, r0.xxxx, cb0 .xyzx
sample_indexable(texture2d)(float,float,float,float) r1.xyz, v0.xyxx, t0.xyzw, s0
mul r1.xyz, r1.xyzx, cb0 .xyzx
mul o0.xyz, r0.xyzx, r1.xyzx
mov o0.w, l(1.000000)
ret
The shader compiler takes the program shown above and generates instructions like these, which execute on the GPU. The longer the program, the more instructions there are, meaning more work for the GPU.
By the way, notice how isolated the shader stages are — each shader works on a single vertex or pixel and doesn't need to know anything about the surrounding vertices/pixels. This is deliberate, because it allows the GPU to process huge numbers of independent vertices and pixels in parallel, and it's one of the reasons GPUs process graphics so much faster than CPUs.
Soon we'll come back to the pipeline to see why work can slow down, but first we need to step back and look at how the mesh and material get into the GPU at all. Here we'll also encounter the first performance obstacle — the draw call.
The GPU cannot work alone: it depends on the game code running on the computer's main processor — the CPU, which tells it what and how to render. The CPU and GPU are (usually) separate chips operating independently and in parallel. To achieve the required frame rate — typically 30 frames per second — both the CPU and the GPU must complete all the work of producing a single frame within the allowed time (at 30fps that's only 33 milliseconds per frame).
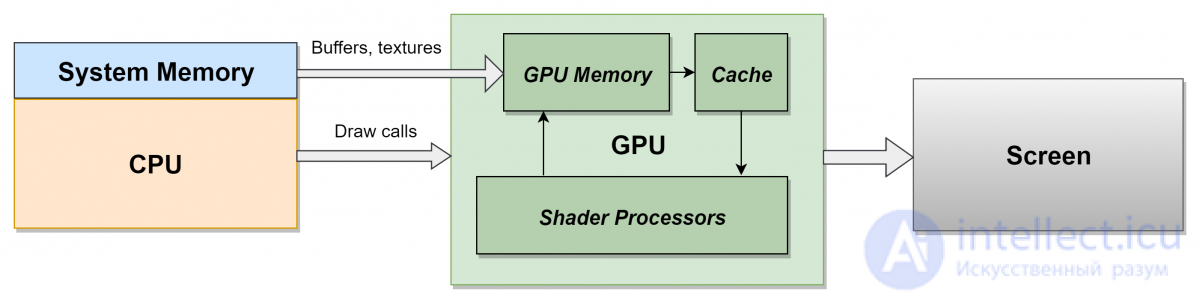
To achieve this, frames are often pipelined: the CPU spends an entire frame on its own work (processing AI, physics, user input, animations, etc.) and then sends instructions to the GPU at the end of the frame so it can get to work on the following frame. This gives each processor a full 33 milliseconds to do its work, but the cost is adding a frame's worth of latency (delay). This can be a problem for very time-sensitive games — for instance, first-person shooters, where the Call of Duty series runs at 60fps to reduce the delay between player input and rendering — but usually the extra frame goes unnoticed by the player.
Every 33 ms the final render target is copied and displayed on screen at VSync — the interval during which the display looks for a new frame to show. But if the GPU needs more than 33 ms to render a frame, it misses this window of opportunity and the monitor doesn't get a new frame to display. This causes flickering or stutter on screen and a drop in frame rate, which should be avoided. The same result occurs if the CPU's work takes too long — this causes a skipping effect, because the GPU doesn't receive commands fast enough to complete its work within the allotted time. In short, a stable frame rate depends on good performance from both processors: the CPU and the GPU.
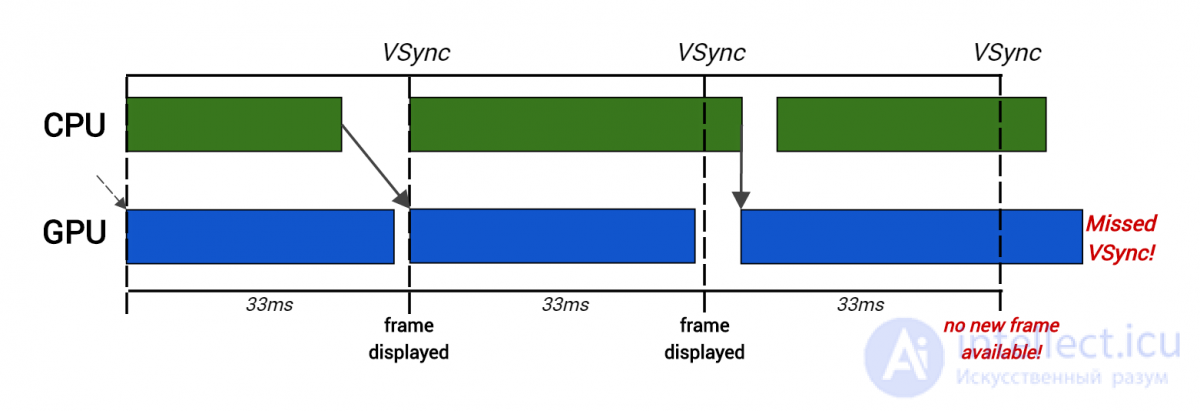
Here, generating rendering commands on the CPU took too long for the second frame, so the GPU begins rendering late and misses VSync.
To display a mesh, the CPU issues a draw call, which is a simple sequence of commands telling the GPU what and how to draw. As a draw call passes through the GPU pipeline, the GPU uses various configurable settings specified in the draw call (mostly set by the material and mesh parameters) to determine how the mesh is rendered. These settings, called the GPU state, affect every aspect of rendering and consist of everything the GPU needs to know to render an object. Most important for us is that the GPU state contains the current vertex/index buffers, the current vertex/pixel shader programs, and all the shader inputs (such as MaterialTexture or LightColor from the shader code example above).
This means that to change an element of the GPU state (for example, to swap a texture or switch shaders), a new draw call must be created. This matters because these draw calls are costly for the GPU. Time is needed to set the desired GPU state changes and then to issue the draw call. Besides the work the game engine has to do for every draw call, there is additional overhead for error checking and storing intermediate results, added by the graphics driver. This is an intermediate layer of code written by the GPU manufacturer (NVIDIA, AMD, etc.) that converts the draw call into low-level hardware instructions. Too many draw calls place a heavy burden on the CPU and lead to serious performance problems.
Because of this load, an upper limit on the acceptable number of draw calls per frame usually has to be set. If this limit is exceeded during gameplay testing, steps must be taken to reduce the number of objects, lower the rendering depth, and so on. In console games, the number of draw calls is usually limited to a range of 2000–3000 (for example, for Far Cry Primal we aimed for no more than 2500 per frame). That may seem like a large number, but it also has to cover special rendering techniques — cascaded shadows, for example, can easily double the number of draw calls in a frame.
As mentioned above, the GPU state can only be changed by issuing a new draw call. This means that even if you created a single mesh in a 3D editor, if one half of the mesh uses one texture for its albedo map and the other half uses a different texture, the mesh will render as two separate draw calls. The same is true when a mesh consists of several materials: different shaders must be used, meaning several draw calls must be issued.
In practice, a very common source of state changes — and thus additional draw calls — is switching texture maps. Usually the same material (and hence the same shaders) is used for an entire mesh, but different parts of the mesh have different sets of albedo/normal/roughness maps. In a scene with hundreds or even thousands of objects, spending several draw calls per object eats up a significant portion of CPU time and strongly affects the game's frame rate.
To avoid this, a common solution is applied: all the texture maps used by a mesh are combined into a single large texture, often called an atlas. The mesh's UV coordinates are then adjusted so that they look up the correct parts of the atlas, and the entire mesh (or even several meshes) can be rendered in a single draw call. When building an atlas, you need to be careful that neighboring textures don't bleed into each other at low MIP levels, but these issues are less serious than the speed benefits this approach provides.
Many engines support instancing, also known as batching or clustering. This is the ability to use a single draw call to render several objects that are practically identical in terms of shaders and state, with differences limited (usually to their position and rotation in the world). Engines can usually recognize when several identical objects can be rendered via instancing, so whenever possible you should aim to reuse a single object in a scene multiple times rather than using several different objects that would each need to be rendered in separate draw calls.
Another popular technique for reducing the number of draw calls is manually merging several different objects that share the same material into a single mesh. This can be effective, but excessive merging should be avoided, as it can hurt performance by increasing the amount of work for the GPU. Even before draw calls are created, the engine's visibility system can determine whether an object is on screen at all. If not, it's far cheaper to simply skip it at this early stage and not spend draw calls and GPU time on it (this technique is also known as visibility culling). This is usually implemented by checking the visibility of the object's bounding volume from the camera's viewpoint and checking whether it is fully occluded by other objects in the field of view.
However, when several meshes are merged into a single object, their individual bounding volumes are combined into one large volume big enough to contain each of the meshes. This increases the likelihood that the visibility system will see part of the volume and therefore consider the entire set of meshes visible. This means a draw call will be generated, and the vertex shader will have to run for every vertex of the object, even if only a few vertices are actually visible on screen. This can waste a large portion of GPU time, because most of the vertices end up having no effect on the final image. For these reasons, merging meshes is most effective for groups of small objects that are close together, since they are likely to be visible on the same screen anyway.
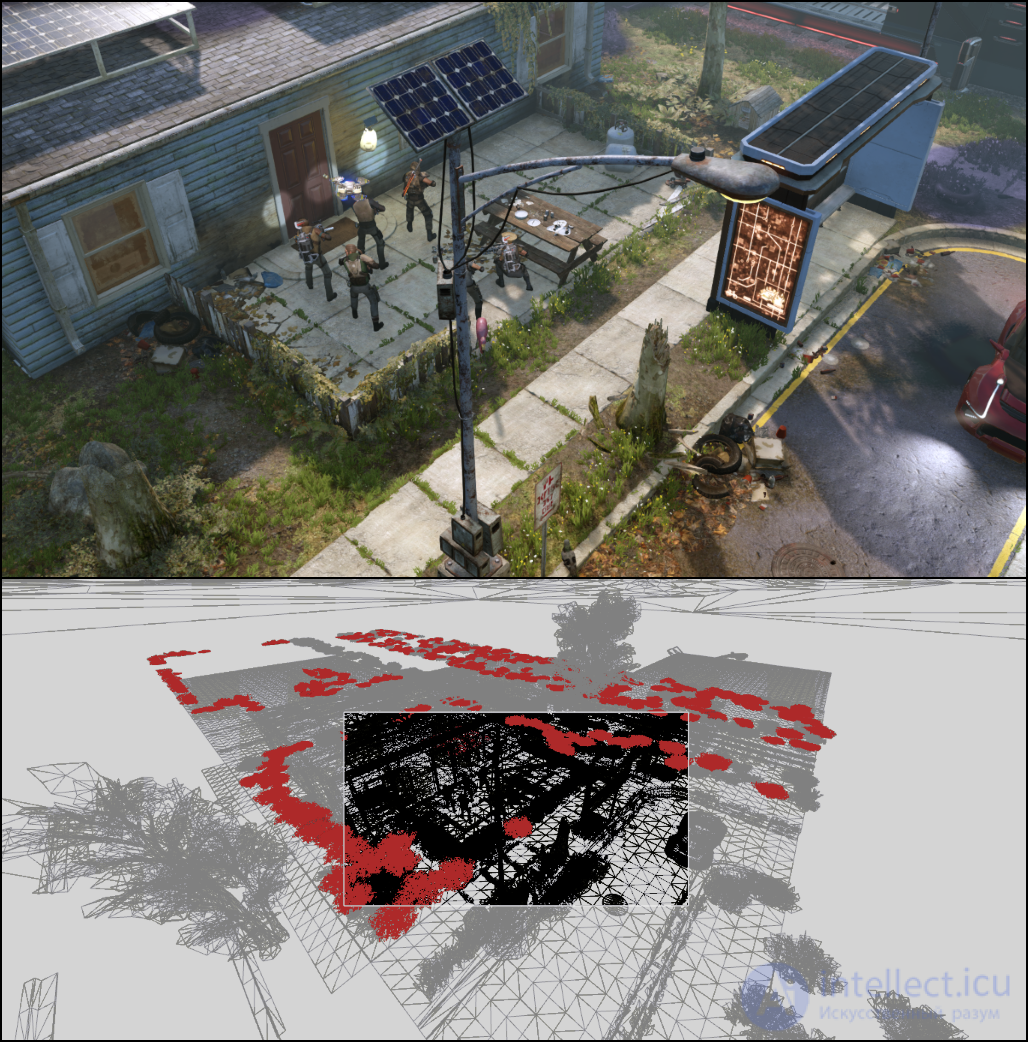
A frame from XCOM 2, captured in RenderDoc. In the wireframe view (bottom), gray shows all the extraneous geometry being passed to the GPU that lies outside the game camera's field of view.
As an illustrative example, let's take a frame from XCOM 2, one of my favorite games of the past couple of years. The wireframe view shows the entire scene being passed by the engine to the GPU, while the black area in the middle is the geometry visible from the game camera. All the surrounding geometry (gray) is invisible and will be culled after the vertex shader runs, meaning it wastes GPU time. In particular, look at the geometry highlighted in red. This is several bush meshes merged together and rendered in just a few draw calls. The visibility system determined that at least some of the bushes are visible on screen, so all of them are rendered and their vertex shader runs, after which the ones that can be culled are identified (it turns out most of them can).
To be clear, I'm not picking on XCOM 2 specifically — I just happened to be playing it a lot while writing this article! Every game has this problem, and there's always a balancing act between the GPU time cost of more accurate visibility checks, the cost of culling invisible geometry, and the cost of more draw calls.
However, the picture changes when it comes to the cost of draw calls themselves. As mentioned above, a major reason for this cost is the extra overhead created by the driver during conversion and error checking. This has been a problem for a very long time, but most modern graphics APIs (for example, Direct3D 12 and Vulkan) have restructured things to avoid this unnecessary work. Although this adds complexity to the game's rendering engine, it results in much cheaper draw calls, letting us render far more objects than was previously possible. Some engines (most notably the latest version of the Assassin's Creed engine) have even gone in a completely different direction, using the capabilities of modern GPUs to drive rendering and effectively eliminate draw calls altogether.
A large number of draw calls mainly reduces CPU performance. Almost all graphics-related performance problems, on the other hand, are tied to the GPU. Now we'll look at what these «bottlenecks» are, where they arise, and how to deal with them.
The very first step in optimization is finding the existing «bottleneck» so that its impact can then be reduced or eliminated entirely. A «bottleneck» is the part of the pipeline that slows down the entire process. In the example above, where there were too many expensive draw calls, the «bottleneck» was the CPU. Even if we had made optimizations that sped up the GPU's work, it wouldn't have affected the frame rate, because the CPU would still be working too slowly and wouldn't manage to build a frame within the required time.
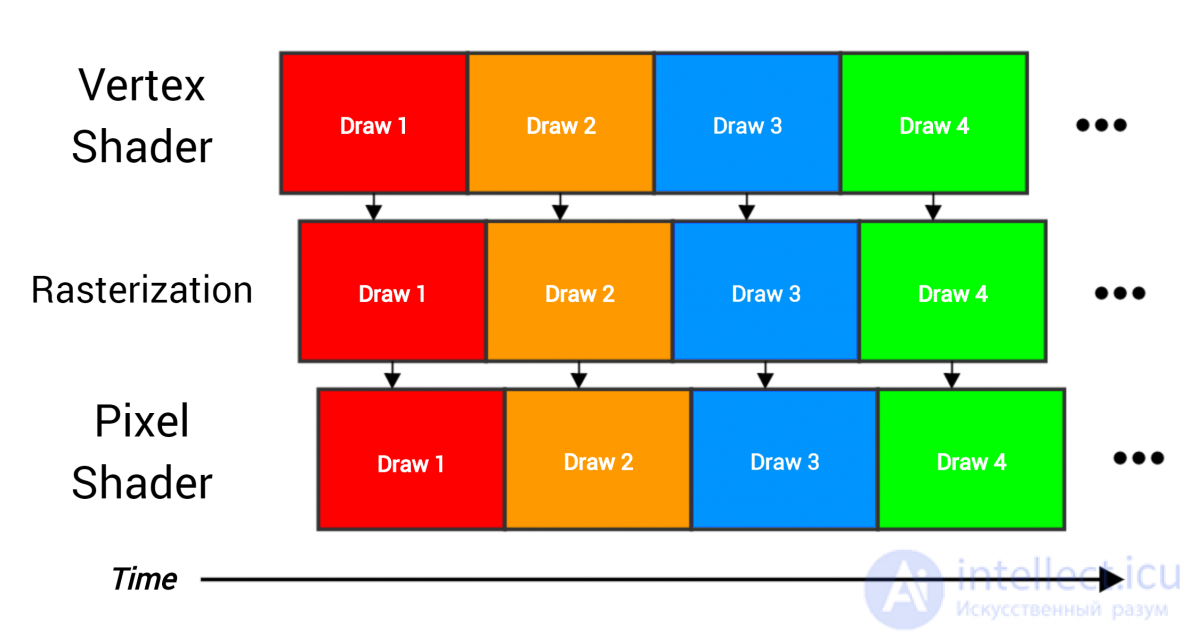
Four draw calls pass through the pipeline, each rendering an entire mesh containing many triangles. The stages overlap, because as soon as one part of the work finishes, it can immediately be passed on to the next stage (for example, once three vertices have been processed by the vertex shader, the triangle can be passed on for rasterization).
An assembly line is a good analogy for the GPU pipeline. As soon as each stage finishes with its data, it passes the results to the next stage and starts on the next piece of work. Ideally, every stage is constantly busy and the hardware is used fully and efficiently, as shown in the figure above — the vertex shader is continuously processing vertices, the rasterizer is continuously rasterizing pixels, and so on. But imagine if one stage took much longer than the others:
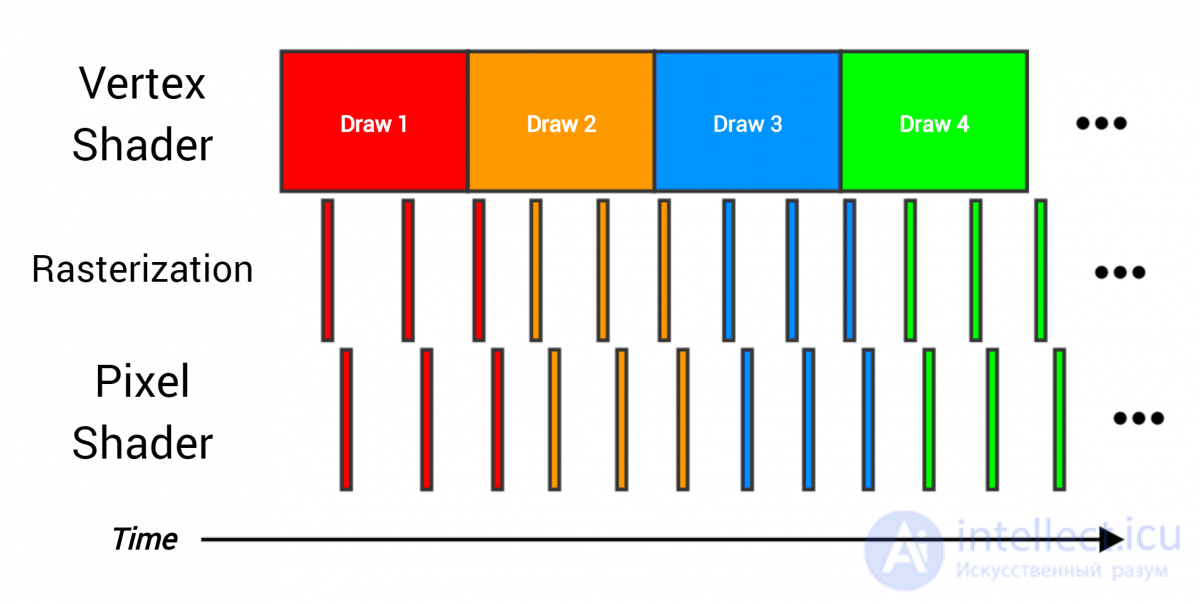
Here, the expensive vertex shader can't pass data to the following stages fast enough, so it becomes the «bottleneck». If you have a draw call like this, speeding up the pixel shader won't significantly change the total render time for the whole draw call. The only way to speed things up is to reduce the time spent in the vertex shader. The way to solve it depends on what is causing the «jam» at the vertex shader stage.
Keep in mind that some «bottleneck» will almost always exist — if you eliminate one, another simply takes its place. The trick is understanding when you can fix it and when you just have to accept it, because it's the cost of doing the rendering work. When optimizing, we aim to eliminate unnecessary «bottlenecks». But how do you determine what the «bottleneck» actually is?
Making effective use of GPUs requires thoughtful optimization. Without it, even the most powerful GPUs can struggle to process data. The main aspects of optimization include:
Reducing polygon count: excess geometry can slow down the image-building process.
Using high-quality compressed textures: this reduces the amount of memory needed for rendering.
Shaders and their optimization: complex shaders can significantly slow down the GPU.
Balancing the load between the CPU and GPU: properly distributing tasks between the processors allows for maximum performance.
Profiling tools are absolutely essential for determining what all of the GPU's time is being spent on. The best ones can even point out what needs to change to speed things up. They do this in different ways — some simply show an explicit list of «bottlenecks», others let you «experiment» and observe the consequences (for example, «how would render time change if all textures were made small», which helps you understand whether you're limited by memory bandwidth or by cache usage).
Unfortunately, things get more complicated here, because some of the best profiling tools are only available for consoles and are therefore covered by an NDA. If you're developing a game for Xbox or PlayStation, ask a graphics programmer to show you these tools. We programmers love it when artists want to influence performance, and we're happy to answer questions or even write guides on using the tools effectively.
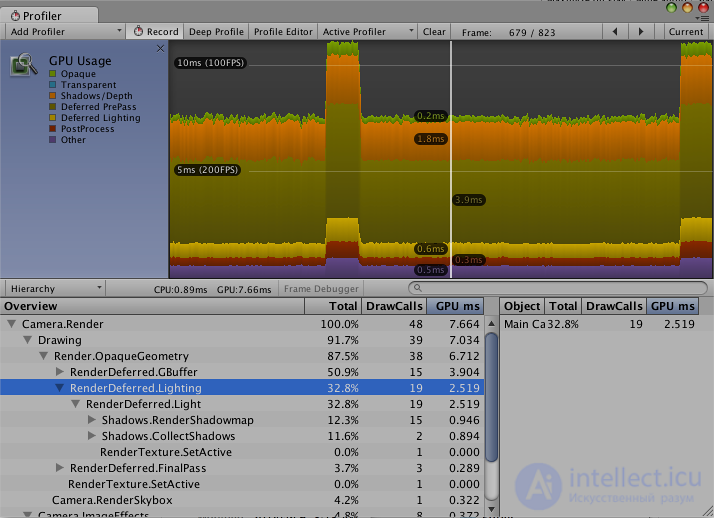
The basic built-in GPU profiler in the Unity engine
For PC there are some quite good (though hardware-specific) profiling tools available from GPU manufacturers, such as NVIDIA's Nsight, AMD's GPU PerfStudio, and Intel's GPA. There's also RenderDoc — the best graphics debugging tool for PC, though it lacks advanced profiling features. Microsoft is rolling out its impressive profiling tool, PIX, for Xbox and now for Windows too, though currently only for D3D12 applications. Assuming the company wants to build the same kind of bottleneck-analysis tools it has for the Xbox version (which is difficult, given the huge variety of hardware), this will be a great resource for PC developers.
These tools can give you all the information about how fast your graphics are. They'll also give you plenty of hints about how a frame is assembled in your engine and allow you to debug it.
It's important to get comfortable with them, because artists should be accountable for the speed of their graphics. But don't expect to figure everything out entirely on your own — any good engine should have its own performance-analysis tools, ideally providing metrics and recommendations that let you determine whether your graphics assets fit within performance budgets. If you want more influence over performance but feel you're lacking the necessary tools, talk to the programming team. There's a good chance such tools already exist — and if they don't, they need to be written!
Now that you know how a GPU works and what a bottleneck is, we can finally get into the interesting stuff. Let's dig into the most commonly encountered real-world «bottlenecks» that can occur in the pipeline, learn how they arise, and what can be done about them.
Since most of the GPU's work is done by shaders, they're often the source of many «bottlenecks». When shader instructions are called a «bottleneck», it simply means that the vertex or pixel shader is doing too much work, and the rest of the pipeline has to wait for it to finish.
Often the vertex or pixel shader program turns out to be too complex, containing many instructions and taking a long time to execute. Or perhaps the vertex shader is quite reasonable, but the mesh being rendered has too many vertices, causing the vertex shader to take too long. Or a draw call affects a large area of the screen and many pixels, which eats up a lot of time in the pixel shader.
Unsurprisingly, the best way to optimize «bottlenecks» in shader instructions is to execute fewer instructions! For pixel shaders, this means choosing a simpler material with fewer features to reduce the number of instructions executed per pixel. For vertex shaders, it means simplifying the mesh to reduce the number of vertices processed, as well as using LOD (Level Of Detail — simplified versions of a mesh used when an object is far away and takes up little space on screen).
Sometimes, however, «jams» in shader instructions simply point to problems in another area. Issues such as excessive overdraw, poor LOD system behavior, and many others can force the GPU to do far more work than necessary. These problems can arise on either the engine side or the content side. Careful profiling, close examination, and experience will help you figure out what's going on.
One of the most common such problems is overdraw. The same pixel on screen has to be shaded multiple times because it's touched by many draw calls. Overdraw is a problem because it reduces the total amount of time the GPU can spend on rendering. If every pixel on screen needs to be shaded twice, then to maintain the same frame rate the GPU can only spend half as much time on each pixel.
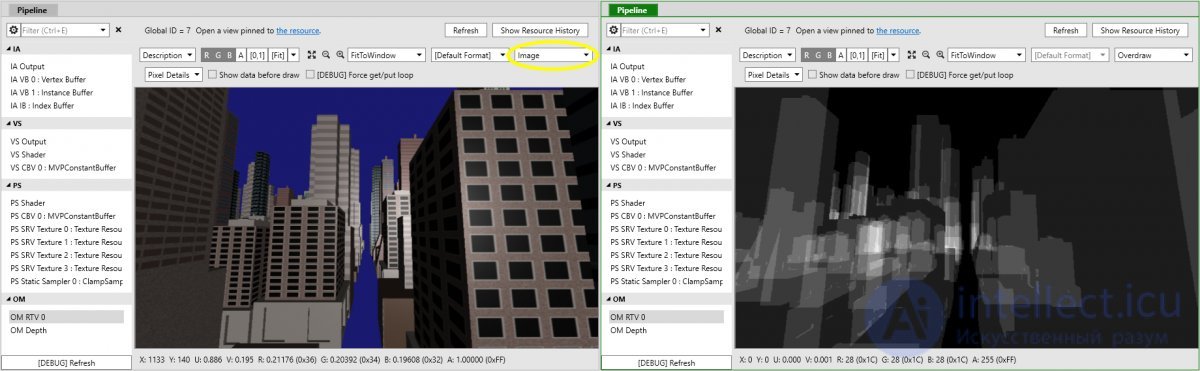
A frame from a game in PIX, with overdraw visualization mode enabled
Sometimes overdraw is unavoidable, for example when rendering translucent objects such as particles or grass: an object in the background is visible through an object in the foreground, so both need to be rendered. But for opaque objects, overdraw is entirely unnecessary, because only the pixel that ends up stored in the buffer at the end of the rendering process needs to be processed. In that case, every overdrawn pixel is wasted GPU time.
The GPU takes steps to reduce overdraw for opaque objects. The early depth test (which happens before the pixel shader — see the pipeline diagram at the start of the article) skips shading a pixel if it determines the pixel is hidden behind another object. To do this, it compares the pixel being shaded against the depth buffer — a render target in which the GPU stores the depth of the entire frame, so that objects can correctly occlude one another. But for the early depth test to be effective, the other object must already be present in the depth buffer, i.e., must have already been fully rendered. This means the order in which objects are rendered matters a great deal.
Ideally, every scene should be rendered front-to-back (i.e., objects closest to the camera rendered first), so that only the front pixels get shaded and the rest are discarded by the early depth test, eliminating overdraw entirely. But in the real world this isn't always achievable, because the order of triangles within a draw call can't be changed during rendering. Complex meshes can overlap themselves multiple times, and merging meshes can create many overlapping objects that render in the «wrong» order and cause overdraw. There's no simple answer to these questions, and it's yet another aspect to consider when deciding whether to merge meshes.
To help the early depth test, some games perform a partial depth prepass. This is a preparatory pass in which some large objects that are effective at occluding others (large buildings, terrain, the main character, etc.) are rendered with a simple shader that only writes to the depth buffer, which is relatively fast because it doesn't do the pixel shader work of lighting and texturing. This «improves» the depth buffer and increases the amount of pixel shader work that can be skipped during the full rendering pass. The downside of this approach is that double-rendering the overlapping objects (once in the depth-only pass and again in the main pass) increases the number of draw calls, plus there's always a chance the time spent rendering the depth pass will exceed the time saved by making the early depth test more effective. Only detailed profiling can tell you whether this approach is worth using in a particular scene.
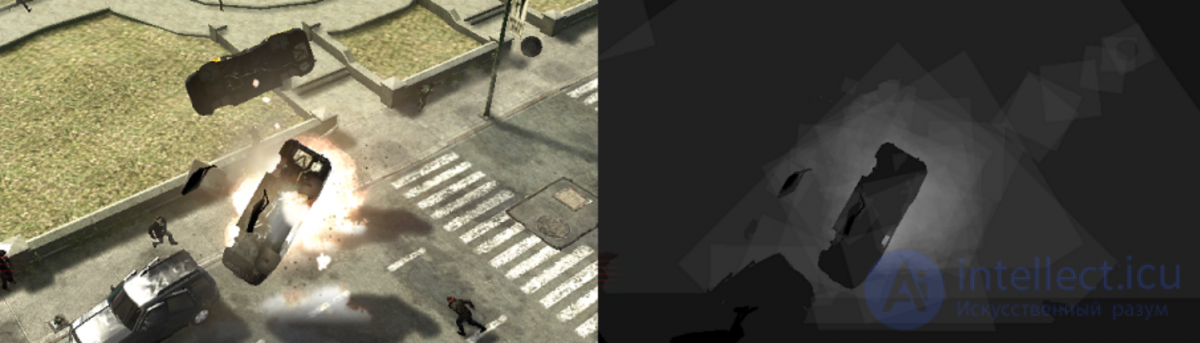
Visualization of overdraw from explosion particles in Prototype 2
Overdraw is especially important when rendering particles, given that particles are transparent and often overlap heavily. When creating effects, artists working with particles should always keep overdraw in mind. A thick cloud effect can be created by emitting many small overlapping particles, but this will significantly increase the cost of rendering the effect. It's better to emit fewer, larger particles and rely more on textures and texture animation to convey the sense of density. In this case the result is often visually more effective too, because software like FumeFX and Houdini can usually produce far more interesting effects through texture animation than real-time simulation of individual particle behavior.
The engine can also take steps to eliminate unnecessary GPU work when computing particles. Every rendered pixel that ends up completely transparent is wasted time, so an optimization called particle trimming is usually applied: instead of rendering a particle as two triangles, a polygon is generated that minimizes the empty areas of the texture being used.

The particle «trimming» tool in Unreal Engine 4
The same can be done with other partially transparent objects, such as vegetation. In fact, for vegetation it's even more important to use custom geometry that eliminates large empty areas of texture, because vegetation often uses alpha testing. This uses a texture's alpha channel to determine whether a pixel needs to be discarded at the pixel shader stage, making it transparent. This is problematic because alpha testing has the side effect of completely disabling the early depth test (because it invalidates the assumptions the GPU makes about the pixel), leading to a much larger amount of unnecessary pixel shader work. On top of that, vegetation often contains a great deal of overdraw (think of all the overlapping leaves on a tree), and if you're not careful it can quickly become very expensive to render.
Very closely related in effect to overdraw is overshading, caused by small or thin triangles. It can severely hurt performance, wasting a significant portion of GPU time. Overshading is a consequence of how the GPU processes pixels during pixel shading: not one at a time, but in «quads». These are blocks of four pixels arranged in a 2x2 square. This is done so the hardware can handle tasks like comparing UVs between pixels to compute the appropriate MIP texture levels.
This means that if a triangle only touches a single point of a quad (because the triangle is small or very thin), the GPU still processes the entire quad and simply discards the other three pixels, wasting 75% of the work. This wasted time can add up and is especially costly for forward (i.e., non-deferred) renderers that compute lighting and shading in a single pixel shader pass. This load can be reduced by using properly configured LODs; besides saving on vertex shader processing, they also significantly reduce the amount of overshading because, on average, triangles cover a larger portion of each quad.
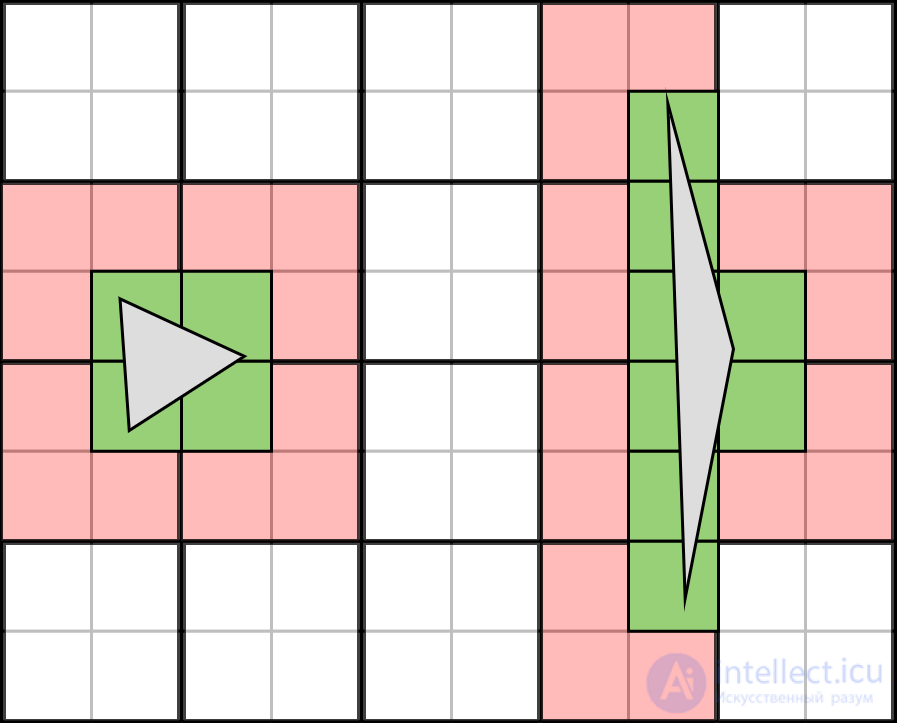
A 10x8 pixel buffer with 5x4 quads. Two triangles make poor use of the quads — the left one is too small, the right one too thin. The 10 red quads touched by the triangles must be fully shaded, even though in reality only the 12 green pixels actually need shading. In total, 70% of the GPU's work is wasted.
(Additional note: quad overshading is also often the reason a full-screen post-effect covering the monitor uses one large triangle instead of two adjoining triangles. When two triangles are used, the quads straddling the triangles' shared edge waste part of their work, so this is avoided to save a small fraction of GPU time.)
Besides overshading, small triangles create another problem: the GPU processes and rasterizes triangles at a certain rate, which is usually relatively low compared to the number of pixels it can process in the same amount of time. If there are too many small triangles, it can't produce pixels fast enough to keep the shaders continuously busy, resulting in stalls and idle time — the true enemies of GPU performance.
Long, thin triangles hurt performance not only because of quad usage: the GPU rasterizes pixels in square or rectangular blocks, not in long strips. Compared to equilateral triangles, long thin triangles create a lot of extra unnecessary rasterization work for the GPU, which can create a «bottleneck» at the rasterization stage. This is why it's generally recommended to tessellate meshes into equilateral triangles, even if this slightly increases the polygon count. As in all other cases, experimentation and profiling are what let you find the best balance.
As shown above in the GPU pipeline diagram, mesh geometry and textures are stored in memory that is physically separate from the shader processors. This means that whenever the GPU needs to access some piece of data — for example, a texture requested by the pixel shader — it has to fetch it from memory before it can perform computations.
Accessing memory is similar to downloading files from the Internet. Downloading a file takes some amount of time, depending on the bandwidth of the Internet connection — the speed at which data can be transferred. This bandwidth is shared among all downloads — if you can download one file at 6MB/s, two files will each download at 3MB/s.
The same is true for memory access: the GPU's access to index/vertex buffers and textures takes time, and the speed is limited by memory bandwidth. Of course the speeds are much faster than an Internet connection — theoretically the PS4's GPU has a bandwidth of 176GB/s — but the principle remains the same. A shader that accesses several textures is heavily bandwidth-dependent, since it needs all the required data delivered in time.
Shader programs run on the GPU with these constraints in mind. A shader that needs to access a texture tries to begin the data transfer as early as possible and then move on to other, unrelated work (such as computing lighting), hoping that the texture data will already have arrived from memory by the time it reaches the part of the program that needs it. If the data isn't ready in time — because the transfer is slowed down by many other transfers, or because all the other work has run out (this is especially likely with dependent texture lookups) — execution stalls, and the shader sits idle waiting for the data. This is called a memory bandwidth «bottleneck»: no matter how fast a shader runs, it doesn't matter if it has to stop and wait to get data from memory. The only way to optimize this is to reduce the memory bandwidth used, or the amount of data being transferred, or both.
Memory bandwidth even has to be shared with the CPU or with asynchronous compute work the GPU is doing at the same time. It's a very precious resource. Most of the memory bandwidth is usually taken up by texture transfers, because textures contain so much data. That's why there are various mechanisms for reducing the amount of texture data that needs to be transferred.
The first and most important is the cache. This is a small area of high-speed memory the GPU can access very quickly. It stores recently fetched chunks of memory in case the GPU needs them again. Continuing the Internet analogy, the cache is like the computer's hard drive, where downloaded files are stored for faster access in the future.
When accessing a piece of memory — for example, a single texel in a texture — the surrounding texels are also loaded into the cache in the same memory transfer. The next time the GPU looks for one of those texels, it doesn't have to make the whole trip to memory and can fetch the texel from the cache very quickly. In practice this technique is used very often — when a texel is displayed on screen at one pixel, it's very likely that a neighboring pixel will need to display the same texel or a neighboring one from the texture. When that happens, nothing needs to be transferred from memory, no bandwidth is used, and the GPU can access the cached data almost instantly. That's why caches are essential for eliminating memory-related bottlenecks. This matters especially when filtering is taken into account — bilinear, trilinear, and anisotropic filtering each require several samples per lookup, placing extra load on bandwidth. High-quality anisotropic filtering in particular uses a lot of bandwidth.
Now imagine what happens to the cache if you try to display a large texture (say, 2048x2048) on an object that's very far away and takes up only a few pixels on screen. Each pixel will have to fetch from a completely different part of the texture, and the cache will be completely ineffective in this case, because it only stores texels close to the ones fetched in previous accesses. Every texture access tries to find its result in the cache but fails (a so-called «cache miss»), so the data has to be fetched from memory, meaning a double cost: bandwidth is used and time is spent on the transfer. This can introduce a stall that slows down the entire shader. It can also cause other (potentially useful) data to be evicted from the cache to make room for neighboring texels that will never actually be used, reducing overall cache efficiency. This is bad news in every respect, not to mention the graphics-quality issues it causes — small camera movements lead to sampling completely different texels, resulting in artifacts and flickering.
This is where MIP mapping comes to the rescue. When a texture fetch is requested, the GPU can analyze the texture coordinates used at each pixel and determine whether there's a large gap between the texture access coordinates. Instead of causing a «cache miss» for every texel, it accesses a smaller MIP texture matching the required resolution. This significantly increases cache efficiency, reduces bandwidth usage, and lowers the chance of a bandwidth-related bottleneck. Smaller MIP textures also require less data to be transferred from memory, further reducing the load on bandwidth. And finally, because MIP textures are pre-filtered, using them significantly reduces artifacts and flickering. That's why MIP mapping is worth using in almost every case — its benefits definitely outweigh the increased memory footprint.
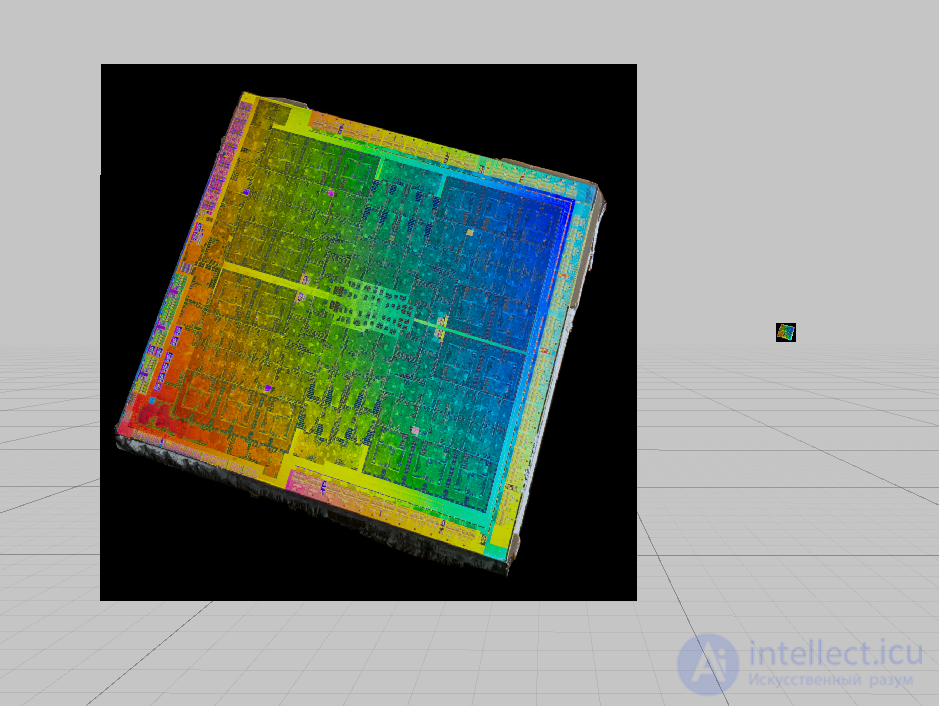
A texture on two quads, one close to the camera and the other much farther away
The same texture with its corresponding MIP chain, each level half the size of the previous one
Last but not least, an important way to reduce bandwidth and cache usage is texture compression (which, of course, also saves memory space by storing less texture data). With BC (Block Compression, formerly known as DXT compression), textures can be shrunk to a quarter or even a sixth of their original size at the cost of only a minor quality loss. This is a significant reduction in the amount of data transferred and processed, and most GPUs even store compressed textures in the cache, leaving more room to store data for other textures and improving overall cache efficiency.
All of the information above should point to some obvious steps for reducing or eliminating bandwidth «jams» when optimizing textures from an artist's point of view. Make sure textures have MIPs and are compressed. There's no need to use «heavy» 8x or 16x anisotropic filtering if 2x is enough, or even trilinear/bilinear filtering. Lower texture resolution, especially if the highest-detail MIP levels are frequently shown on screen. Don't use material features that require texture access unless necessary. And check that all the data being fetched is actually used — don't sample four RGBA textures if in reality you only need data from the red channel; combine those four channels into a single texture, eliminating 75% of the bandwidth load.
Textures are the main, but not the only, «consumers» of memory bandwidth. Mesh data (index and vertex buffers) also needs to be loaded from memory. In the first GPU pipeline diagram, you can see that the final render target output is written to memory. All these transfers usually share a common memory bandwidth budget.
In standard rendering, all these costs are usually negligible, because compared to texture data this amount of data is relatively small — but that's not always the case. Unlike ordinary draw calls, shadow passes behave quite differently and are far more likely to be bandwidth-limited.
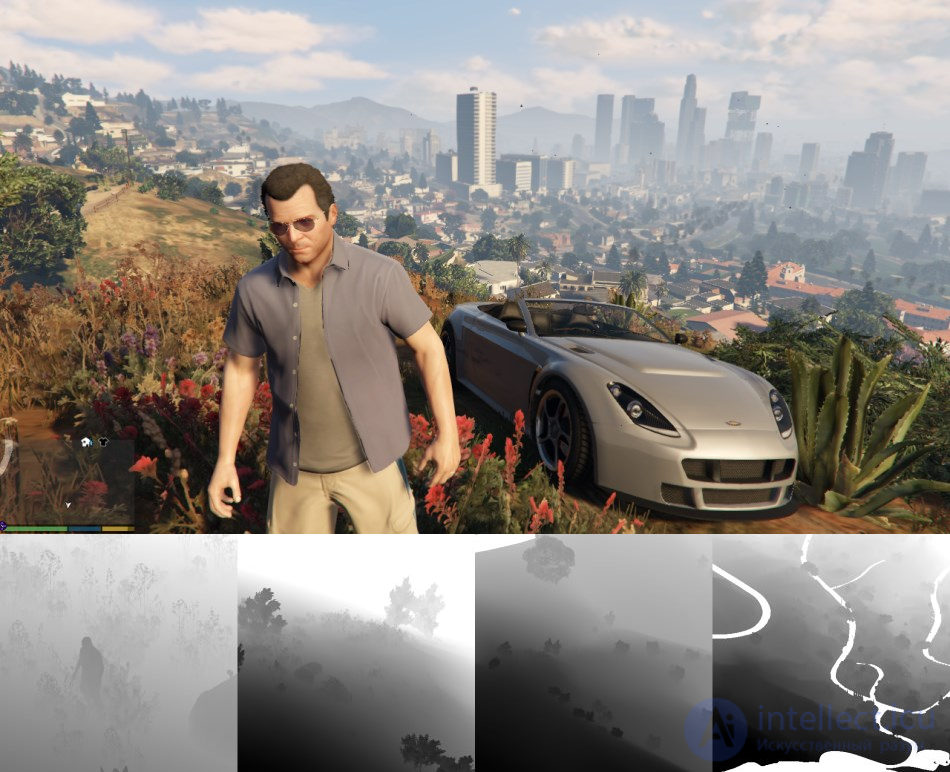
A frame from GTA V with shadow maps, illustration taken from Adrian Courrèges's excellent frame analysis (original article)
This is because a shadow map is simply a depth buffer representing the distance from the light source to the nearest mesh surface, so most of the work needed to render shadows consists of transferring data to and from memory: fetching vertex/index buffers, performing simple computations to determine position, and then writing the mesh's depth to the shadow map. Most of the time the pixel shader doesn't even run, because all the necessary depth information comes from vertex data. That's why shadow passes are especially sensitive to vertex/triangle count and shadow map resolution, since these directly affect the amount of bandwidth required.
The last thing worth mentioning regarding memory bandwidth is a special case — Xbox. Both the Xbox 360 and Xbox One have a special piece of memory located close to the GPU, called EDRAM on the 360 and ESRAM on the XB1. This is a relatively small amount of memory (10 MB on the 360 and 32 MB on the XB1), but it's large enough to hold several render targets, and possibly some frequently used textures. Its bandwidth is much higher than that of standard system memory (DRAM). What matters isn't just the speed, but the fact that this bandwidth has its own dedicated channel, meaning it's independent of DRAM transfers. This adds complexity to the engine, but when used effectively it provides extra headroom in bandwidth-constrained situations. Artists usually don't have control over what gets written to EDRAM/ESRAM, but it's worth knowing about them when it comes to profiling. You can learn more about the specifics of your engine's implementation from your 3D programmers.
GPUs play a key role in creating modern graphics, from games to professional visualization. Their ability to process enormous volumes of data at incredible speed makes them indispensable in the industry. Understanding the principles of how they work and the stages of image construction allows artists and programmers to create projects that are both visually striking and performant. Ultimately, making skillful use of GPU capabilities opens up new horizons for creativity and technology.
With well-organized data transfer, GPUs are capable of processing enormous volumes of information and performing billions of operations every second. However, if data is transferred poorly or used inefficiently, performance can drop sharply, negatively affecting the game's frame rate.
Of course, this topic is vast and calls for in-depth study, but for a technically minded artist, this introduction can serve as a good starting point. By understanding the fundamentals of how GPUs work, you'll be able to create graphics that not only look impressive but also perform well. And high performance, in turn, can make your game even more appealing.
Although this article provides a lot of useful information, remember that your 3D programmers are always ready to discuss tricky points and help with in-depth technical questions.

Comments