Lecture
Venn and Euler diagrams look very similar, so it is understandable that many people find it difficult to understand the difference. Although both types of diagrams are based on set theory, there are some subtle differences that make them unique. Hopefully, this article will clarify your doubts regarding Venn diagrams vs Euler diagrams and I will provide some examples to clarify it.
Venn vs Euler: Definition
As I mentioned earlier, both sets of diagrams are based on set theory. A Venn diagram shows all possible logical relationships between a collection of sets. But an Euler diagram only shows those relationships that exist in the real world.
Venn vs Euler Diagrams Example Diagrams
Let's start with a very simple example. Let's consider a superset of animals with mammals and birds as subsets. A Venn diagram shows the intersection between the two sets, even though such a possibility does not exist in the real world. An Euler diagram, on the other hand, does not show the intersection.
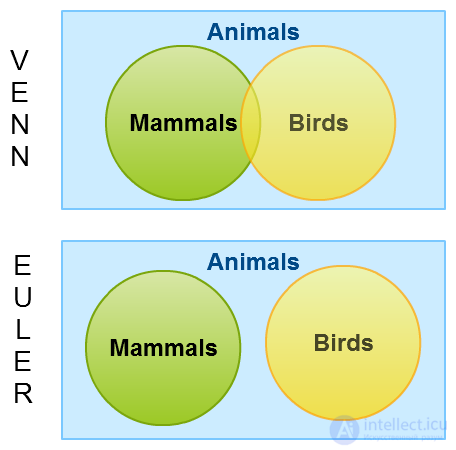
Venn diagrams show all possible combinations, even if they do not exist in a real-world scenario
Now let's look at a more complex example involving a deck of cards. Again, it is important to keep in mind the difference between the two types of diagrams, all possible combinations versus real combinations. Let's take the cards as a superset and the black cards, red cards, and diamonds as subsets.
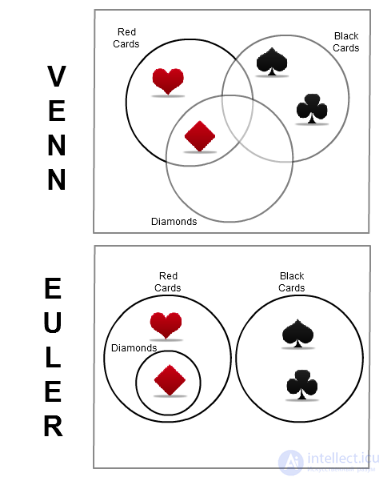
How the Same Data is Represented Differently Using Venn and Euler Diagrams
As the example above shows, Venn diagrams show four intersections that do not have any data because they are supposed to show all possible combinations.
There are various methods to convert Venn diagrams to Euler diagrams and vice versa. Check out this great Euler diagram wiki article that explains some of the methods that can be used to convert Venn diagrams to Euler diagrams. I hope the examples above helped you clarify your doubts regarding Venn diagrams vs. Euler diagrams. If you have any questions, feel free to ask in the comment section.
Whether you are drawing Venn or Euler diagrams, Creately has all the tools you need. You can get started quickly with the Venn diagram templates available to our users or start from scratch in the drawing area. If you want to add icons and images to your Venn diagram, it is easy to do so with the built-in Google Image Search available in the left sidebar. With so many super cool features, you can't go wrong with Creately.
Similarities between Venn and Euler diagrams:
Both represent sets and their intersections.
Use areas (usually circles or ovals) to represent sets.
Help visualize logical relationships between sets.
Differences between Venn and Euler diagrams:
Differences between Venn and Euler diagrams:
| Criterion | Venn diagram | Euler diagram |
|---|---|---|
| Completeness of coverage | Shows all possible intersections, even if they are empty. | Shows only existing intersections. |
| Using areas | Always includes all possible intersection zones, even if there are no elements in them. | Does not include empty intersections (if the sets do not intersect, their regions do not intersect). |
| Application | Most often used in logic and set theory, especially in mathematics. | More commonly used in computer science, cognitive science, and philosophy. |
| Visual representation | More formalized and standardized. | Flexible in construction, the shape of the areas can vary greatly. |
Example:
If we have sets A and B, but they do not intersect, then:
In a Venn diagram, they will still be drawn in such a way that a possible (albeit empty) intersecting region is shown.
In an Euler diagram, they will simply be drawn separately, without intersecting.
Conclusion:
Venn diagrams are suitable for a rigorous analysis of all possible relationships between sets, while Euler diagrams are suitable for a more intuitive display of real relationships between sets.

Comments
To leave a comment
Discrete Math. Set theory. Graph theory. Combinatorics.
Terms: Discrete Math. Set theory. Graph theory. Combinatorics.