
Lecture
In 1905 Ejnar Hertzsprung, and in 1910 Henry Russell, established the existence of a dependence between spectral type and the luminosity of stars. This dependence is illustrated by a graph, on one axis of which the spectral class is plotted, and on the other - the absolute stellar magnitude. This diagram is called the spectrum-luminosity diagram or the Hertzsprung-Russell diagram.
Instead of absolute stellar magnitude, luminosity can be plotted, and instead of spectral classes - color indices or effective temperature.
The position of each star on the diagram is determined by its physical nature
and stage of evolution. Therefore the diagram captures the entire history of the system of stars being considered.
The diagram makes it possible to distinguish various groups of stars, united by common
physical properties, and to establish the relationship between some of their physical characteristics. With the help of the diagram, the chemical composition and evolution of stars can be studied.
The upper part of the diagram corresponds to stars of high luminosity, which
for a given temperature value are distinguished by large sizes. Here
are located the giants and supergiants.
The lower part of the diagram is occupied by stars of low luminosity. Here
are the dwarfs.
In the left part are located hot stars of earlier spectral classes, and in the right - cooler stars, corresponding to later spectral classes.
The diagonal running from upper left to lower right is called the main sequence. Along it are located stars, ranging from the hottest to the most
coolest.
Detailed study of the diagram makes it possible to distinguish several sequences, besides the main one, but having greater dispersion. These sequences indicate that some groups of stars have an individual dependence of luminosity on temperature.
These sequences are called luminosity classes (from I to VII).
I - Supergiants. Occupy the upper part of the diagram and are divided into several sequences.
II - bright giants. | are located on the diagram
III - weak (normal) giants. | between the supergiants and the main
IV - subgiants. | sequence.
V - dwarfs (the majority of main-sequence stars).
VI - subdwarfs. Form a sequence running below the main sequence
by about one stellar magnitude, starting from class A0 rightward.
VIIa and VIIb - white dwarfs. Occupy the lower part of the diagram.
A star's membership in a given luminosity class is established on the basis of special additional features of spectral classification.
Supergiants have narrow and deep lines, while white dwarfs have very
broad lines.
In the spectra of dwarfs, the lines of some metals are relatively weaker than in
giants of the same spectral classes. The spectra of subdwarfs are distinguished by the
weakness of all metallic lines, which is related to the lower metal content in these stars.
Determination of luminosity class can serve as a basis for spectroscopic determination of absolute stellar magnitudes and distances.
The method of determining distances, based on the empirical dependence
of stellar luminosity on the ratio of intensities of certain lines in the spectrum, is called the method of spectroscopic parallaxes.
Spectroscopic parallaxes can be determined for very distant objects, if their spectra have been studied.
For example, if it is known that a star belongs to a certain spectral
class, we can determine from the spectral lines which luminosity class it belongs to: giants, main sequence, or dwarfs. Having thus determined
the absolute stellar magnitude and having measured the apparent magnitude, we can find
the distance to the star using the formula:
lg r = (m - M + 5)/5.
The error in determining distance by this method is 20% and does not depend
on the distance.
From the formula
lgR = 1/2 lg L + 2 lg (Tc/Teff).
it follows that the radii, luminosities and effective temperatures of stars are related
by a dependence.
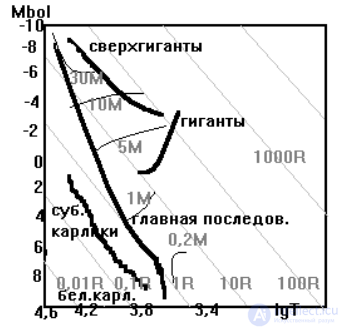
For each sequence of stars on the spectrum - luminosity diagram, a definite
relationship between spectral class and radius can be established.
Let us plot the absolute bolometric stellar magnitude on one axis and the logarithm of stellar temperature on the other. On such a diagram, the position of all stars having the same radii will be represented by straight lines, since the relationship between lgL and
lgT is linear. The figure shows lines of constant radii, allowing
the size of a star to be easily found from its luminosity and spectrum.
The radii of various stars vary within wide limits: from hundreds and thousands of solar radii to a thousandth of the Sun's radius.
The main sequence and the supergiant sequence are represented as
almost straight lines. This makes it possible to establish an empirical relationship for these stars between bolometric luminosity and radius. For
main-sequence stars the following formula holds:
Lbol = R5.2
Mass cannot be determined for single stars. Therefore only
a few masses of stars in binary systems are known. For a few stars
an empirical relationship between mass and bolometric luminosity has been found.
Lbol = M3.9
From this formula it follows that the most massive stars, with masses tens of times greater than that of the Sun, are located in the upper part of the main sequence.
As one moves downward, the masses decrease.
The most densely populated regions of the Hertzsprung-Russell diagram correspond to the longest stages of stellar evolution. As their luminosity changes, stars
change their position on the diagram over time.
Observations show that some stars are combined into physically bound pairs. They are called physical binary stars.
There are also chance groupings of stars, when it appears that stars
form a pair due to the projection effect of two physically unrelated
objects. Such pairs are called optical.
Binary stars are very common. Their study is important for clarifying
the nature of stars and for cosmogonic problems of the origin and evolution
of stars.
Both components of the pair attract each other strongly, but the force of attraction
is balanced by the centrifugal force of rotation. This leads to orbital motion around a common center of mass. The velocity of this motion and the shape
of the orbit carry information about the masses of the celestial bodies, which is why studies of binary stars are very important. Binary stars probably formed at the same time
as the birth of their constituent stars as a result of the contraction of an original gas cloud.
Binary systems are very diverse. There are pairs so close
to each other that their surfaces almost touch. Tidal interaction leads to the components acquiring an ellipsoidal shape, and from their
surfaces matter flows from one component to the other or is even
gradually ejected beyond the system. The orbital periods of such systems amount to several hours.
For example, the star W Ursae Majoris consists of two identical stars,
which revolve around a common center of mass with a period of 8 hours. The distance between their centers is about 2 million km, and their surfaces almost touch.
The binary nature of such a system is revealed using a spectrograph, and
also by studying mutual eclipses, which cause variability in brightness.
These stars cannot be seen separately. Such systems are called spectroscopic
binaries or photometric binaries, depending on whether
their binary nature is established using a spectrograph or a photometer.
When the two components are separated further, by a distance of several hundred radii, they can be resolved with a telescope. Such pairs are called visual binaries.
The distances between the components of these pairs can be so great that the attraction of other stars is capable of disrupting the binary system.
The components can be identical, or they can be quite different. Sometimes
one of the stars is so small that it is invisible and betrays its presence by causing
anomalies in the motion of the main star. Such systems are called astrometric binaries.
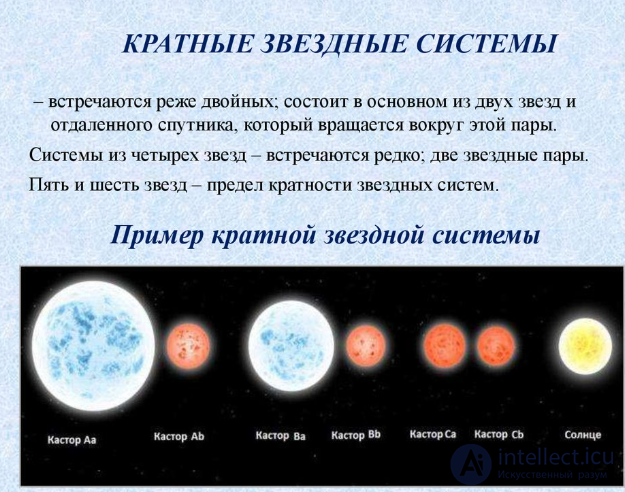
Multiple star systems, consisting of several stars, are often encountered.
In this case such pairs can simultaneously be visual binaries, spectroscopic binaries, and have invisible companions. For example, the star Alpha Centauri.
The motions of the components of binary stars occur in accordance with
Kepler's laws; both components describe similar elliptical
orbits in space around a common center of mass. If one of the stars is significantly smaller
than the other, it moves in an ellipse around the massive star. The values of the semi-major axes of the two ellipses are inversely proportional to the masses of the stars. Thus,
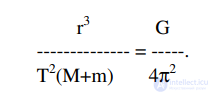
if the orbit of relative motion is known from observations, then
one can calculate the sum of the masses of the components of the binary star by the formula:
If the ratios of the semi-axes of the orbits of the stars' motion relative to the center
of mass are known, then one can also find the ratio of the masses and the mass of each star.
Suppose the main star is located at the focus of the ellipse. The point of the companion's orbit closest to the main star is called the periastron, and the opposite point -
the apoastron.
The motion of the satellite is characterized by orbital elements: the length of the semi-major axis, the orbital eccentricity, the angle of inclination of the orbit (i.e., the angle it makes with the plane of the sky, perpendicular to the line of sight),
the orbital period of the satellite, the moment of the satellite's passage through periastron, and the longitude of periastron.
The apparent orbit of a companion star relative to the primary star is found from
long-term observations made in different epochs, over
decades.
Sometimes the duplicity of a star is first detected by anomalies in its motion among the background stars of the primary component, and only later is it possible to resolve the pair with a
telescope.
The apparent orbit of a visual binary star is the projection of the true orbit onto the plane of the sky. Therefore, to determine all the elements of the orbit
one needs to know the inclination angle i. The inclination angle and the longitude of periastron are found by a
geometric method. The orbital period, the moment of the satellite's passage
through periastron, and the position angle are found from observations.
The true value of the semi-major axis of the orbit a and the apparent one a’ are related by the formula:
a’ = a √ (1 - sin2ω sin2
i).
The value of the semi-major axis can be found only if the star's parallax is known.
More than 60,000 visual binary systems are currently registered.
For 2000 of them it has been possible to detect orbital motions with periods ranging from 2.62
years to tens of thousands of years. However, reliable orbits have been calculated for approximately
500 objects with periods not exceeding 500 years.
Eclipsing variables are close pairs of stars, unresolvable by telescopes, whose apparent magnitude changes due to periodically occurring eclipses of one component of the system by another, as seen by a terrestrial observer. In this case the star with the greater luminosity is called the primary,
and the one with the lesser luminosity - the companion. Typical examples are Algol (β Persei) and β Lyrae.
Due to the regularly occurring eclipses of the primary star by the companion, and
also of the companion by the primary star, the total apparent magnitude changes periodically.
A graph depicting the change in the star's radiation flux over time is called a light curve. The moment in time at which the star has its smallest
apparent magnitude is called the epoch of maximum, and the largest -
the epoch of minimum.
The difference in magnitudes at minimum and maximum is called the amplitude, and
the interval of time between two consecutive maxima or minima is called the period of variability.
From the nature of the light curve of an eclipsing variable star one can find the elements of the orbit of one star relative to the other, the relative sizes of the components, and an idea of their shape.
Two minima are visible on the light curve - a deep one, corresponding to the eclipse
of the primary star, and a shallow one, occurring when the primary star eclipses the companion.
primary orbit
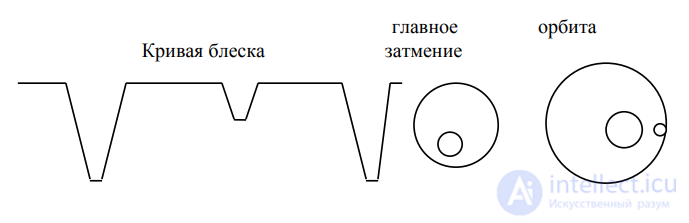
Based on a detailed study of light curves, the following
data on the components of eclipsing variable stars can be obtained:
1. The nature of the eclipses is determined by the inclination and sizes of the stars. When the disk
of one star is completely covered by the disk of the other, the corresponding regions of the light curve have flat sections, which indicates the constancy of the radiation
of the system for a period of time. If the eclipses are partial, the minima
are sharp.
2. Based on the duration of the minima, the radii of the components are found,
expressed as fractions of the semi-major axis of the orbit, since the duration of the eclipse is proportional to the diameters of the stars.
3. If the eclipse is total, then from the ratio of the depths of the minima one can find
the ratio of the luminosities, and if the radii are known - the ratio of the effective
temperatures of the stars.
4. The ratio of the time intervals from the middle of the primary minimum to the middle of the secondary minimum, and from the secondary minimum to the next primary minimum, depend on the eccentricity of the orbit and the longitude of periastron. The asymmetry of the position of the secondary minimum makes it possible to find e cosω.
5. A smooth change in the light curve indicates ellipsoidality, caused by
the tidal effect of very close components of binary stars.
About 4000 eclipsing stars of various types are currently known. The minimum known period is about an hour, the maximum more than 57 years.
In the spectra of some stars a periodic splitting or oscillation of the position of spectral lines is observed. If these stars are eclipsing
variables, the oscillations of the lines occur with the same period as the change in brightness. At the moments of conjunction, when both stars move perpendicular to the line of sight, the deviation of the spectral lines from the mean position equals 0. If the observed spectrum belongs to only one star, then
instead of line splitting, a shift of the lines is observed, now toward the red, now toward the blue
region of the spectrum. The dependence of radial velocity on time, determined from
line shifts, is called the radial velocity curve.
About 2500 stars are currently known whose binary nature has been
established solely on the basis of spectroscopic observations. For 750 of them
radial velocity curves have been obtained, making it possible to find the orbital periods
and the shape of the orbit.
According to modern theories of planet origin, they must form together with stars. Most stars, in the process of formation, should acquire several planets.
It is impossible to see planets through a telescope even around the nearest stars. Therefore
indirect methods must be used.
1. If we are located in the plane of a star's planetary system, we can observe the star being partially eclipsed by the planet. When a planet of the Jupiter
type passes across the star's disk, the brightness changes by 0.01 stellar magnitude. Such changes can be measured with modern electrophotometers. But if the plane of the
planet's orbit is oriented arbitrarily, no change in the star's brightness will occur.
2. Another method consists of observing small perturbations in the star's position, caused by the gravitational attraction of a sufficiently massive
planet. The star's motion would have a wave-like character. Calculations by O. Struve
showed that the deviation of proper motion from a straight line does not exceed 0.0005” per year, i.e., it lies beyond the accuracy of telescopes.
3. The spectroscopic method allows detection of periodic oscillations
of the component of the star's velocity along the line of sight. There will be intervals of time when the orbital velocity is directed along the line of sight toward us and away from us.
The period of oscillation of the radial velocities will equal the period of revolution of the planet.
Such vanishingly small changes in wavelength are impossible to measure.
All these effects are very small and lie at the limit of the capabilities of the best instruments. The situation could be changed by observations from an orbital telescope.
The infrared telescope IRAS, launched in 1983, obtained data on the existence of about 10 planetary systems in the process of formation,
located at distances of up to 100 light years from the Sun.
Radiation was detected coming from Vega, but 10 times greater than expected. Analysis of the infrared radiation showed that it comes from
a ring of dust particles orbiting the main star.
The distance from the ring to the center equals 85 AU, and the mass of the ring is 300 Earth masses.
The same telescope detected dust in the Orion Nebula, from which
planets may possibly be forming.
Observations from an orbital telescope can also be conducted in visible light.
A planet like Jupiter located at a distance of 10 pc would be visible as
a star of the 24th magnitude. Such an object could be detected with an orbital telescope.
Studies of Barnard's Star by van de Kamp showed that a low-mass invisible companion is located near it. Barnard's Star is located at a distance of 1.8 pc from us and moves very fast. Study of the trajectory of its motion
made it possible to detect the wave-like character of the star's motion. The period of oscillation of its proper motion equals 24 years. The companion is located at a distance of 4.4 AU. The companion's mass is 1.5 times greater than the mass of Jupiter.
According to current statistical estimates, about 10% of all Sun-type stars
have planetary systems.
In recent years several studies have been conducted with the Space
Telescope named after E. Hubble, which discovered planets near the nearest stars.
1. The deformed disk of the star β Pictoris indicates the presence of a
planet near it. (Observations of January 1995.)
This telescope image shows the inner region of a dust disk
350 billion km in diameter around the star β Pictoris. The disk is slightly deformed. This deformation may be caused by the presence of a planet. The star is located
at a distance of 50 light years and is somewhat hotter than the Sun.
(The upper part of the image is a visible light image of the disk. It consists of
microscopic icy and silicate dust grains, glowing with reflected
starlight. The lower part is false-colored to emphasize details
in the disk structure.)
2. The space telescope discovered many protoplanetary disks around forming stars in the Orion Nebula.
Using data from the space telescope, about 100 stars in the Orion Nebula were studied, and protoplanetary disks were found around about 56 of them.
HST clearly resolves a young star at the center of each dust disk. The mass of some of the disks has been measured. It is sufficient to form planets like Earth and, in several cases, exceeds Earth's mass several times over. The disks range in size from 2
to 8 times the size of our Solar System. The central red stars make up approximately 30% to 150% of the mass of our Sun.
The dust disks in the Orion Nebula may contain the same materials that make up the planets of the Solar System — carbon, silicates, and others.
These results allow us to conclude that the existence of planets is a general pattern and raise the probability of the existence of life beyond Earth.
The only confirmed planetary system to date consists of three Earth-like bodies orbiting a neutron
star located at a distance of 1,000 light years.
The stars in the Orion cluster are very young — less than a million years old,
so the planets have not had enough time to form.
Disks around young stars consist of 99% gas and 1% dust. Even this
small amount of dust is enough to make the disks opaque and
dark in visible radiation.
Before the Hubble survey, dust disks had been detected around only
four stars: β Pictoris, Alpha Lyrae, Alpha Piscis Austrini, and Epsilon Eridani.
These disks make up a portion of the mass of the disks in Orion and could be leftover material from the planet formation process.

Comments