
Lecture
In this lecture we will use many concepts at an intuitive level, without giving them precise definitions. Such concepts will be defined in subsequent lectures.
The multiple meanings of the English word "Intelligence" lead to ambiguity in the interpretation of the term "Business Intelligence" in both Russian and foreign literature devoted to the use of information technology for analytical support of business. The English word "Intelligence" means the ability to know and understand, readiness for comprehension, knowledge conveyed or acquired through learning, research or experience, an action or state in the process of cognition, intelligence gathering, or intelligence data. In Russian, the word "intellekt" means a person's mental faculty.
The term "Business Intelligence" became widespread when it was introduced by analysts at Gartner Group in the late 1980s as a "user-centric process that includes accessing and exploring information, analyzing it, and generating the intuition and understanding that lead to improved and informal decision-making". Although this term had earlier been used, for example, at IBM as an internal corporate term.
By 1996 the meaning of the term had been refined, and "Business Intelligence" came to be understood as "tools for data analysis, report building, and querying that can help business users navigate a sea of data in order to synthesize meaningful information from it".
In Russian-language literature, the term "Business Intelligence" is translated as "business intellect", "intelligent data analysis", "business awareness", or is simply introduced as the abbreviation BI. In this course we will use the terms "business awareness" and "business analytics" as synonyms.
However, there is currently still no single unambiguous definition of the term "business awareness" (BI). Let us note the following important aspects of how this term's content is interpreted.
Thus, in a broad sense, business awareness is understood as:
In today's world, a company's success in the marketplace depends directly on how quickly its management can recognize changes in market dynamics and how promptly it can respond to them in order to increase profit, given existing market realities. Company managers must track market trends, identify competitors and threats, assess risks, adapt company strategy, evaluate their resources, and so on. Information is a necessary production resource for making effective management decisions.
Companies have accumulated significant volumes of data and have access to even larger volumes of external data. Managers need this information to be transformed, pre-processed, and appropriately organized for quick access, analysis, and decision-making. This approach to data is, on the one hand, a way of creating competitive advantage, and, on the other hand, a requirement for publishing data to company managers. Publishing data for managers — providing rapid access to data, performing data analysis, and offering informational support for the decision-making process — is the primary goal of business analytics systems. Business analytics helps a company generate knowledge from all available information in order to make effective management decisions and turn those decisions into action.
Thus, information plays a key role in managing an organization as a whole and its individual production functions. The data available to managers and analysts directly from corporate information systems are not unified, are scattered, and are generally not ready for analysis. Business awareness or business analytics systems are the class of information systems that makes it possible to turn data from corporate information systems and data from external sources into information and knowledge useful for business and usable in management, on the basis of which decisions can be made.
The informational foundation for business analysis and business analytics systems is the data warehouse. The basic requirement for the data warehouse of a business analysis system is that it provide an information environment that is structured and organized to solve business problems. As a rule, such an environment is concisely represented in the form of an information pyramid, as shown in Fig. 4.1.
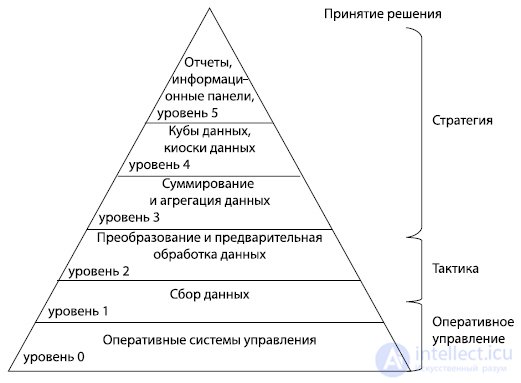
The information pyramid is formed from several levels.
The information pyramid describes the business analytics environment, which can be described as follows. Raw material — data — enters the business analytics information environment, and is then processed within automated systems and information products.
During processing, a transition occurs from data to information. The data warehouse (DW) extracts data from multiple transactional or operational systems, then integrates and stores the data in a specialized database. For example, a DW might reconcile and merge customer records from four operational systems (applications for order processing, service, sales, and supply). This process of extraction and integration turns data into a new information product — information.
Then users working with analytical tools (for example, to create queries, reports, perform OLAP analysis, and carry out data mining operations) access data from the DW and analyze it. In this way, trends, structures, and exceptions are identified. Analytical tools help users turn information into knowledge.
Let us now give a definition of business analytics systems, or business awareness systems.
The main functions of a business analytics system generally include the following.
The main technological tools for implementing business analytics system functionality include:
A business analytics system is the core around which streams of strategic business information are formed. This tool helps a company make decisions based on correct information received in a timely manner.
In conditions where the market is constantly changing and competition is becoming ever fiercer, it is critically important for executives to identify and analyze the reserves available to the enterprise that can significantly expand business capabilities.
Proposed solutions in the field of business analytics should provide the ability to promptly analyze market trends, understand the driving forces of the business, and, based on objective information, quickly respond to changes in the market situation and make the right decisions.
For example, one possible solution could be a graphical tool for economic analysis belonging to the category of OLAP applications (On-line Analytical Processing), which:
These multidimensional "information cubes" collect and store all information about an enterprise's activity. They can be used to model and analyze critical aspects of the business, taking into account information about products, suppliers, customers, turnover, prices, and revenue. Analysis is conducted interactively, in real time, using convenient visual tools, rather than simply relying on numerous reports with thousands of pages, tables, and numbers.
"Data cubes" must be configured to address a number of critical business aspects, including analysis of sales, inventory, finance, supply channels, and production.
Special capabilities should provide instant drill-down into data and comprehensive investigation of a problem. The resulting two- or three-dimensional representation is convenient for quickly studying trends and analyzing deviations.
A typical business analytics software package includes not only the system itself but also training materials, technical documentation, and the ability to obtain technical support and professional consultations. All of this helps users master the system quickly and thoroughly and get the most benefit from its use:
A business analytics system should:
Thus, business analytics systems make it possible to:
It should be noted that many companies do not attach importance to security issues, ignoring the fact that the architectural components of business analytics systems harbor certain dangers. Securing the business analytics environment is no less important a task than protecting operational applications.
The need to secure On-Line Transaction Processing (OLTP) systems is recognized by most companies. A particular feature of implementing this task for OLTP applications is that it is easily structured and static (specific applications access specific data in the same way each time). The circle of users is quite limited — these are employees with specific business functions who work with applications and data related only to their own area of activity. In addition, the physical structure of these applications also remains fairly constant. Tools and the underlying data structure change infrequently.
The business analytics and data warehouse environment, on the contrary, is characterized by considerable dynamism combined with a broad and frequently changing user base, where users can be either internal or external. In such a situation, it is much more difficult (and sometimes practically impossible) to partition users across data subsets; this is especially true for high-level analytical applications, such as, for example, corporate performance management solutions, where the final information is formed based on the study of data from the entire enterprise. In addition, the physical structure of this environment is often unclear: many different tools are installed in it, and the data itself is in constant motion (from the data warehouse to data marts and to user machines in dashboards). As a result, corporate information security measures bypass business analytics applications and the data warehouse.
In order to guarantee the security of the business analytics environment, companies must first address the security tasks that arise at the level of its individual components (see Fig. 4.2.).
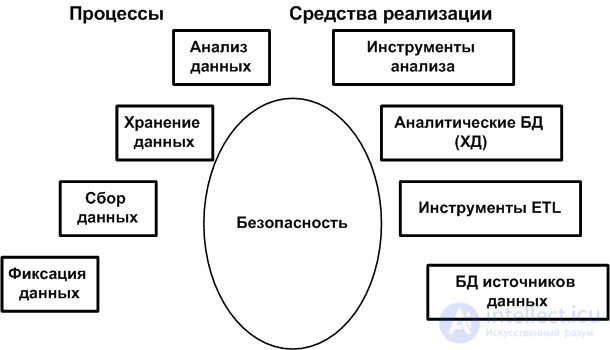
Each of the main components of the business analytics environment has its own degree of risk, and ensuring the security of each component requires implementing different approaches (and different technologies). This is an extremely difficult task, and perhaps the greatest complexity is presented by the "gaps" between components. After all, a business analytics software shell is practically never delivered by a single vendor or in the form of a single IT technology. At the same time, seamless integration between components is impossible. Moreover, it is precisely how the components work with one another, and how information flows between them, that creates "points of risk".
The very essence of business analytics pushes business users toward expanding their access to data and control over it. Therefore, a strict information protection policy is needed that should help "patch the holes" created by numerous, poorly integrated technological components, as well as minimize the enormous risk inherent in the human factor.
Data in the DW, data marts, and operational data stores create the conditions for carrying out all business analytics and, as a rule, include gigantic volumes of detailed, transactional data. Since they often reflect a lengthy period of time related to the company's history, such as, for example, financial information, ensuring the security of such data is extremely important. When considering data security tasks, the following questions should be asked:
The topology of data in the business analytics environment affects data access capabilities and security. In many companies, query results are often downloaded to individual machines for further drill-down and use. This data ends up in data marts, desktop databases, dashboards, or large-format spreadsheets and quickly finds itself outside the boundaries of the IT department's security infrastructure, although it continues to retain its confidential nature. When examining data topology from a security standpoint, the following questions need to be studied:
Typically, the process of collecting and preparing data for the business analytics environment is very complex and "fragile". A huge number of data sources and considerable data diversity lead to multi-stage processes in which data is interactively collected and transformed for loading into the DW. Data undergoing both the collection and transformation process also form the following "points of risk".
Business analytics software tools and analytical applications are, first and foremost, mechanisms designed to access data in the DW. Such tools were often purchased in large quantities for the purpose of a broad and deep enterprise-wide deployment of business analytics. These tools are of particular value only to certain users and pose a serious danger if they fall into the wrong hands.
The emergence and development of analytical applications for e-commerce under the "business-to-business" and "business-to-consumer" models have heightened the urgency of security issues.
Corporate information security policy often does not cover information that is stored, analyzed, and delivered through analytical applications. Since business analytics expands access to information, often placing it directly in the hands of business users, information quickly finds itself outside the boundaries of the IT department's security infrastructure. Therefore, when shaping corporate information security policy, the following questions must be considered:
The concept of multidimensional data representation assumes that data elements (factual information) are points in a multidimensional space, whose dimensions represent a meaningful description of such facts (a point of view on them). In applications for processing multidimensional data, all the problems of visualizing multidimensional data arrays remain. The most advanced, expensive, and elite solutions remain confined within their narrow subject niches.
End users have no intention of somehow advancing spreadsheets, at their own expense, into an interface with multidimensional databases. Of course, spreadsheets, thanks to their convenience and simplicity, are a favorite tool of end users. However, as experience shows, spreadsheets are only good when they are "tailored" to the multidimensionality of specific subject areas.
OLAP applications are often quite cumbersome; usually their cost-effectiveness corresponds to use within corporate working groups, for example in analytical departments. In general, effective use of OLAP solutions requires support from the corporate infrastructure.
As analysis shows, Web architectures are rapidly displacing traditional client-server applications for a whole range of software categories, and the market for corporate OLAP solutions is no exception here.
This direction is developing rapidly thanks to the emergence of various Web-OLAP tools based on HTML and Java technologies from well-known vendors and fast-growing new companies. Due to the expansion of the user base, Web-OLAP products are being developed to perform somewhat different analysis than traditional client-server tools. There is a transition from data exploration tools aimed at expert analysts to ready-made analytical applications accessible to a wider range of users.
Table 4.1 presents the criteria that determine the success of Web-OLAP products.
| Criterion | Description |
|---|---|
| Ease of use | A successful BI product must be simple enough for an inexperienced user with no special training |
| Interactivity | The software must implement interactive capabilities, including:
|
| Functionality | A Web-BI application must provide the same capabilities as traditional client-server counterparts, while also meeting additional requirements. SQL generation, execution of dynamic user-defined calculations, and various navigation methods — all of this is necessary on the Web as well |
| Availability and portability. | The main advantage of the Web is availability and portability. Information must be accessible from any device, any workstation, anywhere on the globe, regardless of whether the data is located at the company's head office, at remote offices, or on a portable device. The client side of an ideal BI product should be small, so as to accommodate the varying network bandwidth levels of different users, and should also conform to standardized technology |
| Architecture | Since the Web environment is fundamentally different from the traditional client-server environment, this gives rise to many new technological challenges. A multi-tier architecture that supports various types of clients (Java, HTML, etc.), as well as a "native" connection to the Web server (NSAPI, ISAPI) and the database server, is necessary for a corporate software product |
| Integration. Data source independence | The corporate computing environment contains various kinds of hardware and software resources, packaged applications, and databases. A well-designed BI application must provide access to static documents of any type (not only those it creates itself), as well as interactive access to relational and multidimensional databases, applications, and other sources |
| Performance and scalability | To ensure performance and scalability on the Web, the following capabilities must be implemented:
|
| Security | The ability to administer via the Web is one of the key advantages. For example, to change a specific user's permissions, the administrator does not need to go to that user's workstation. Using administration modules, profiles can be created for individual users or groups, granting access only to authorized information |
| Implementation and administration cost | The cost of implementing a Web-OLAP solution per user should be significantly lower than for traditional products. Since client support is a very complex task for traditional client-server products, Web solutions eliminate part of the overhead by not requiring special client software beyond a browser. Administration costs become significantly lower if:
|
The emergence of Data Mining is linked to a contradiction between the theoretical methods of applied statistics and the practice of solving real-world problems. Synonyms for this concept are knowledge discovery in databases and intelligent data analysis.
The stimulus for the development of Data Mining technology was the breakthrough in technologies for electronically storing large volumes of data — the activity of any enterprise is now accompanied by the registration and recording, on electronic media, of every detail of its operations.
It is obvious that without a technology for processing this stream of "raw data", the latter simply forms a large junk pile.
Requirements for the processing technology:
Traditional applied statistics cannot cope with these tasks. The main reason is that it works with fictitious, average values (the concept of averaging over a sample). Its methods are useful for testing hypotheses formulated in advance (verification-driven data mining) and for rough preliminary analysis, which forms the basis of OLAP (online analytical processing).
Data Mining technology (discovery-driven data mining) is based on the concept of templates (patterns) that reflect fragments of multifaceted relationships in the data. These patterns represent regularities characteristic of data subsamples that can be expressed in a form understandable to humans. The search for patterns is carried out using methods not limited by a priori assumptions about the structure of the sample or the type of distribution of the values of the indicators being analyzed.
It is clear that such patterns must be nontrivial (unexpected — unexpected regularities in the data that constitute so-called hidden knowledge).
There is an understanding that "raw" data contains a deep layer of knowledge, and it needs to be dug out.
Differences in how the tasks of on-line analytical processing and intelligent data analysis are formulated are shown in Table 4.2.
| OLAP | Data Mining |
|---|---|
| What are the average injury rates for smokers and non-smokers? | Are there precise patterns in the description of people prone to elevated injury rates? |
| What is the average ratio of phone bill sizes between existing customers and those of former customers? | Are there characteristic profiles of customers who appear likely to stop using telephone services? |
| What is the average value of daily purchases on stolen versus non-stolen cards? | Are there stereotypical purchase patterns in cases of credit card fraud? |
Main business applications of Data Mining
The need for automated intelligent data analysis became obvious, first and foremost, because of the enormous volumes of historical and newly collected information. It is difficult even to roughly estimate the amount of data accumulated daily by various companies and government, scientific, and medical organizations. According to research by GTE, scientific institutions alone collect around a terabyte of new data every day.
Another reason for the growing popularity of data mining is the objectivity of the results obtained. Unlike a machine, a human analyst always carries some degree of subjectivity: to one extent or another, they are a hostage to preconceived notions. Sometimes this is useful, but more often it does considerable harm.
And finally, data mining is cheaper. It turns out to be more cost-effective to invest money in data mining solutions than to permanently maintain an entire army of highly qualified and expensive professional statisticians. Data mining does not eliminate the human role entirely, but it greatly simplifies the process of discovering knowledge, making it accessible to a much wider circle of analysts who are not specialists in statistics, mathematics, or programming.
The tasks of any business intelligence system are the efficient storage, processing, and analysis of data. Considerable experience has now been accumulated in this area.
Efficient information storage is achieved through the presence, within the business intelligence system, of a whole range of data sources. Data processing and consolidation is achieved by applying data extraction, transformation, and loading tools. Data analysis is carried out using modern business analysis tools.
The architecture of a modern organizational business intelligence system is presented in generalized form in Fig. 4.3.
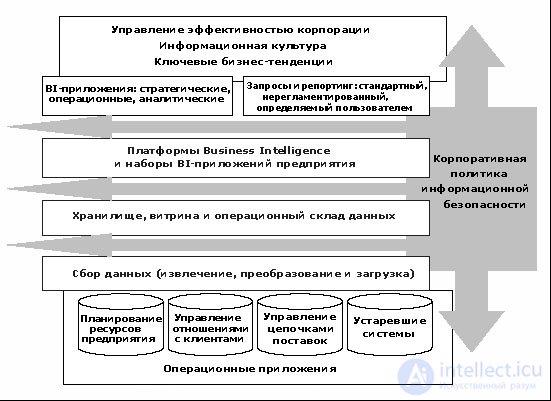
The architecture shown demonstrates the long path that data travels before it reaches the analyst's desk.
The diversity of data sources and the need to use each of them in a specific case is explained by the need to store information differently depending on the tasks facing the organization. If we try to classify data sources by type and purpose, each of them can conditionally be assigned to one of three groups: transactional data sources, data warehouses (DW), data marts, and dashboards.
Data can be entered into the system either manually or automatically. At the stage of initial capture, data enters so-called transactional databases through information collection and processing systems. An organization may have several transactional databases.
Since transactional data sources are, as a rule, not consistent with one another, analyzing such data requires their consolidation and transformation. Therefore, at the next stage, the task of data consolidation, transformation, and cleansing is solved, as a result of which the data enters so-called analytical databases. Analytical databases, whether a data warehouse or data marts, are the primary sources from which the analyst draws information, using the appropriate business analysis tools.
At the same time, the business intelligence system of a medium-sized or large enterprise or organization must provide users with access to analytical information that is protected from
продолжение следует...
Часть 1 Business Intelligence systems and data warehouses
Часть 2 The Microsoft Solution - Business Intelligence systems and data warehouses
Часть 3 Summary - Business Intelligence systems and data warehouses

Comments