
Lecture
Это продолжение увлекательной статьи про системы деловой осведомленности.
...
unauthorized use and open both through the organization's internal network and to users of intranets and the Internet. Thus, the architecture of a modern business intelligence system is multi-tiered and includes the following levels:
Let us examine the listed levels of the architecture and look at examples of typical tools that can serve as the basis for building each of them.
The first level of the business intelligence system architecture consists of the previously mentioned data sources, usually referred to as transactional or operational data sources (databases), which are part of so-called OLTP systems (online transactional processing). Transactional databases include data sources oriented toward recording the results of the organization's day-to-day activities. The requirements placed on transactional databases have given rise to the following distinctive features: the ability to process data quickly and support a high frequency of change, and, as a rule, an orientation toward serving a single process rather than the organization's activities as a whole.
Examples here include databases used in billing systems by mobile network operators, in automated banking systems of commercial and government banks, and in online stores.
Information in such databases is oriented toward a specific application and is managed by transactions; it is highly detailed and is frequently updated.
Transactional databases handle the flood of day-to-day information that must be routinely processed every day extremely well, but they do not provide an overall picture of the state of affairs in the organization as a whole and can rarely serve as sources for comprehensive analysis.
Thus, the collection of transactional data sources forms the bottom tier of the business intelligence system architecture of any organization. Going forward, we will assume that such an enterprise system is built on the basis of already existing data collection and primary processing systems, including transactional data sources.
The process of extracting, transforming, and loading data is supported by so-called ETL tools (extraction, transformation, loading), designed to extract data from various lower-level transactional sources, transform and consolidate it, and load it into target analytical databases — the data warehouse and data marts. At the transformation stage, data redundancy is eliminated, and the necessary calculations and aggregation of data are performed. The three-stage process of extraction, transformation, and loading must be carried out according to an established schedule.
The third level of the business intelligence system architecture consists of data sources called the DW (Data Warehouse). A data warehouse includes data sources oriented toward the storage and analysis of information. Such sources can combine information from several transactional systems and allow it to be analyzed comprehensively using modern business analysis software tools.
Recall that, by definition, a data warehouse is a subject-oriented, integrated, non-volatile, time-variant collection of data intended to support management decision-making.
Characteristic features of a data warehouse: relatively infrequent updating of most data, data refreshes on a periodic basis, and a unified approach to naming and storing data regardless of how it is organized in the source systems.
The data warehouse, being one of the main links in the business intelligence architecture of any medium or large organization, serves as the primary data source for a comprehensive analysis of all information available within the organization.
The fourth level of the business intelligence system architecture consists of data sources called data marts, intended for conducting targeted business analysis. Data marts are usually built on the basis of information from the data warehouse, but can also be formed from data taken directly from transactional systems when a data warehouse has not been implemented in the organization for some reason.
By type of information storage, data marts are divided into relational and multidimensional. Marts of the first type are organized as a relational database with a "star" schema, where the central table, the fact table, intended mainly for storing quantitative information, is linked to dimension (lookup) tables.
Multidimensional data marts are organized as multidimensional OLAP databases (Online Analytical Processing), where reference information is represented as dimensions, and quantitative information is represented as measures (metrics). Information in a multidimensional data mart is presented in business terms in a form maximally accessible to end users, which significantly reduces the time needed to obtain the information required for decision-making.
From a user's point of view, the difference between data marts and a data warehouse is that the data warehouse corresponds to the level of the entire organization, while each data mart typically serves a level no higher than a single department and sometimes may be created for individual use, having a fairly narrow, targeted specialization.
The difference between data marts and transactional databases is that the former serve the needs of end users who are not professional programmers — analysts and managers at various levels solving various business problems. Transactional databases, on the other hand, are used mainly by operators responsible for entering and processing primary information, rather than for its analysis aimed at supporting decision-making.
The use of data marts, both multidimensional and relational, combined with modern business analysis tools, makes it possible to turn mere data into useful information on the basis of which effective decisions can be made.
The next level of the organizational business intelligence system architecture consists of modern software tools known as intelligent or business data analysis tools (Business Intelligence Tools), or BI tools.
BI tools allow an organization's management to conduct comprehensive analysis of information, help them successfully navigate large volumes of data, analyze information, draw objective conclusions based on that analysis, make well-founded decisions, and build forecasts, reducing the risk of making incorrect decisions to an acceptable minimum.
Data mining tools are used by end users to access information, visualize it, perform multidimensional analysis, and generate both predefined reports (in form and content) and ad hoc reports created by a manager or analyst (without a programmer). As already mentioned, the input for business analysis is not so much "raw" data from transactional systems as data that has already been processed and stored in the warehouse or presented in data marts.
Today, Russian companies, following the lead of their Western counterparts, are increasingly implementing various internet technologies. Already, more and more specialists — and not only those working in information technology — are beginning to understand the benefit of using these solutions to improve the efficiency of their business. Conducting data mining using software solutions not only in a local environment but also in intranet and internet environments opens up new opportunities for analysts to work with data.
Current trends in the development of business intelligence system architecture are based on the use of internet technologies. The traditional form of business intelligence system architecture has, in the recent past, been supplemented by a web portal, which is gradually acquiring an ever more significant role in its architecture. The ability to access information through a familiar web browser makes it possible to save on the costs associated with purchasing and supporting desktop analytical applications for a large number of client workstations. Implementing a web portal makes it possible to supply analytical information both to users inside the office and to mobile analyst users anywhere in the world who are connected to the portal via the Internet.
Today, the information technology market offers a wide range of tools designed for the rapid implementation of business intelligence system architecture components. Using such tools makes it possible to avoid developing analytical applications from scratch and instead take advantage of ready-made modern technologies, thereby reducing the time and cost of their creation.
Solving the task of supplying users with information within a business intelligence system is determined mainly by the correct choice of business analysis tools. But the choice of tools to support the processes of data extraction, transformation, loading, and storage is also important.
When implementing an enterprise business intelligence system, software solutions from different vendors (mixed solutions) or from a single vendor (platform-based solutions) can be used. Both the first and second approaches have their advantages and disadvantages. Therefore, choosing the tools for implementing a business intelligence system architecture, despite their diversity, – is not a simple task.
There is no single vendor on the market offering the best solutions for all the software components required to build a business intelligence system. Therefore, combining the most suitable solutions from various vendors makes it possible to increase the functional power of the business intelligence system. Criteria for evaluating tools may include their technical and cost characteristics, as well as the speed of implementation and their suitability for use in each specific case.
However, using products from different vendors leads to a significant increase in system architecture complexity due to the heterogeneity of the tooling solutions. This complexity is explained by the need to integrate tooling solutions that are not connected to one another. In addition, administering the system turns out to be a non-trivial task, given the inconsistency of data and metadata managed by separate, unrelated modules of platforms from different vendors.
When implementing a business intelligence system architecture from a single vendor (in the terminology of the Gartner research center, a platform-based solution), the solution must be sought among vendors of so-called BI platforms (Business Intelligence Platforms).
This segment of the information technology market is represented by more than 20 companies, such as (in alphabetical order): AlphaBlox, Arcplan, CA, Comshare, Crystal, Hyperion, Info Builders, Microsoft, Microstrategy, Oracle, PeopleSoft, ProClarity, Sagent, SAP, SAS, Whitelight, and others. Among them, the following seven leaders and contenders for leadership in this field stand out: Microsoft, SAS, Oracle, SAP, PeopleSoft, Info Builders, Hyperion
Two of the listed vendors, Microsoft and Oracle, are able to implement all levels of a business intelligence system entirely on their own, without resorting to third-party tools. The decisive criterion that sets these vendors apart is having their own DBMS.
Let us look at an example of implementing an organization's business intelligence system using Microsoft tools.
Microsoft offers a comprehensive set of business intelligence (BI) tools built on a scalable platform for building a data warehouse, analyzing data, and generating reports. These simple and powerful tools allow end users to access and analyze business information. The foundation of Microsoft's comprehensive BI offering is the SQL Server 2008 DBMS — a full-featured data services platform that makes it possible to:
Table 4.3 provides a description of the SQL Server 2008 technologies that form the foundation of a powerful BI toolset
| Component | Description |
|---|---|
| SQL Server DBMS | A scalable, high-performance engine for storing large volumes of data. SQL Server is suitable for consolidating all of an enterprise's business data in a central data warehouse for analysis and reporting |
| SQL Server Integration Services | A comprehensive extraction, transformation, and loading (ETL) platform that populates the data warehouse and keeps it synchronized with data from the heterogeneous sources used by the business applications employed within the organization |
| SQL Server Analysis Services | An analytical engine for implementing OLAP solutions (Online Analytical Processing): aggregating business metrics from multiple dimension tables and building data mining solutions that use specialized algorithms to reveal patterns, trends, and relationships in business information |
| SQL Server Reporting Services | A reporting solution that makes it easy to create, publish, and distribute detailed business reports both within the enterprise and beyond it |
SQL Server 2008 is not only a comprehensive BI platform, but is also tightly integrated with office solutions such as the 2007 Microsoft Office System, which makes this platform accessible to all employees of the enterprise and allows them to obtain insights that serve as the basis for effective action.
SQL Server 2008 supports two typical approaches to unifying business data for analysis and reporting.
To ensure the highest possible performance and correct operation, SQL Server 2008 includes development environment features that help create effective analytical solutions. These include:
Report generation is an important element of any BI solution; business users increasingly require ever more sophisticated reports. SQL Server Reporting Services includes a number of tools that facilitate the creation of reporting solutions:
In addition, SQL Server 2008 Reporting Services incorporates substantial improvements in terms of increasing performance and the flexibility of report formatting and publishing.
The advantage of OLAP is that, with instant access to accurate information, end users can immediately get answers even to the most complex questions. That is why, when developing every version of SQL Server Analysis Services, the goal was to continuously reduce query processing time and increase the speed of data updates. Naturally, the creators of SQL Server 2008 Analysis Services pursued the same goals.
Analysis Services in SQL Server 2008 provides broader analytical capabilities, including complex calculations and aggregation. Enterprise-level performance is achieved through:
The advantage of SQL Server 2008 in the BI solutions market is based on a scalable infrastructure that enables information technology to make possible enterprise-wide business analysis and access to analysis results wherever users need them. SQL Server 2008 provides significant progress in data warehousing by delivering a comprehensive, scalable platform with which organizations can integrate data into a data warehouse and manage it faster, delivering analysis results to all users. Thanks to its higher scalability, the SQL Server 2008 BI infrastructure is capable of generating reports of any size and complexity, managing them, and making reports available to users through tight integration with Microsoft Office. In addition, SQL Server 2008 demonstrates higher performance in areas such as data warehouse maintenance, report generation, and analysis.
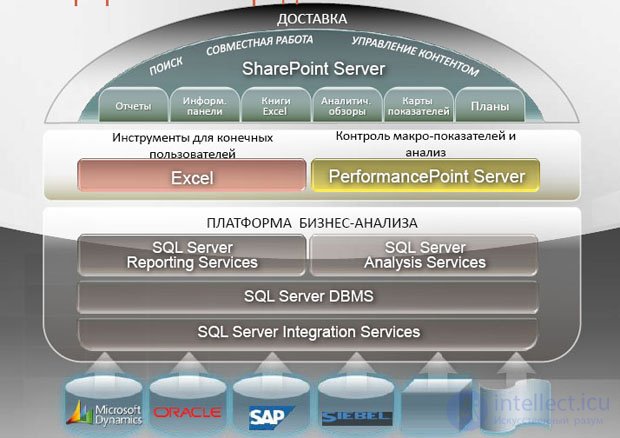
The overall architecture of Microsoft's business intelligence system solution is shown in Fig. 4.4.
enlarge image
Fig. 4.4. Microsoft business intelligence system solution
Information technologies provide support for the data-processing technology chain:
Data acquisition is provided by automated operational data processing systems, or transactional data processing systems. The primary purpose of such systems is to provide a well-developed form of data record-keeping at the lower level of the organization's business processes. The users of these systems are specialists.
In order to use the collected data for analysis, it must be brought to a single format, transformed, reconciled, and pre-processed. This task is intended to be solved by extraction, transformation, and loading systems. This is an important link in the transition to data analysis.
Data delivery is provided by information-analytical data processing systems. Such systems are developed using data warehouse technology and business intelligence methods. The primary purpose of such systems is to provide a well-developed form of data publication. Their users are managers.
Every manager has been trained in analytical work, used a computer during their schooling and university education, is surrounded by computers in their day-to-day work, and requires data for decision-making.
Publishing data for managers is a top-priority task. It is well known that publication is successful if it satisfies the needs of its readers. Timely, and as complete as possible, publication of data provides an environment that supports decision-making.
For a manager, it is important that the publication be:
Let us examine the set of problems and their possible solutions that one encounters when building business intelligence systems1.
The first problem in creating business intelligence systems is that the data needed for decision-making turns out to be unavailable in the data warehouse. If the required data is unavailable in the data warehouse, this shortfall needs to be made up by gathering business requirements from end users; studying what information business users need in the decision-making process; holding regular discussions with decision-makers to understand new requirements; and systematically investigating new data sources and metrics.
In connection with this problem, Ralph Kimball notes that building a corporate data warehouse should not be treated as a project that has a beginning and an end. In reality, building a data warehouse for a business intelligence system is a continuous process that can only end when the effort to build the data warehouse is abandoned.
Let us also note that a number of researchers in the field of data warehouse building have repeatedly pointed out this fact. The reason for this view is most likely a simple circumstance: in today's economic conditions, the business environment can change very quickly and dynamically, which significantly affects data needs.
The second problem in creating business intelligence systems is a lack of partnership between end users and IT specialists. Symptoms of this problem include end-user frustration with the current level of service; IT specialists condemning end users for their complaints, computer illiteracy, and disregard for reading documentation; and underestimation by the organization's management of the use of modern IT.
As a result, the data warehouse fails to meet users' needs or works too slowly, and in fact is not used by users at all. At the same time, there are no administrative decisions aimed at reaching agreement and correcting the situation.
The general idea for solving this problem: IT staff need to live among business users in order to better understand the specifics of the company's business and the needs of its customers, and to earn the trust of end users.
Experience shows that this problem tends to arise because IT specialists, when developing automated systems, fail to comply with the requirements of the relevant standards (GOSTs) and do not pay sufficient attention to developing the linguistic and organizational support for the system.
The third problem in creating business intelligence systems is the absence of an explicit cognitive and conceptual model of end users. A symptom of this problem is IT specialists choosing tools based on conversations with potential vendors and familiarity with demo versions, without regard to users' actual needs.
IT specialists sometimes gravitate toward complex solutions and assume that end users enjoy working on computers. But users earn their living by solving the tasks in front of them, and they may well view the computer merely as a means that helps them solve those tasks. Learning and mastering new software products is not their primary job function. Before new software products appeared in the organization, business users managed to solve their tasks without them.
As a solution, it is suggested to clarify the level of cognitive and computer literacy of end users; build a conceptual model of user behavior when solving tasks and making decisions; and select or configure information-delivery tools that best match the characteristics of end users.
The simplest approach is to divide users into two categories – those who use Excel, and those who consider spreadsheets too complicated. For the first category, the ability to formulate ad hoc queries should be provided, while the second should be given pre-built, possibly parameterized, reports.
Ralph Kimball proposes a simple model for evaluating the complexity of software tools:
The rule for applying this model is very simple. It is based on two logical premises: "Every click is a sub-goal on the way to achieving a goal" and "Every click is a distraction, like an unexpected phone call." From this follows the empirical rule: "1-3 clicks – good; 4-8 clicks – acceptable; more than 8 clicks – failure."
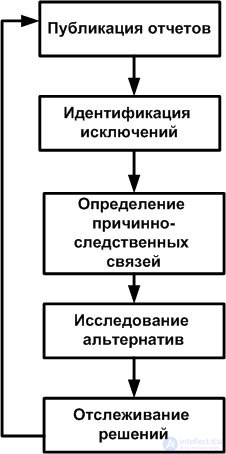
Fig. 4.5 shows a simple model of using a data warehouse in business intelligence systems for decision-making.
As the figure shows, the model reflects the following business decision-making processes:
The fourth problem in building business intelligence systems is the delay in the data required for decision-making. The symptom is a need for real-time data. Here, "real-time" requirements refer to any requirements on the timing characteristics of data that the current ETL procedure cannot satisfy.
One possible solution is to modify the ETL (Extraction, Transformation, Loading) procedure by using ready-made data extraction tools, such as EAI (Enterprise Application Integration) messages. To quickly satisfy user needs, "hot" partitions of the fact table can be linked to the static data warehouse without waiting for the dimension tables to be updated.
The fifth problem in building business intelligence systems is that facts and dimensions that have not been brought to a common form hinder the integration of enterprise data. Top managers need a comprehensive view of the data, but this is impossible to obtain because data is represented differently across different departments. The proposed solution is to use a bus matrix when designing data marts to align the data. As Ralph Kimball emphasizes, this solution is not so much a technical one as an organizational one.
The sixth problem in building business intelligence systems is insufficient detail (granularity) of data, which results in an unexpressive business intelligence system. The symptom is an insufficient number of attributes in the dimension data. The recommendation is to constantly strive to increase the expressiveness of the data, and to use auxiliary data sources to create meaningful data context.
The seventh problem in building business intelligence systems is inconvenient data formats. According to Ralph Kimball, the normalized form of relational data is inconvenient. Symptoms of the problem can also include user confusion and intimidation, difficulty formulating queries, complex ETL procedures, and the need for specialized hardware to achieve the required performance.
One possible solution is to represent the data in a multidimensional model. This representation matches user intuition, makes formulating queries easier, simplifies the ETL procedure, and makes it possible to achieve the required level of performance on ordinary hardware.
The eighth problem in building business intelligence systems is that data delivery to end users is too slow. Data does not arrive in real time, users are wary of running slow queries, and there are quantitative limits on data usage.
The solution to this problem is careful database design, building multidimensional data models, selecting quality DBMS software with advanced indexing mechanisms, equipping computers with large amounts of main memory, using parallelization, and using computers with fast central processors.
The ninth problem in building business intelligence systems shows up in the fact that some data ends up "locked" inside some application and cannot easily be moved from there to another application. The way out is to use only applications from which data can be copied to a spreadsheet via the clipboard with a single mouse click.
The tenth problem in building business intelligence systems is related to poor data quality. Symptoms of the problem include a lack of meaningful data, the presence of unreliable or nonsensical data, and the presence of duplicate or inconsistent records (most often such records relate to the company's customers). The proposed solution is to extend the ETL tools used with a system of data quality screens. In the multidimensional data model, an Error Event Schema — a fact table with its own dimensions — is created to record data errors. Based on this table, data audit dimensions are generated for other fact tables, and these dimensions can be used when generating reports that take unreliable data into account.
The eleventh problem in building business intelligence systems is the premature aggregation of data. Having aggregated data in the multidimensional model without corresponding atomic data makes it impossible to drill down into the data. The recommended solution is to support physical storage structures containing atomic data for the data marts. Drill-down is supported through aggregate navigation.
Ralph Kimball considers the twelfth problem in building business intelligence systems to be getting distracted by evaluating the return on investment (ROI) of the data warehouse. Symptoms of this problem include calculating ROI figures before the data warehouse is built, using standard methods based on payback period, net present value, internal rate of return, the balanced scorecard, and economic value added. In his opinion, all these methods miss the essential meaning of the cost and, ultimately, the value of the data warehouse.
The data warehouse supports decision-making. It is recommended that, after a decision is made, part of the resulting profit be credited to the data warehouse's account and then compared with the cost of the data warehouse. Ralph Kimball recommends assuming that 20% of the profit obtained as a result of a decision is due to the use of the data warehouse. This approach is consistent with the idea that the only meaningful way to evaluate the effectiveness of a data warehouse is to evaluate its ability to support decision-making by end users.
The thirteenth problem in building business intelligence systems is spending effort and time on building an enterprise data model. The symptom is the appearance of a large number of entities that are never populated with real data. Ralph Kimball believes that the effort spent developing an enterprise data model only delays work on the data warehouse, and the expectation is that errors and data inconsistencies will be revealed during the ETL procedure.
It should be noted that the decision to develop an enterprise data model does indeed require a great deal of intellectual effort and time to create. It may turn out that the model becomes outdated by the time it is put into operation. IT researchers propose various approaches to creating an up-to-date enterprise model.
Ralph Kimball considers the fourteenth problem in building business intelligence systems to be the possible requirement to use all data sources to populate the data warehouse. According to his experience, if a requirement is put forward during data warehouse construction to use three or more data sources, then the data warehouse will not be up and running even two years later. At the first stage of building a data warehouse, it is recommended to spend six weeks on a thorough data audit, and then select a single data source that, first, affects the most important decisions of end users, and second, is the easiest to connect to the ETL procedure. After the data warehouse is populated from the first source, the result obtained should be evaluated and the next steps considered.
One of the main purposes of a business intelligence system is to publish data in a format convenient for decision-making, and to provide organization leaders with simple and convenient tools for manipulating this data for the purpose of exploring and analyzing it.
продолжение следует...
Часть 1 Business Intelligence systems and data warehouses
Часть 2 The Microsoft Solution - Business Intelligence systems and data warehouses
Часть 3 Summary - Business Intelligence systems and data warehouses

Comments