
Lecture
To make a DW work, it is not enough simply to provide interaction among many data sources – that interaction must be carefully planned. That is why the processes of extracting, transforming, and loading data play an important role in building and operating a DW.
For the data transformation process to run smoothly, the necessary documentation and metadata must be in place. The data extraction process affects the performance of other systems, so it should be treated as part of change and configuration management for the source systems.
The abbreviation ETL (extraction, transformation, loading — извлечение, преобразование и загрузка данных ) refers to the composite process of transferring data from one application or automated information system to another.
The ETL process is implemented either by developing an ETL application, by building a set of built-in software procedures, or by using ETL tooling. ETL applications extract information from the source databases, convert it into a format supported by the target database, and then load the transformed data into that database.
The goal of any ETL application is to deliver data from external systems to the system users are working with, in a timely fashion. As a rule, ETL applications are used when transferring data from external sources into the DW of a business intelligence system. Therefore, organizing the ETL process is an integral part of the development project for practically any DW.
Designing and developing the ETL process is one of the most important tasks facing the DW architect. For a DW, the ETL process has the following properties. First, the volume of data selected from the source systems and placed into the DW is, as a rule, fairly large – up to tens of gigabytes. Second, the ETL process is a necessary part of DW operation. The frequency of the ETL process is determined not only by the user's need for timely data, but also by the size of the data batch being loaded. According to expert estimates, the ETL process can take up to 80% of the time. Third, at various stages of the ETL process the DW metadata is formed and data quality is ensured. Fourth, data can be lost during the ETL process, so it is necessary to monitor the data arriving in the DW. Fifth, the ETL process has the property of being recoverable after failures without data loss.
Fig. 15.1 shows the place of the ETL process within the architecture of a DW-based business intelligence system.
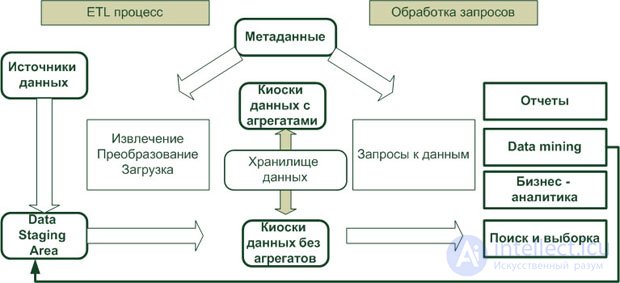
As the figure shows, the ETL process is responsible for the whole job of preparing data for delivery to the DW, generating and updating the DW metadata, as well as managing data extracted as a result of data mining.
Thus, the ETL process consists of three main stages.
There are several approaches to implementing the ETL process. The generally accepted approach consists in extracting data from the source systems, placing it in an intermediate disk storage area (Data Staging Area), performing the transformation and cleansing procedures on the data in that staging area, and then loading the data into the DW, as shown in Fig. 15.2.
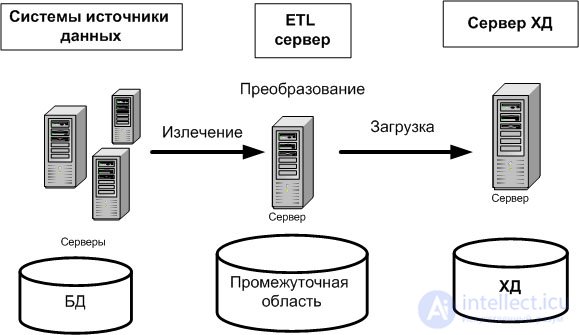
Placing extracted data in the staging area means writing the data to a database or to files on the disk subsystem. An alternative approach to implementing the ETL process is to perform the transformations in the ETL server's RAM and load the data directly into the DW, as shown in Fig. 15.3.
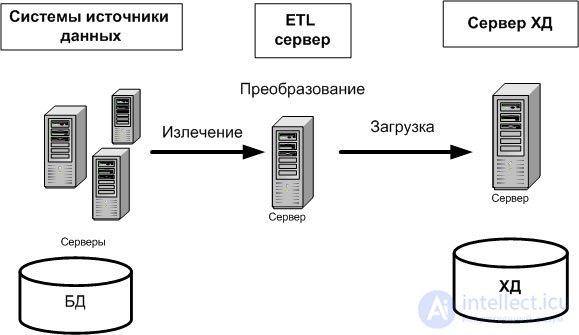
Transforming data in RAM is faster than first placing it on disk. However, the use of this approach is limited by the size of the data batch being loaded. If the size of the batch being loaded is large enough, a staging area must be used.
Sometimes yet another approach to implementing the ETL process is used, in which data transformation is performed on the DW server itself, during the loading process. Use of this approach is determined by the computational capacity of the DW server. This approach is typically used for MPP DW servers.
Depending on who extracts data from the source systems, ETL process implementation can be carried out in the following ways.
Depending on where the process of extracting data from the source systems is performed, ETL process implementation can be carried out in the following ways.
Thus, when designing the ETL process, the DW architect must, based on an analysis of the DW's operational requirements and jointly with the IT project manager, select a hardware and software solution for implementing the ETL process – that is, precisely determine where and by what method the ETL process will be executed. This decision can be strongly influenced by the project budget. For example, there may not be enough funds to implement the ETL process on a dedicated server.
As a rule, the following sequence of actions is followed when constructing the ETL process for a DW.
The data transformation process plays a very important role in the success of a DW project, so it must be well planned. Developing the plan is an iterative process.
First, a generalized plan is created, which reflects the list of source systems and specifies the planned target data domains (the data that will be placed into the DW). The source of the target data is determined based on the formulated business requirements for the DW. As a rule, data sources vary substantially – from databases and text files to SMS messages. This can significantly complicate the data transformation task.
Such high-level descriptions of the sources give developers, on one hand, a picture of both the system being built and the existing data sources, and on the other hand give the organization's management an understanding of the complexity involved in the data transformation processes.
It is best to start drawing up the generalized plan once the DW's multidimensional model has been developed. Then, for each table in the multidimensional schema, the source data tables can be identified.
Let us consider an example of a multidimensional schema of a DW for a decision support system, shown in Fig. 15.4.
The relationships between the tables of the DW's multidimensional schema and the source data tables can be shown using arrows, as in the diagram in Fig. 15.5.
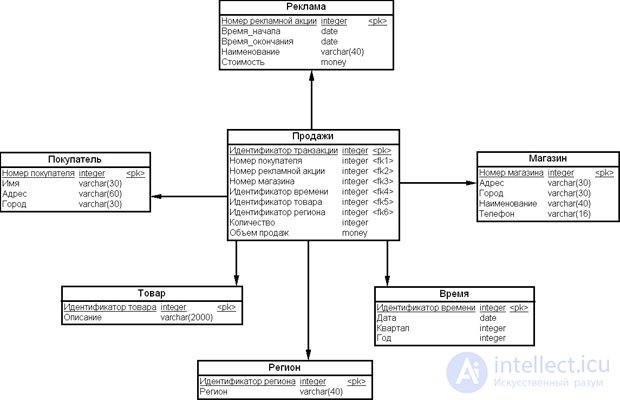
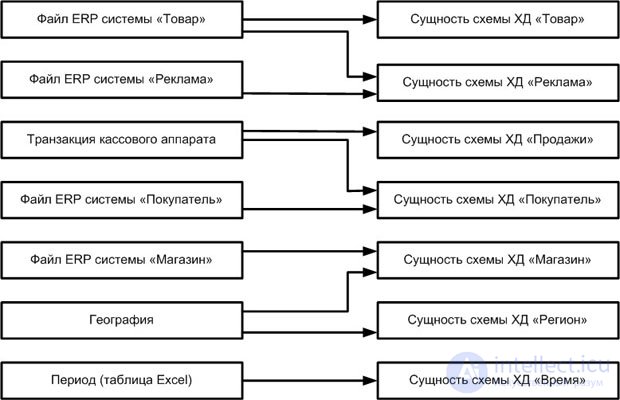
Each arrow on the diagram should be numbered and accompanied by a comment that should remind developers to keep track of referential data integrity or other processing features of each source table as dictated by business rules.
At this planning stage, all discovered discrepancies in data definitions and coding schemes must be recorded.
Detailed planning of the ETL process largely depends on which ETL tools are chosen. To date, quite a number of such tools have been developed, both by vendors of comprehensive DW solutions (IBM, Oracle, Microsoft) and by third-party software vendors (Sunopsis). Therefore, the task of choosing suitable ETL tools must be resolved before detailed planning begins.
Software of this class is designed for extracting, converting to a common format, transforming, cleansing, and loading data into the warehouse. There are two approaches to writing ETL procedures: 1) writing them by hand; 2) using specialized ETL tools.
Each approach has a number of advantages and disadvantages, so the choice of one method or another for implementing ETL procedures is determined by the requirements of the data loading subsystem in each specific case. Let us highlight the most important advantages of each way of writing ETL procedures.
Writing by hand:
Using ETL tools:
Special attention should be paid to the choice of technology for implementing ETL procedures if one of the source systems is an ERP system. Systems of this class are among the most complex, since they have a very convoluted data model and often contain tens of thousands of tables. To implement procedures for loading data from ERP systems, the development team should include a specialist who is well familiar with that particular source system, since analyzing such systems from scratch takes too long. In addition, most ETL tool vendors provide connectors to many ERP systems, which make it possible to import ERP system metadata and work with it at a higher level. Having connectors to ERP systems gives specialized ETL tools a major advantage over hand-written data-loading procedures when the data source is an ERP system.
After preliminary planning is completed, detailed planning begins.
Detailed data transformation plans are drawn up for all tables participating in the transformation process.
In this lecture we do not give recommendations for drawing up a detailed plan, since in each specific case detailed planning is carried out by the DW project manager and takes into account various factors related to the specifics of the DW's subject domain. For example, for banking DWs it may be necessary to verify the correctness of the accounting base against business rules (calculating, during the ETL process, the balances and turnovers for individual personal and/or balance-sheet accounts).
For DW dimension tables that will not change over time, the first main task in developing the ETL process is choosing the table's primary key. The key is chosen by the DW architect based on an analysis of the data sources.
The second main task is checking for the presence of "one-to-one" and "one-to-many" relationships in the dimension. As a rule, sorting is used for this check.
Next, changing dimensions should be considered, the type of change determined, and procedures for working with such dimensions described.
Dimension tables are loaded either by overwriting the dimension table entirely (for small tables), or only the changes in the dimension table's data are loaded.
When constructing the process for populating fact tables, the architect solves the following main tasks:
There are two types of fact table loading processes: initial loading and periodic loading of changes.
The problems associated with initial loading are that there is a high probability you will not obtain correct historical data because of the large data volumes. It is therefore important to assess which type of loading is best suited to which fact table.
Note that during the ETL process, dimension tables must be updated before fact tables are updated, since the relevant dimension table rows must already be in place for the new facts being loaded.
Data sources for a DW can be divided into the following main types.
Note that the data extraction strategy depends heavily on the type of data source.
The goal of the data extraction process is to quickly extract relevant data from the data sources.
The process of extracting data from data sources can be divided into the following main types:
The data extraction process can run daily, weekly, or, in rare cases, monthly. Note that there is an entire class of business intelligence systems that require data extraction in real time: for example, systems that analyze exchange trading operations (every second), or systems in the telecommunications field.
The data extraction process can be performed either in the environment of the operational data processing systems (sources), or in the DW's operating environment.
The process of transforming source data includes the following main actions.
As a rule, source data does not have the required level of data quality. Note that data in the DW must be:
To ensure quality, the data is subjected to a cleansing procedure during transformation. The data cleansing procedure is necessary because business intelligence systems cannot work with inconsistent and inaccurate data – otherwise business analysis becomes meaningless.
The data cleansing procedure includes reconciling data formats, encoding data, excluding unneeded attributes (for example, comments), replacing codes with values (for example, replacing a postal code with the name of a locality), combining data from various sources under a common key (for example, gathering all data about customers), and detecting identically named attributes that contain values that differ in meaning.
Data cleansing can be divided into the following types:
Cleansing procedures also include creating fact status flags in dimension tables (normal, abnormal, impossible, out of bounds, subject to analysis or not, etc.), recognizing random and noisy values (replacing them with a NULL value or an estimate), unifying the use of NULL values, flagging facts whose status has changed (for example, a customer cancelled a contract), aggregating facts, and so on.
The main goal of the data loading process is to load data into the DW quickly. Let us note some features of performing the data loading process into a DW.
First, loading data using SQL update commands is slow. Each SQL command is executed by the DBMS according to a particular execution plan, and its processing involves several phases. Therefore, loading with the DBMS's built-in import/export tools is preferable.
Second, table indexes load slowly. In many cases it is worthwhile to drop the index and rebuild it afterward.
Third, parallelism should be exploited to the maximum extent possible when loading data. Dimensions can be loaded at the same time as facts and table partitions. Likewise, facts and table partitions can be loaded at the same time as dimensions.
It should be noted that referential data integrity must be guaranteed when loading data, and aggregates must be built and loaded at the same time as the detailed data.
Tuning the performance of data loading into the DW is performed by the DW administrator using a set of procedures provided by the DBMS in use.
Thus, we have looked in general terms at the main elements of the ETL process. Now let us examine how to design ETL processes.
In an organization's computer systems, information is stored in various databases of operational data processing systems, corporate applications, and DWs. To use this information it must be systematized. Systematizing the information leads to solving the tasks of combining information from various sources and converting it to a single format for producing corporate reporting and data mining.
Two technologies are used to solve the task described above – ETL process technology and data integration process technology, or EII (Enterprise Information Integration) process technology.
As already noted in this lecture, ETL is a data warehousing process that performs three functions within a single software environment: reading data from designated sources (extraction), converting the data according to accepted conventions (transformation), and writing the transformed data to the target source (loading).
EII combines raw data by managing and orchestrating queries to various systems without pre-aggregating the content. The resulting data is, as a rule, not placed into storage in any database or DW.
CASE tools provide a graphical environment for modeling and documenting ETL and EII processes. In the PowerDesigner CASE tool, this is done using the data-movement model (Information Liquidity Model, or ILM).
The ILM provides the DW architect with tools for modeling and analyzing data transformation both at a general level of consideration and at a detailed level.
Fig. 15.6 shows an example of how input and output data sources can be linked at a high level, and how the transformations are modeled in lower-level diagrams.
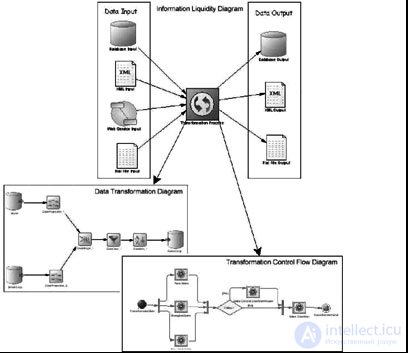
Data movement is one of the main concerns for any organization. Modeling data movement makes it possible to determine, within the model, where data is generated, where it is loaded into the system, and how it is transformed in the course of its use.
The PowerDesigner Information Liquidity Model (ILM) is a graphical tool for modeling data movement, which makes it possible to build models of:
Now let us build a data-movement model (ILM) that contains an Information Liquidity Diagram, a Transformation Control Flow Diagram, and Data Transformation Diagrams, thereby creating a model of the ETL process.
To create an ILM model, the following sequence of steps must be performed.
As a result, a dialog box will appear on the screen, as shown in Fig. 15.7.
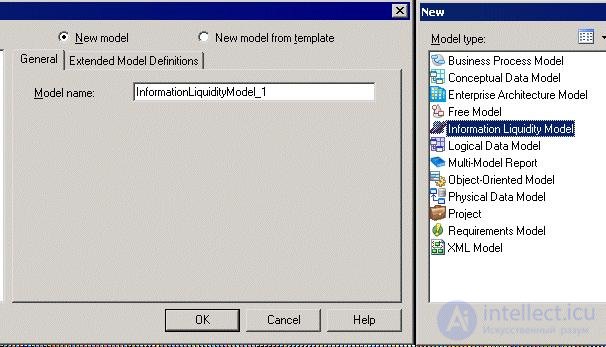
Thus, the ILM model has been created. Now it needs to be populated with diagrams.
Let us create a transformation diagram. The transformation diagram is a high-level diagram for documenting ETL and EII processes. It shows the input and output data sources involved in the transformation process. The sources are linked by the transformation process, which is defined in the subsequent data transformation diagrams.
Suppose that data flows into our Giant Corp data warehouse from the following sources: two operational databases belonging to the organizations Small Corp and Acme, the Small Corp Role business process model, and the Acme Role XML model.
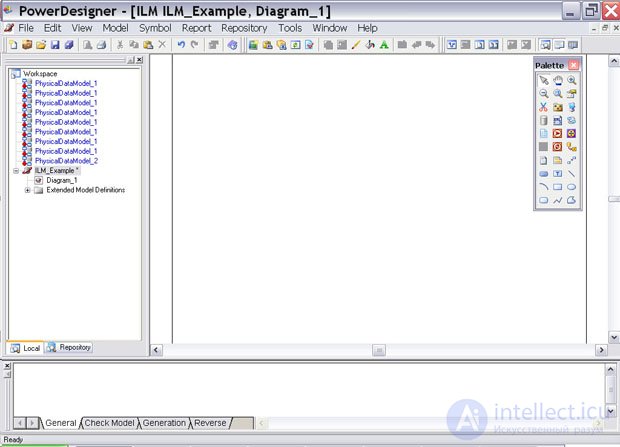
Using the tool palette (fig. 15.8), let's mark up the model objects.
| Action | Icon |
|---|---|
| three data sources of type "database" |
 |
| one data source of type "XML document" |
 |
| one data source of type "Business process" |
 |
| let's place a "Transformation process" |
 |
Let's connect them with arrows, thereby obtaining a transformation diagram as shown in fig. 15.9.
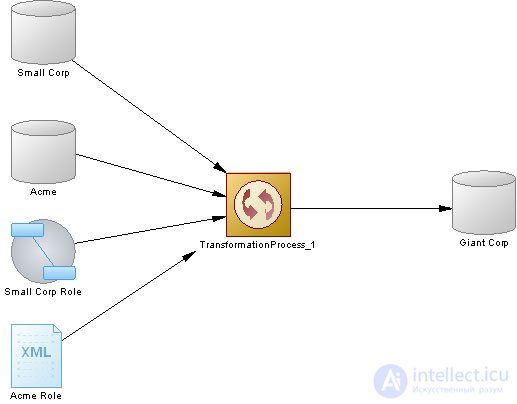
Now we need to link the diagram objects to the descriptions of the data sources. For our example, let the Small Corp database have the schema shown in fig. 15.10, the Small Corp database — the schema in fig. 15.11, the Giant Corp data warehouse — as in fig. 15.12, and let the Acme Role XML document have the model shown in fig. 15.13.
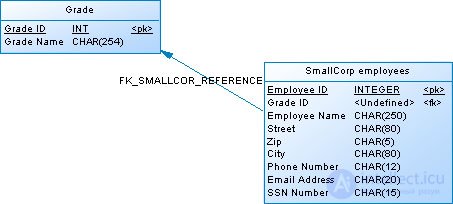

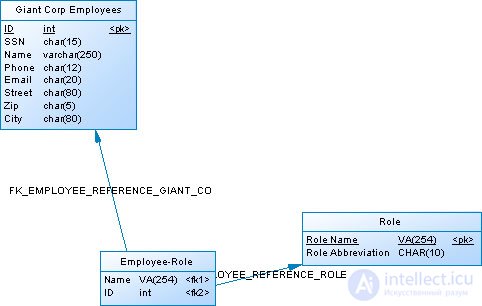
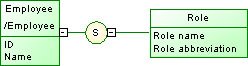
Let's use the Small Corp database as an example to show how to link a diagram object to a data source description. Double-click the left mouse button on the object's icon; on the " Database property sheet " panel, open the " Physical Data Models " tab. Click on the " Add Physical Data Models " icon, and a list of models will open. Select the corresponding model from the list and click OK (see fig. 15.14). The link is now established.
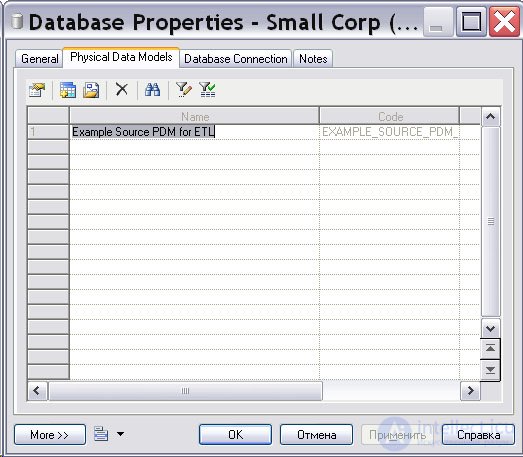
Fig. 15.14. Linking an ILM-model diagram object to a database schema
The ILM diagram object "Transformation process" defines the list of data transformation tasks and the transformation control flow.
Let's build a data transformation diagram. A data transformation task consists of one or more data transformation diagrams that allow us to model the processes of extracting data from data sources, transforming the data, and loading the data into a destination source. Data comes from data sources (data inputs), is transformed by performing certain manipulations on it, and is loaded into a destination source (data outputs). The sequence of these processes is linked together by data flows, and the data itself is represented via the columns of the data structure used at each of the listed processes.
In fig. 15.15, the data transformation diagram shows that data is extracted from the Acme and Small Corp databases, then merged into the DataMerge database, filtered by the DataFilter filter, sorted by the DataSort procedure, and loaded into the Giant Corp database.
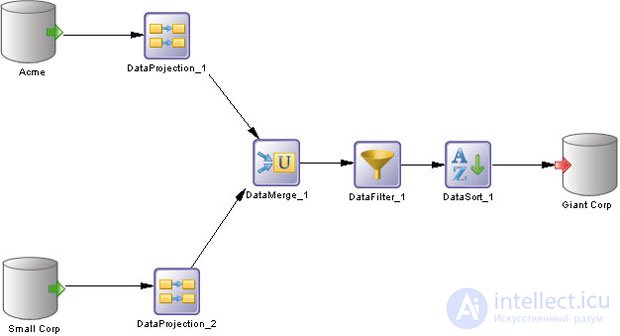
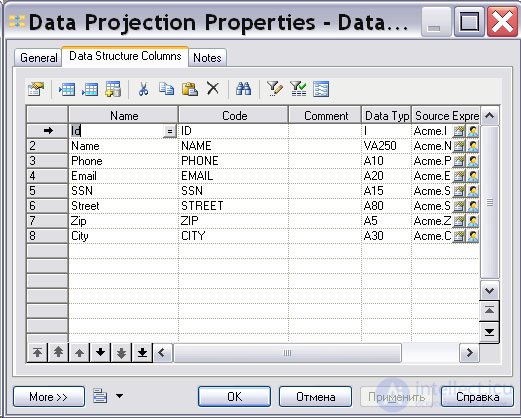
For each object, we need to define the list of columns that will be involved in the transformation process at that object. This is done in the " Data Projection Properties "" dialog box, as shown in fig. 15.16.
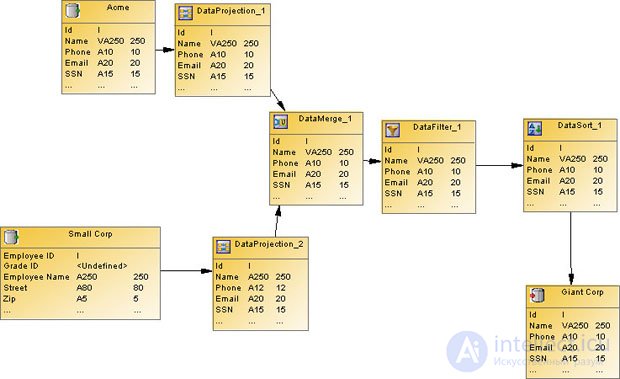
The data transformation diagram shown in fig. 15.15 can be expanded so as to display the data structures at each element of the diagram, as shown in fig. 15.17.
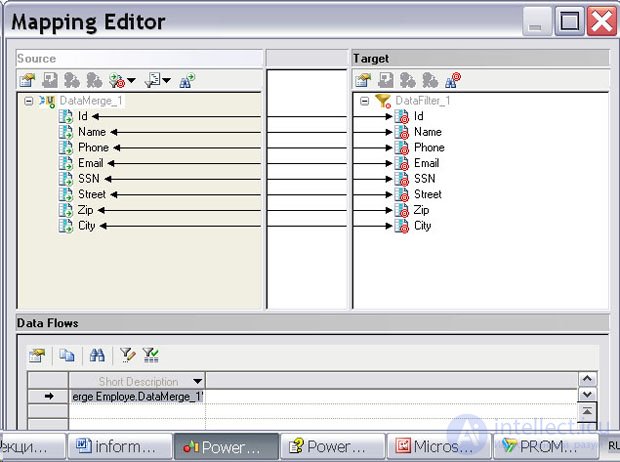
The data flow (the arrows on the diagram) passes data between the objects of the data transformation diagram. The Mapping Editor can be used to define a data flow, as shown for the data flow between DataMerge and DataFilter in fig. 15.18.
Transformation control flow diagrams are designed to model sequential or parallel data transformation tasks. A control flow diagram consists of one or more transformation control flow diagrams that model the order in which the sequence of data transformation tasks is executed. The task sequence includes task initialization (starts), task executions, decisions, synchronizations, and task completion. Linked together, they make up the control flow.
Fig. 15.19 shows the transformation control flow diagram for our example.

The transformation task initialization icon ( TransformationStart_1 ) initiates execution of the sequence of data transformation tasks in the control flow diagram. Next, the tasks "Merge employees" ( Merge Employe ) and "Merge roles" ( Merge Role ) are executed in sequence. No decisions are made, and no synchronization is performed. The process ends with execution of the transformation completion task ( TransformationEnd_1 ).
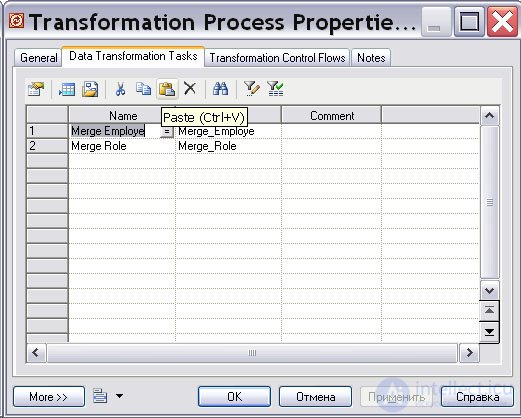
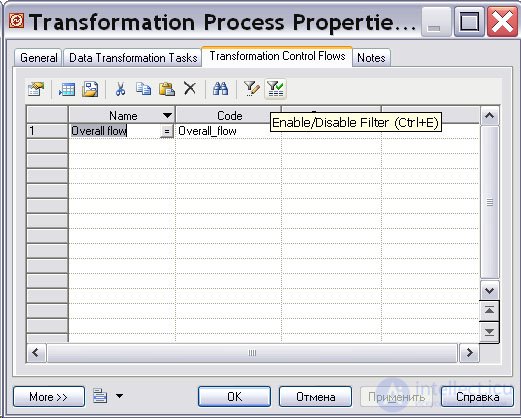
All the diagrams we've built are linked together on the high-level diagram of the ILM model (see fig. 15.9) in the "Transformation process" object ( TransformationProcess_1 ). Fig. 15.20 and 10.21 respectively show the tabs of this object's property dialog box, which display the bindings of the transformation tasks and the control flow.
Thus, a data warehouse designer can model ETL processes for the warehouse being developed with the help of CASE tools.
Note that in presenting the material of this last section, we omitted numerous details of defining objects and their properties when designing an ETL-process model. Our purpose here is simply to illustrate the capabilities of CASE tools. It is also worth noting that leading vendors of comprehensive solutions for building data warehouses, such as IBM, Oracle, Microsoft, and a number of others, ship built-in tools for designing ETL processes. Therefore, the data warehouse designer will need to familiarize themselves with the capabilities of such tools once the underlying DBMS has been chosen.
Thus, developing an ETL process includes the following main stages:
When designing data transformation processes, the data warehouse designer must solve the following tasks:

Comments