
Lecture
Organization of the laboratory service, principles of technical equipping with means of laboratory analysis, and technological schemes of experiments. Operating principles of the instruments and complexes used for laboratory analysis. Analytical apparatus used in the laboratories of sanitary-epidemiological stations. Possibilities for automating laboratory medical studies. Currently existing biological sample analyzers: physico-mechanical, physico-chemical, and atomic-physical. Instrumental methods of immunological studies.
Organization of the laboratory service, principles of technical equipping with means of laboratory analysis, and technological schemes of experiments.
A clinical laboratory is intended for analyzing samples taken from patients in order to obtain information that helps diagnose disease and assess the effectiveness of therapy. The hospital department performing these functions may also be called the clinical pathology department or the laboratory medicine department. The main divisions of a clinical laboratory are the chemistry, hematology, and microbiology departments, as well as the blood bank.
The chemistry department performs analyses of blood, urine, cerebrospinal fluid, and other fluids in order to determine the amount of clinically significant substances they contain. Electronic equipment in a clinical laboratory finds its primary application precisely in the chemistry department. The hematology department counts and characterizes the formed elements of blood (red blood cells, white blood cells, and platelets), and also tests the functions of the physiological blood systems (an example being the study of coagulation). The microbiology department carries out studies of various human tissues and fluids in order to determine the presence of pathogenic microorganisms in them. Until relatively recently, electronic equipment found essentially no application in microbiology. However, many microbiology laboratories now use devices for the automatic monitoring of blood culture status (tests for the presence of microorganisms) and tests with semi-automatic measurement of microorganism sensitivity to antibiotics (resistance tests). The use of electronic equipment in blood banks is still in a formative stage. Several systems are currently being developed to automate the basic classification procedure for blood products.
Since many critical decisions in patient care are based on the results of tests performed by the clinical laboratory, the accuracy and reliability of these results are of enormous importance. The soundness of equipment design and the effectiveness of quality control programs play an essential role. Everyone involved in the development and use of clinical laboratory equipment must constantly bear in mind that erroneous test results can lead to tragic consequences.
A second important characteristic of many tests is the speed with which they are obtained, since in many critical clinical situations a physician's choice of therapeutic procedures depends on test results. The use of electronics in the clinical laboratory significantly reduces the time required to perform a wide range of basic tests.
The main application of electronics in the clinical laboratory is the use of computer systems for managing information arrays. Commercial systems use mainframe computers, minicomputers, and microcomputers. Laboratory information systems track patient data, organize the workflow sequence, automatically request test results from certain types of instruments, store databases of test results, transmit test results to connected patient-care devices, prepare printed reports, assist in quality control, and support many other management functions.
Operating principles of the instruments and complexes used for laboratory analysis.
Let us consider the basic principles and quantitative methods for determining the content of protein, serum cholesterol, uric acid, bicarbonates, acidity, and the partial pressure of carbon dioxide and oxygen in the blood.
Spectrophotometer. To determine the concentration of a given substance in solution, a spectrophotometer is used. If blood is taken as the sample, it must be centrifuged to separate the plasma from the cellular elements. Colorless compounds acquire color as a result of a reaction with a specific substance called the reagent. The concentration of compounds in solution can be determined provided there is maximum absorption of light of a given wavelength by each compound. Measurements are taken in the visible part of the spectrum (380—780 nm).
The concentration of a substance is determined based on Beer's law. Suppose that incident light of intensity I0 passes through a cuvette containing a dissolved substance that maximally absorbs light of wavelength λ. The intensity Is of the light that has passed through the solution will be less than the intensity I0 of the incident light. The light transmittance is defined by the ratio Is/I0. A certain portion of the incident light is reflected from the surface of the cuvette or absorbed by the solvent. This factor can be accounted for by using a reference cuvette containing only the solvent. The light transmittance of the reference cuvette is defined by the ratio IR/I0, where IR — is the intensity of the light that has passed through the cuvette. The light transmittance of the dissolved substance is defined as Is/IR.
F = - Ig Is/I0 = - Ig T = 2- Ig % T.
The absorption coefficient of a solution depends on the width of the cuvette through which the incident light passes:
Is = I0 exp (-α c x),
where α — the absorption coefficient, constant for a given substance and wavelength; c — concentration (mol/L); x — the path length of light in the substance (cm). The light wavelength of the required length is selected using the appropriate filter. A device equipped with such a filter is called a photometer or colorimeter. In the case of a spectrophotometer, the narrow transmission band is usually achieved using a diffraction grating (Fig. 1.). The light source is usually a tungsten lamp, whose radiation intensity varies with wavelength. Therefore, a regulator for the source's light intensity is needed to ensure a sufficient level of illumination of the photocell.
The term «monochromator» refers to all elements located from the entrance slit of the device to the exit slit. The monochromator is designed to illuminate the sample under study with monochromatic light, since otherwise Beer's law does not hold. Using a diffraction grating, polychromatic white light is decomposed into components of the corresponding wavelengths. A beam of light of the desired wavelength is focused on the exit slit. The beam that has passed through the sample is converted by the photocell into an electrical signal (the sample under study is contained in a cuvette made of Pyrex glass).
If the light source is a tungsten lamp, this can cause changes in the characteristics of the optical systems, the cause of which may be condensation of metal vapor, lubricant, dust, and overheating. In this case a double-beam spectrophotometer is used. The light emitted by the lamp is split into two beams. One passes through the sample under study, the other — through a reference cuvette. The ratio between the intensities of the two beams is used to calculate the transmittance. Other light sources are used in ultraviolet and infrared spectrophotometry.
In spectrophotometry, as a rule, the wavelengths used for laboratory methods lie in the ultraviolet (200-400 nm), visible (400-700 nm), or near-infrared (700-800 nm) ranges; most instruments operate in the visible range.
The figure shows the block diagram of a spectrophotometric-type instrument. The source produces a flux of radiant energy used for analyzing the sample. The wavelength selector passes energy within a limited frequency band. The cuvette containing the sample being analyzed is placed in the path of the energy beam. The detector produces an electrical signal proportional to the amount of energy it receives, and the indicator displays the numerical value of the received energy flux or some function of it (for example, the concentration of the substance being analyzed in the sample).
The basic principle of spectrophotometric measurement is as follows: if one considers a suitably chosen and sufficiently narrow band of the electromagnetic spectrum, the absorptive properties of the substance being analyzed can be used to determine its concentration. In the overwhelming majority of cases, these substances, in the form in which they are normally present in samples obtained from patients (for example, in blood serum, urine, or cerebrospinal fluid), do not have the required electromagnetic energy absorption characteristics. In such cases, reagents that cause a chemical reaction to occur are added to the samples. This reaction yields a product that already has the required characteristics. The reaction products are then placed in a cuvette for analysis. Instrument calibration procedures account for the possible difference between the concentration of the reaction product and the original amount of the substance being analyzed.
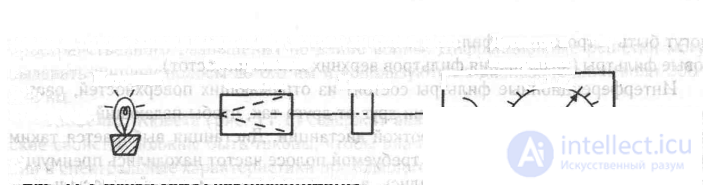
Fig. 1 Block diagram of a spectrophotometer.
Radiation sources. Hydrogen or deuterium gas-discharge lamps are used to obtain an energy flux in the 200—360 nm range, while tungsten-filament incandescent lamps are used in the 360-800 nm range. Both hydrogen and deuterium lamps have a continuous emission spectrum, but the problem with using these sources is that 90% of the emitted energy falls in the infrared range. The intensity L of radiation in the visible and ultraviolet ranges can be increased by using lamps at a voltage exceeding the rated value, but this approach also significantly shortens the lamp's service life. Another problem associated with the use of tungsten lamps is that, during operation, tungsten gradually evaporates from the filament and condenses on the glass envelope of the lamp. This layer, which usually settles unevenly, changes the spectral characteristics of the lamp, which can lead to measurement errors.
Wavelength selectors. Various devices are used to select which part of the source spectrum will
be used in analyzing the sample. These devices can be divided into two classes: filters and monochromators. There are two main types of filters: glass filters and interference filters.
Glass filters operate on the principle of energy absorption. For example, a blue filter absorbs in the long-wavelength (red) region of the visible range and transmits in the short-wavelength (blue-green) region of the visible range. These filters (consisting of one or more flat glass layers) can be constructed as high-pass filters, low-pass filters, and band-pass filters (a combination of high-pass and low-pass filters).
Interference filters consist of reflecting surfaces spaced a certain distance apart so that the incident light beam is reflected back and forth over a short distance. The distance is chosen so that light waves in the required frequency band are predominantly in phase and mutually reinforce each other, while waves outside this frequency band are out of phase and mutually cancel (the phenomenon of interference). Harmonics of this frequency band also pass through such a filter and must be suppressed by a cutoff glass filter.
Glass filters are used in cases where moderate accuracy is sufficient. Interference filters are used in many spectrophotometers, including devices of the SMAC (Technicon Instrument Corporation) and CentrifiChem (Union Carbide) type. Instruments in which filters are used as the wavelength selector are called colorimeters or photometers.
Monochromators — are devices that use prisms and diffraction gratings. They produce a very narrow frequency band with an adjustable central (nominal) frequency value. The basic operating principle of these devices is the spatial decomposition of the incoming light beam depending on wavelength. A mechanical device is then used that allows light in the required frequency band to pass through a slit. Prisms are made of glass or quartz. Quartz prisms are required when working at wavelengths shorter than 350 nm. A system of converging lenses directs the light beam from the source onto the entrance slit. The prism deflects the light beam by an angle that is a function of wavelength. Light with the shortest wavelength (ultraviolet) is deflected most strongly. In this way, an output beam is obtained in which the required frequency band can be isolated using an opaque screen with a narrow slit placed in the path of the radiation. The wavelength spectrum for the beam that has passed through the slit has a nominal triangular shape. For prisms, as for filters, the frequency (wavelength) at which maximum transmittance is observed is called the nominal (central) frequency (wavelength). Devices of this type can achieve a bandwidth of 0.5 nm. Prisms are used in the wavelength range of 220—950 nm. The nonlinear nature of the spatial distribution of the energy flux produced by a prism requires fairly complex mechanical devices to control the position of the slit when selecting various wavelength values.
In the case of UV spectroscopy, a fluorometer, equipped with a filter that transmits only ultraviolet radiation, is used. A second filter, positioned perpendicular to the first, transmits the radiation that is measured by the photometer.
Fluorometric methods make it possible to determine the concentration of substances of specific clinical interest, including drugs and their metabolic products. Turbidimetry and nephelometry methods are also used to determine the concentration of substances in solution. The former make it possible to measure the intensity of light absorbed by the substance under study, while the latter measure the intensity of light,, scattered by particles of the substance under study in a direction,, perpendicular to the incident beam.
Currently existing biological sample analyzers: physico-mechanical, physico-chemical, and atomic-physical. Possibilities for automating laboratory medical studies.
Autoanalyzers. Instruments that were originally designed for the simultaneous processing of a large number of samples became known as «sequential multiple analyzers» (sequential multiple analyzers (SMA)). The main characteristic of such instruments is either the number of tests that can be performed simultaneously, or the number of tests performed per hour (for example, SMA 12/60).
A block diagram of the autoanalyzer is shown in Fig. 2. The design features of such an analyzer are:
— the presence of mutually isolated tubes of various diameters and a pusher pump that ensure the movement of several continuous streams of the substances under study and reagents at specified constant rates;
— separation of the substance under study and the reagent by introducing air bubbles into the stream;
— separation of proteins from the substances being analyzed using a semi-permeable membrane (this procedure minimizes the effect of protein on chemical reactions);
— the presence of spare modules, which makes it possible to easily replace a module that has failed.
The tube containing the substance under study is placed in the sample chamber. Samples (volumes of constant size) are moved through the collector's intake tube. The reagents and the samples under study are mixed in the required volume ratios, and the liquid stream is separated by air bubbles. The reaction product (after heating, if necessary) is examined using an appropriate instrument, usually a spectrophotometer. Since all samples and standard reactions are processed in exactly the same way, there is no need for the reaction to run to completion before the measurement begins. The results, in the form of a series of peaks, are output to a chart recorder.
Centrifugal analyzer. The high sensitivity of this instrument makes it possible to use finger-prick blood from both adults and children for clinical studies. It can also be used to continuously study time-dependent reactions, such as enzyme kinetics. Photometric measurements in this instrument are performed in a rotating centrifuge head (Fig. 3). The rotor consists of an outer ring on which several cuvettes are mounted, made by pressing an inert gasket between two surfaces of optically transparent material. Three concentric rows of cavities form a transfer disk. During centrifugation, the material under study and the reagent flow from the two inner cuvettes into the outer one. Each set of three cavities and its corresponding cuvette forms a reaction unit. The photometric system is mounted perpendicular to the rotor and the cuvette. The light transmittance of each reaction mixture is determined relative to the transmittance of the first, unfilled cuvette. The rotor makes one full revolution in 50 or 100 ms. Readings obtained over every eight consecutive revolutions are averaged. The autoanalyzer's computing system accepts, averages, processes, and outputs the resulting data. This instrument is similar to a multichannel double-beam spectrophotometer.
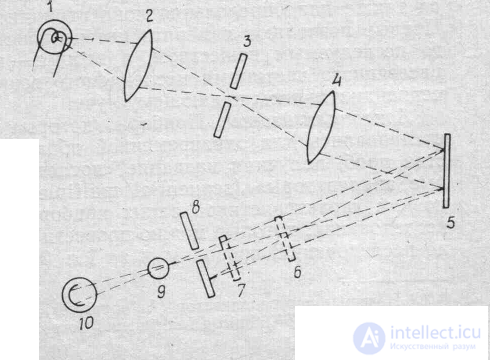
Fig. 1. Schematic representation of a spectrophotometer.
Slit openings and a diffraction grating or prism are used to select the desired wavelength. 1 — light source, 2, 4 — lenses, 3 — entrance slit, 5 — diffraction grating, 6 — light intensity regulator, 7 — filter, 8 — exit slit, 9 — sample, 10 — photocell.
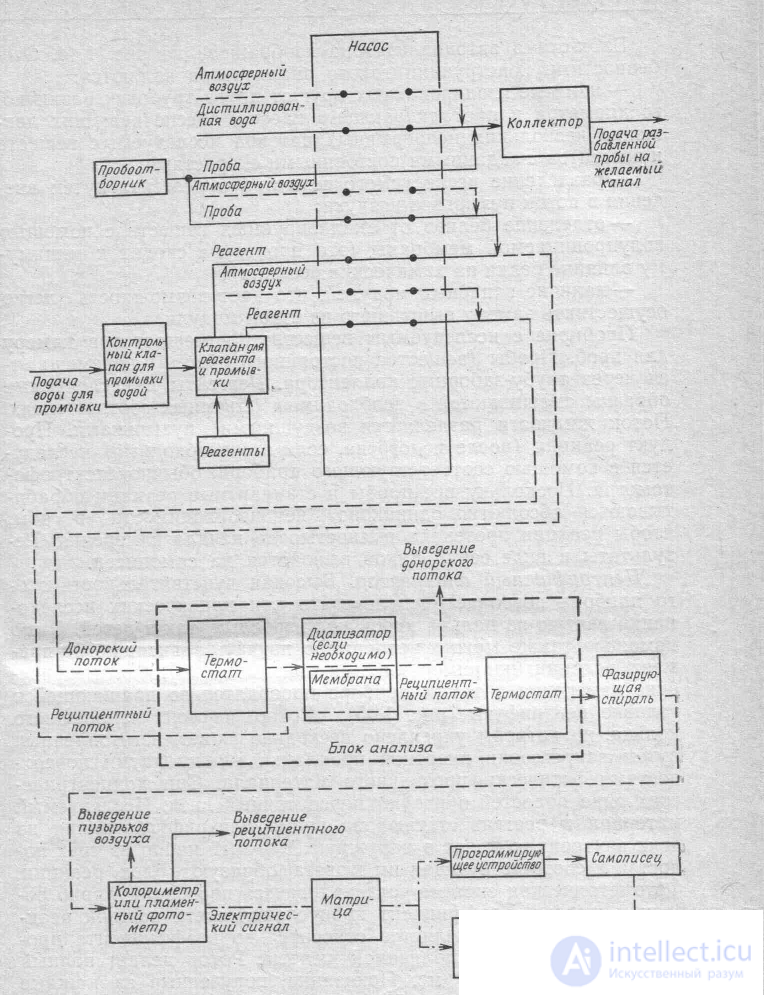
Fig. 2. Block diagram of the Technicon SMA 12/60 automatic analyzer.
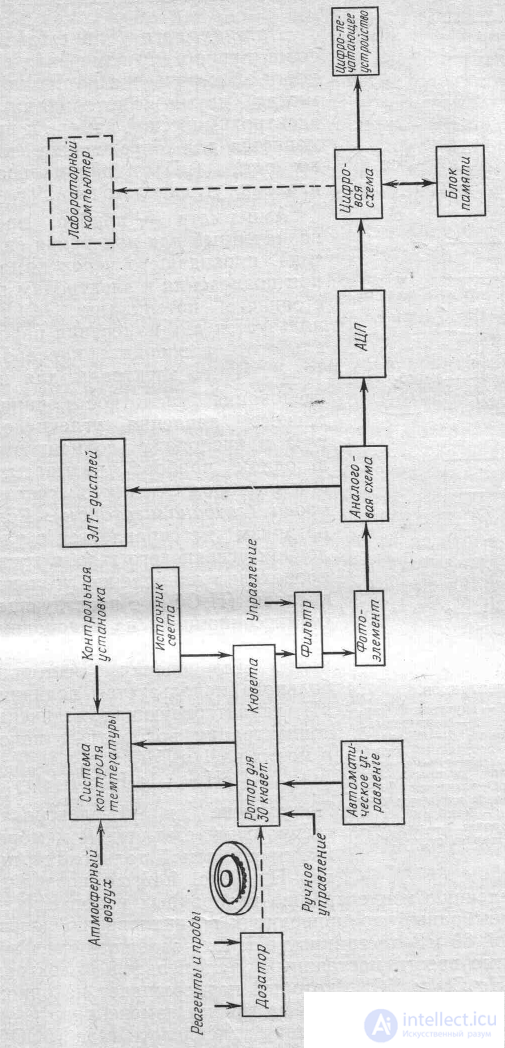
Fig. 3. Block diagram of a centrifugal analyzer.
A potentiometer is a device for measuring the difference in electrical potentials between two electrodes in an electrochemical chamber and is used to determine acidity (pH) and the partial pressure of carbon dioxide (pCO2). An ammeter is a device designed to measure the current flowing through the chamber when a constant potential is applied to the electrodes. It is used to measure the partial pressure of oxygen (pO2). The electrodes for measuring acidity, partial pressure of carbon dioxide, and oxygen are often combined in a single instrument called a blood gas analyzer (gas analyzer). If the body cannot cope with the removal of carbon dioxide, carbonic acid (H2CO3) accumulates in the blood, subsequently dissociating into hydrogen [H+] and bicarbonate [HCO3~] ions. To assess the patient's condition, the pH value is used, characterizing the increase in the concentration of hydrogen ions in moles per liter [H+]:
pH = - Ig [H+].
The use of a special glass membrane in pH electrodes, permeable only to H+ ions (Fig. 4,a), makes it possible to create a specific concentration of hydrogen ions on each side of the membrane, which leads to the development of a potential of 60 mV per pH unit. To complete the circuit, a constant calomel electrode (saturated with Hg2Cl2 and KCl) must be introduced, which keeps its own potential at a constant level despite changes in pH.
Measurement of the partial pressure of carbon dioxide (pCO2) is carried out using a special glass pH electrode (Fig. 4, b) and a silicone rubber membrane permeable only to gas. As a result of the diffusion of carbon dioxide through the membrane from the solution under study, an acid-base equilibrium with the bicarbonate solution is quickly established, which in turn leads to a change in the initial pH value. The relationship between the partial pressure of carbon dioxide (pCO2) and acidity (pH) is determined by the Henderson—Hasselbalch equation:
pH = - s IgpCO2 - Ig α + p K' + Ig [HCO3-],
where s — relative sensitivity of the electrode; a — solubility coefficient of carbon dioxide; K' — the first dissociation constant of carbonic acid.
Measurement of the partial pressure of oxygen is performed using a Clark electrode (Fig. 4, c). The cathode potential is set equal to — 0.67 V. In the absence of oxygen in the solution under study, the current is practically zero. If oxygen is present in the solution, it diffuses through the membrane, and the decrease in its concentration is accompanied by a loss of electrons, which are supplied by the cathode. The resulting current is amplified, and its values are reproduced on the instrument's screen. The current is directly proportional to the partial pressure of oxygen in the solution under study. The membrane prevents the movement of proteins and other oxidizers that could disable the cathode. In addition, the membrane limits the diffusion zone, thereby preventing changes in the oxygen diffusion coefficient.
Gas chromatograph (Fig. 4). The gas mixture being analyzed and the carrier gas are simultaneously passed at a constant rate through a heated column. In this process, gases that are less soluble in the column packing pass through it faster, resulting in the separation of the gas mixture. Since the thermal conductivity of the mixture depends on its composition, each component of the mixture can be detected by a sensor measuring thermal conductivity.
This method allows the analysis of only discrete gas samples, and each analysis requires several minutes. At the same time, this method provides high analysis accuracy with a small sample volume (less than 1 ml) and, moreover, is much cheaper than the mass spectrometric method.
Absorption spectrometer (Fig. 5). The essence of this method lies in the fact that various chemical compounds in the liquid or gaseous phase absorb light energy only in a certain part of the spectrum. The intensity of the light passing through the substance is determined by Beer's law and depends on the molecular composition of the substance. The sample, placed in a cuvette, and a control mixture not containing the gas under study, are exposed to infrared radiation modulated by a chopper at a frequency of 60 Hz. Depending on the degree of absorption of the radiation, the heating of the sensor chamber changes; in this case, the expanding gas deflects the diaphragm toward the lower pressure, which leads to a change in the capacitance of the condenser microphone. The magnitude of the output signal from the rectifier is directly proportional to the concentration of the gas under study.
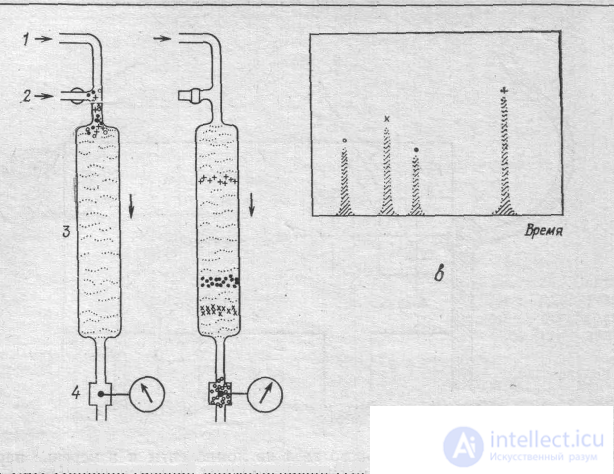
a b
Fig. 4. The principle of gas chromatography.
a — before separation: 1 — migrating substance (gas, liquid), 2 — sample injection, 3 — column packing in the stationary phase, 4 — detector; b — after separation; c — amount of each component. As the mobile phase passes through the stationary phase, the components of the mixture under study are separated because they have different migration rates.
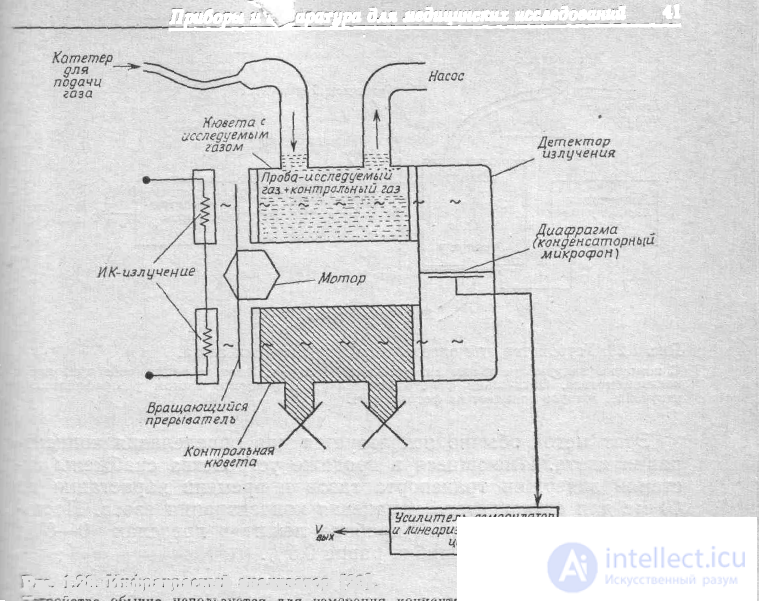
Fig. 5. Infrared analyzer.
The device is usually used to measure the concentrations of carbon dioxide, carbon monoxide, nitrogen dioxide, and halothane.
Currently produced is a fully automatic open-type analyzer with a flow cuvette — EOS-Bravo. It is designed for performing biochemical and immunoturbidimetric analyses. This is a fully automated system that operates without an operator present. The system's throughput can reach 160 analyses per hour (by «endpoint»).
The «optimal batch» mode makes it possible to ensure the system's throughput with its mixed loading of analyses by the «endpoint» and «kinetics» methods (up to 120 analyses per hour). It is possible to perform an «urgent analysis», in which case the results of previous «routine» analyses are preserved, and after the «urgent analysis» is performed, «routine» work resumes. At the same time, up to 18 reagents, up to 16 calibrators and controls, and up to 63 serum samples are loaded onto the system. The instrument's memory stores 32 biochemistry programs and 32 immunoturbidimetry programs, which can be modified by the user depending on the reagents used. The user is given the option to use one of 6 measurement methods: «endpoint», «two-wavelength measurement», «kinetics», «fixed reaction time», «endpoint with two reagents with a blank against one reagent», «endpoint with nonlinear calibration up to 8 points».
The minimum total reagent volume for one analysis is 400 µl. The quality control program makes it possible to automatically perform intralaboratory control. Results are printed on a printer; printing by analysis during operation and by patient is possible. Interface: RS-232 serial port.
Technical specifications:
Serum — 63 free positions, including calibrators and controls;
Reagents — 18 positions;
Throughput — 120 kinetic tests/hour;
Methods — «endpoint», «two-wavelength measurement», «kinetics», «fixed reaction time», «endpoint with two reagents with a blank against one reagent», «endpoint with nonlinear calibration up to 8 points».;
Flow cuvette — 50 µl;
Accuracy — 0.0001 opt. dens.;
Linearity — up to 3.000 opt. dens.;
Incubator — incubator temperature 37±0.1°C;
Dilutor — precision syringe 1000 µl with a step of 1 µl, accuracy ±0.3 µl;
Computer — built-in. Quality control program installed;
Monitor, keyboard, printer — standard;
Dimensions — 71 x 62 x 36 cm;
Weight — 38 kg.
Also currently produced is a 3-channel semi-automatic biochemical analyzer — Screen Master Point It is designed for measuring optical density in the modes: «by endpoint» with linear and nonlinear calibration, «fixed reaction time» and «kinetics» in 3 channels simultaneously. Reagent consumption — from 0.5 ml, sample — from 5 µl. It has: a built-in incubator (37°C) for 12 positions and a thermal printer, the result is displayed on the screen and printed out.
The optical unit is divided into 3 channels with two wavelengths each, which makes it possible to simultaneously perform measurements by kinetics, fixed reaction time, and endpoint. The light sources are LEDs of a specific wavelength, whose service life is many times longer than that of halogen lamps.
Ideal for the intensive care laboratories of district, city, and rural hospitals with a load of up to 100 analyses per day. It can be used for work in field, mobile laboratories, for family doctors. It determines substrates, enzymes, electrolytes, hormones, and some hematological parameters. Data can be transmitted to an external computer via a standard RS-232 port. The instrument's memory contains 39 channels open for programming.
Technical specifications:
Optical range — 6 wavelengths from 366 to 633 nm;
Linear range — from 0.000 to 2.500 opt. dens.;
Resolution — 0.001 opt. dens.;
Ultra-long-life light sources — LEDs;
Power supply — 12 V DC, adapter — 220 V, 50 Hz;
Power — 75 W;
Dimensions — 27 x 31 x 16 cm;
Weight — 2.5 kg.
Among general clinical studies, hematological diagnostic methods are traditionally the most widely used types of analyses. The main direction in the development of modern technologies for counting and evaluating the formed elements of blood is the introduction and widespread use of hematology analyzers that perform partial or nearly complete analysis of blood cells and determine red blood indices, including hemoglobin, hematocrit, and erythrocyte indices. Semi-automatic and automatic hematology analyzers of varying complexity are used for counting and analyzing blood cells.
The portable semi-automatic hemoanalyzer «HemoCase-5» from the company «ReaKit» is designed to determine the number of leukocytes, erythrocytes, hemoglobin concentration, mean corpuscular volume, and hematocrit. In terms of accuracy and reproducibility of results, the «HemoCase-5» analyzer is not inferior to the best foreign models, and in terms of operational and dimensional parameters it has no equal.
Scope of application of the hemoanalyzer: clinical analysis of venous or capillary blood in medical institutions of various profiles, including during mass examinations of the population. Primarily this includes admission and surgical departments of clinics, outpatient clinics, mobile laboratories, and disaster medicine.
The device is distinguished by:
- High reliability and stability of operation.
- Simplicity of control and operation
- Resistance to clogging of the measuring path.
- Low maintenance cost
- Uniquely small size and weight.
- A special hermetic and impact-resistant case for carrying the instrument and a set of consumables.
Instrumental methods of immunological research.
UNIPLAN enzyme immunoassay analyzer (RF Patent N 2035716. Gosstandart Certificate N 9895). The device is designed to measure the optical density (concentration) of samples in a standard plate of 96 microcuvettes in automatic mode (principle of operation - vertical photometry).
Working with the device: when the device is turned on, an automatic parameter check is performed and, after a signal, the device is ready for operation. The operator selects a program from the control panel and enters parameters (calculation formula, coefficients, layout scheme for dispensing controls, etc.) specified in the description of the test system, places the plate to be tested in the plate holder and presses the "Start" button; the device performs everything else - measurement, processing, and printing of results - automatically.
"UNIPLAN" - modern design, liquid crystal display, fundamentally new software: operation in dialog mode, the ability to enter calculation formulas specified in the test system, with subsequent saving of the set parameters; storage of the curve built from standards, etc., up to 99 programs.
The "Uniplan" device can be used in medical institutions, Gossanepidnadzor (State Sanitary and Epidemiological Surveillance), veterinary medicine, etc.:
- for performing all types of immunological studies, such as: diagnosis of AIDS, hepatitis A, B and C, influenza, herpes simplex, rubella, measles, smallpox, syphilis, pertussis, diphtheria, pneumococcal infection, tuberculosis, meningitis, toxoplasmosis, brucellosis, tularemia, tetanus, alveococcosis, echinococcosis, carcinoembryonic antigen, etc.;
- for determining various classes of immunoglobulins (allergen-specific immunoglobulins, myoglobin, fibrin-fibrinogen, etc.);
- for determining hormones (thyroid hormone [T4, T3], pregnancy diagnosis [hCG], cortisol, progesterone, prolactin, pituitary hormone [TSH], etc.);
- for diagnosing autoimmune thyroid disease;
- for determining enzymes and other biologically active substances.
The device provides:
- automatic fixation of the plate when installed in the measuring compartment;
- printout of results in the form of a table in a format corresponding to the plate, on standard A4 paper using a compact printer;
- the ability to connect any printer you have with a parallel interface compatible with an IBM PC;
- the ability to connect an external computer via an "RS232" line (connecting cable and software are supplied separately on request);
- storage of the obtained results and the ability to view them using the keyboard;
- audible signaling of all modes and completion of operation;
- diagnostics of possible operator errors.
+Measurements are performed using built-in programs for test systems produced both domestically and abroad.
The BIOMED 2L fluorescence microscope is designed for immunological studies using fluorescent and enzyme labels, as well as histological and cytological studies in clinical laboratory diagnostics.
The BIOMED 2L microscope — trinocular, Fluorat objectives, 10x, 20x, 40x, 100xOI, 25 W illuminator, excitation 360-550 nm, blocking filter 420-650 nm, mercury lamp 100 W/2, phase contrast.
ELECTROPHORESIS
Devices based on the electrophoretic principle are used in the clinical laboratory to measure the amounts of various types of proteins in plasma, urine, and cerebrospinal fluid. They are also used to separate enzymes into their constituent isoenzymes, to identify antibodies, and for a number of other applications.
BASIC PRINCIPLES OF ELECTROPHORESIS
In general, the phenomenon of electrophoresis can be defined as the movement of a solid phase relative to a liquid (buffer solution). The main function of the buffer solution is that it conducts electric current and maintains a constant pH value of the solution during migration. The buffer solution is stabilized by a solid matrix called the supporting medium.
Our discussion in this section will be limited to zonal electrophoresis. In this technique, the sample is introduced into the supporting medium, and under the action of the electric field, particles of the same charge, the same size and shape, migrate at the same speed. This leads to the separation of particles into zones. The factors affecting the migration speed of particles in an electric field are described in the following paragraphs:
Magnitude of charge. The mobility of a given particle directly depends on the total magnitude of its charge. Mobility is defined as «the distance, expressed in centimeters, that a particle travels per unit of time at a unit field strength, expressed as the voltage drop per centimeter» [mobility = cm/(V • sec)].
Ionic strength of the buffer. The greater the buffer concentration, the lower the migration speed of the particles. This is because the greater the proportion of the total charge made up by buffer ions, the greater the proportion of the total current they carry. In addition, this occurs due to the interaction of buffer ions with the particles.
Temperature. Mobility directly depends on temperature. The resistance of the supporting medium to the passing current produces heat. This heat affects the electrophoretic process in two ways. First, it causes the temperature of the supporting medium to rise, which leads to a decrease in its resistance and, consequently, to an increase in migration speed. Second, heat causes water to evaporate from the surface of the supporting medium. This leads to an increase in the concentration of particles and further increases the migration speed. Due to these effects, to achieve acceptable reproducibility of the procedure's results, it is necessary to maintain either the applied voltage or the current at a constant level. For short separations at a relatively low voltage, both voltage and current can be kept constant. However, when using various gels as the supporting medium, heating is a significant problem. To minimize heat generation in media of this type, sources that maintain a constant current are usually used.
Time. The length of migration directly depends on the time during which the electrophoretic process proceeds. Other factors affecting migration include the phenomena of electroosmosis and chromatography, particle shape, the «barrier» effect, «wick flow», and streaming potential.
Types of supporting media. A wide variety of supporting media are used in various applications of electrophoretic techniques. These include paper, cellulose acetate, starch gel, agar gel, acrylamide gel, and sucrose. Here we will discuss cellulose acetate electrophoresis, since this method is widely used in clinical laboratories, and its general principle is also applicable to other supporting media.
Cellulose acetate films have a number of advantages over filter paper, which was originally used as a supporting medium for electrophoresis.
Fig. 11.9 shows a diagram of a device for cellulose acetate electrophoresis. A strip of cellulose acetate is saturated with buffer solution and placed in a membrane holder (a «bridge»). The «bridge» is placed in a «cuvette», with both ends of the strip immersed in compartments containing the buffer solution.
Several samples (usually eight) can be separated simultaneously on one strip. Each sample is applied to the strip at a marked point. Electrical voltage is then applied to the strip. For this type of electrophoresis, power sources that maintain a constant voltage value are usually used. A typical voltage value is 250 V, which corresponds to an initial current of 4—6 mA. As already mentioned, the current increases slightly during the process. After 15—20 min, depending on the type of instrument, the voltage supply is switched off. The next step is fixation on the membrane of the strips corresponding to the protein migration zones, and staining, which allows them to be seen and also allows quantitative analysis. This can be done by sequential or simultaneous treatment of the membrane with a fixing reagent and a dye. The membrane is then «cleared» to make it transparent. This leaves uncleared areas containing particles bound to the dye. The membrane is then dried in preparation for densitometric analysis.
A densitometer — is an instrument that includes a light source, a filter, and a detector (usually a photodiode).
The membrane is placed in the densitometer holder. Scanning is then performed along the migration path of one of the samples. The low-voltage output signal of the detector is amplified by a stabilized analog preamplifier. The signal from the preamplifier is fed to an analog two-coordinate recorder and to an analog integrator. The two-coordinate recorder plots a graph in which migration length is plotted on the x axis, and membrane density — which is directly proportional to the amount of the sample component that has migrated to the corresponding length — is plotted on the y axis. The integrator has a circuit that registers the beginning and end of each pronounced peak and calculates the area of that peak. The numerical values of the areas are printed on the electrophoretogram next to the corresponding peaks. This procedure is repeated for each of the samples on the membrane,
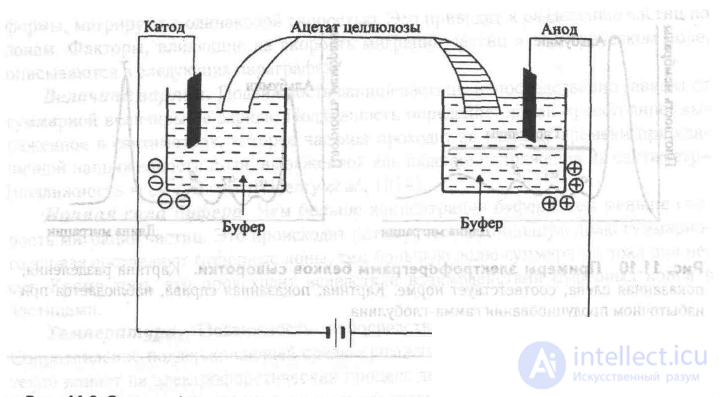
Fig. 11.9 Cellulose acetate electrophoresis.
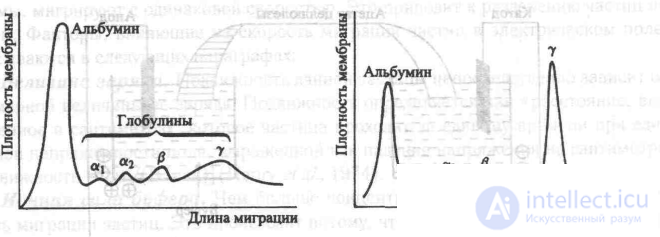
Fig. 11.10 Examples of serum protein electrophoretograms. The separation pattern shown on the left corresponds to normal. The pattern shown on the right is observed with excessive production of gamma-globulin.
Automatic chemical analyzers
Let us consider two of the most important types of automatic chemical analyzers. These are the Synchron CX4 (Synchron CX4) made by Beckman, and the Clinical Autoanalyzer (ACA) made by DuPont. Both of these instruments significantly increase the throughput of the clinical laboratory and reduce the turnaround time for urgent requests (so-called STAT requests 57/47). The Synchron CX4 is a relatively new instrument, the ACA — older but widely used. Both systems use spectrophotometric methods to perform the main measurements. The instruments differ in the way they perform the steps of sample selection, dilution, mixing the sample with reagents, physical movement of the sample, calculation, and recording of results. ,nitsy mekuE iM .RiiKSiiiBqa vg-.nki echgm'lr-shshshv p vkmgrtnn spoi SYNCHRON CX4 .; :a\eop geasnya 08 ~n kyo!\zhb/< ;not-j
pqna-ruH Ot^chLchZhUG, ch imchpya ,1.4 ChMNR.YaOOMTT}T G.P.KhN11 IP6T€
The Synchron CX4 system (Synchron CX4) is a modern high-throughput chemical analyzer (Anonymous, 1989). This is a random-access clinical analyzer capable of performing a wide range of tests in a single run. It has a number of features of interest from the standpoint of biomedical technology prospects. These features include automatic sample handling, the use of a whole range of analytical techniques, extensive use of microcomputers, and barcode identification principles. This instrument is a random-access chemical analyzer controlled by a microcomputer. It performs endpoint analysis and runs kinetic tests (at 30 C or at 37 C). .M,,nn,JN khnnneyuy,.,Ya khite N ^ateei: •>» otomzt.^ ,;n.EHS HHimqr Operating characteristics. The operator controls the operation of the CX4 instrument using a monitor and keyboard. Access to the hierarchical system of work screens is provided via eight function keys. (The assignment of each key is shown at the bottom of the screen.) There are five main functions: sample programming, reagent loading, calibration, special functions, and system parameters. yu ra'<HHOHUJfR3q n aotneteeo iopL :aomeqOo dagyu :im
1. Sample programming. Using this function, the operator can designate the material contained in a particular cup as an analyzed sample or a control sample, enter information to identify the material, and specify which tests this material should undergo. Special procedures are provided for performing STAT analysis of samples. Using the system printer, a list of the types of material to be placed in each of the cups in the sample sector (loading list) can be obtained. The characteristics of the sample sector will be discussed below. This list is used when placing samples received from patients and control samples in the sector.
2. Reagent loading. This procedure allows the operator to insert, remove, and replace reagent cartridges in the 24 slots on the reagent drum. Each reagent cartridge has a barcode label containing complete information about it, including the type of test in which it is used, and its expiration date. The reader picks up the barcode information when a cartridge is installed in or removed from the drum, and this information is transmitted to the system's main processor.
3. Calibration. To ensure the accuracy and reliability of the measurements, materials with known concentrations of the analytes (standard samples) are used. Calibration is performed both at the time reagents are loaded into the system and at certain time intervals.
4. Special functions. These functions include system setup and configuration, system diagnostics, and system maintenance procedures.
5. System parameters. In this mode, the operator can monitor the current operating status of the instrument, the current system configuration (for example, , the types of active tests), and the readings of various instrument sensors (for example, temperature and fluid levels).
Operating principle. The test cycle consists of two types of processes: the service interval and the analytical rotation cycle. We will discuss the events occurring with a single cuvette; each of the 80 cuvettes sequentially goes through these stages of the test cycle. During the service interval (10 seconds), the chemical reaction of the test is initiated. This process includes removing from the cuvette the reaction products of the previous test, and introducing into the cuvette the test reagents and the sample being tested (obtained from a patient or a control). During the analytical cycle, the drum with the sample rotates at a speed of 90 rpm for 6 seconds. The cuvette passes through the optical unit, where optical absorbance measurements are made at five frequencies.
In endpoint tests, the results of the last of the optical absorbance measurements of the reaction products are used to calculate the concentration of the analyte. In kinetic-type tests, use is made of the fact that the rate of change of optical absorbance in the reaction mixture depends on the concentration of the analyte. These calculations use measurement data relating to the most linear portion of the kinetic reaction curve.
The data analysis procedure includes calculating the concentration of the analyte from the optical absorbance readings. Each of these concepts will be discussed in more detail below.
System description. The CX4 system includes three main subsystems: the sample unit, the reagent unit, and the reaction system.
Sample unit. The sample unit consists of five modules: sample sectors (up to eight), an automatic loading system, a sample turntable, a sampler-mixer, and a cup for rinsing the sampler-mixer. A sample sector can carry up to ten cups with samples obtained from patients or with control samples. The operator enters information identifying the material in each of the cups using the computer control system (above). The automatic loading system transfers sectors with samples onto the sample drum under the control of a microcomputer. This process uses a stepper motor and a pneumohydraulic system. Upon completion of the test cycle, the sector is removed from the drum in a similar manner. The sample turntable consists of the sample drum and an optical reader. The sample drum is a rotary device with discrete positions and is driven by a stepper motor. Its rotation is controlled by a microcomputer so that the material to be analyzed is available to the sampler. The sampler has a liquid level sensor, which allows it to immerse the sampler needle to the correct depth, thereby making it possible to draw off the correct amount of the material being analyzed. After the material being analyzed enters the sampler, a crane system rotates the sampler into a position such that the sampler needle is above a cuvette on the reaction drum. The material is then discharged into the cuvette.
2. Reagent unit. The reagent unit includes reagent cartridges, the reagent drum, and the reagent dispenser. Reagent cartridges are disposable containers holding the reagents required for a particular test. They have barcode labels indicating the test in which they are used. The reagent drum rotates under the control of a microcomputer, feeding the needed reagent to the dispenser. The reagent drum carries 24 cartridges.
3. Reaction system. The reaction system includes the reaction drum and the photometric unit. The reaction drum carries 80 cuvettes in which the chemical reactions take place. A constant temperature of 30°C or 37°C is maintained in the cuvettes. The photometric unit consists of a xenon lamp, a collimator system, optical filters, and photodiode detectors. The xenon lamp emits a flash of light every time a cuvette passes through the optical unit. Because the flashes vary in intensity, a flash correction system is used. This system is based on taking absorbance measurements at frequencies other than the main measurement frequency. Light that has passed through the cuvette with the sample enters the collimator system, which splits it into beams directed through each of ten filters (340, 380, 410, 470, 520, 560, 600, 650, 670, and 700 nm) onto ten photodiode detectors. Each of the detectors produces a signal proportional to the intensity of the light incident on it. The signals pass through a logarithmic amplification circuit and are fed to the input of a commutator. The commutator, controlled by a microcomputer, takes a signal reading at specific moments and passes the analog signal to an analog-to-digital converter. The digital absorbance measurement data are transmitted to the system's central processor.
For most tests, when calculating the results, absorbance measurement data are used for only five of the ten possible frequencies. During each rotation cycle, each of the cuvettes passes through the optical unit eight times. The number of rotation cycles depends on the type of test. For example, in glucose determination, about 200 seconds elapse from the moment the sample is added to the reagent until the end of the reaction. Since the rotation cycle repeats every 16 seconds, this test requires 13 rotation cycles. For each rotation cycle, upon its completion the average absorbance value is calculated. After the reaction is complete, a cubic interpolation is performed over the average absorbance values. This process also performs the function of a digital filter that reduces the amount of noise. As shown in Fig. 11.4, this procedure is performed during the period when only the reagent is present in the cuvette, for determining background absorbance, as well as after the sample is added. The absorbance curve shown in Fig. 11.4 is typical of tests in which kinetic-type measurements are taken. In endpoint tests, by contrast, the absorbance measurement data are read after the reaction is complete, and the absorbance curve comes out onto the horizontal. The final concentration of the analyte is calculated using Beer's law. The test results are printed out in the form of a report that can be inserted into the patient's medical record and given to the attending physician. The instrument has a serial computer port for sending measurement results to the laboratory computer.
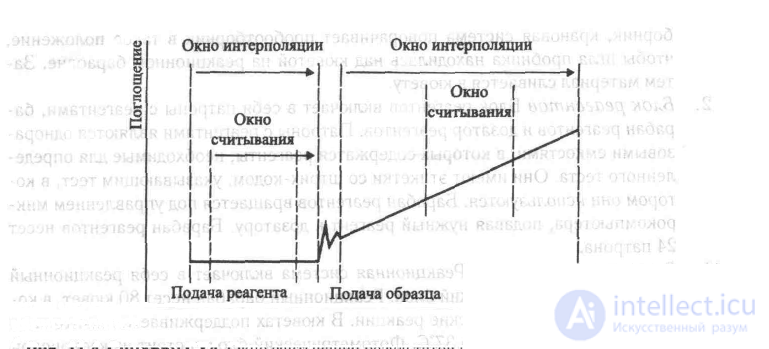
+Fig. 11.4 Synchron CX4. Results reading window for kinetic-type measurements
The Automatic Clinical Analyzer (ACA) made by DuPont differs from high-throughput instruments like the Synchron CX4 in its versatility rather than maximum throughput. It performs measurements sequentially rather than in parallel, but for each biological sample it can automatically carry out any combination of 40 tests. A functional block diagram of the ACA is shown in Fig. 11.5.
The ACA's principle of operation is based on the concept of automatic manipulation of biological sample packs (BSP) and chemistry reagent packs (CRP). A separate CRP is used for each biochemical test. As the instrument operates, the CRP moves from station to station along the transport track, and any sequence of CRPs can be selected for a given sample. The time required to perform any determination with the ACA is 7 minutes, with an interval of 37 seconds between determinations. This means the analyzer can run any analysis as a STAT test. This feature gives the clinical laboratory important additional capabilities, but it also leads to higher analysis costs compared with other automated methods.
Let us consider the main characteristics of the ACA. The sample obtained from the patient is placed in a BSP, to which the patient's identification card is attached. The CRPs corresponding to the tests to be performed on this sample are placed on the conveyor behind the BSP. The design of the CRP is shown in Fig. 11.6. A special cassette that completes the work cycle follows the last CRP on the conveyor. Each of the instrument's subsystems performs the following main functions:
Patient identification. When a BSP is placed in the ACA for the first time, it passes through a station that reads and prints out the information manually written on the patient identification card attached to the BSP.
Fill station. At the fill station, aliquots (measured volumes of liquid) are drawn from the sample set and mixed with a diluent, which can differ for different determinations. Then 5 mL of the mixed solution is introduced into each CRP pack. Binary codes printed on each CRP are read by the fill station's electronic devices to determine which diluent to use for a given CRP pack. After filling, the CRPs move on to the heaters, and the BSPs are placed in the output tray.
Heaters. In the heaters, the CRP pack is warmed to 37°C, and this temperature is maintained until the end of the process.
Breaker-mixer 1. In this station, four plastic reagent capsules are ruptured, and their contents are mixed with the diluted sample (Fig. 11.6).
Delay stations. As the CRP pack sequentially passes through five waiting stations, chemical reactions take place in it between the first four reagents, the diluting solution, and the sample.
Breaker-mixer 2. In this station, the three remaining reagent caps ules are opened, and their contents are added to the reaction mixture. For some tests, a certain delay is provided at this stage, allowing the chemical reactions to go to completion before the CRP enters the photometric unit. This delay is determined from the binary code indicating the type of test, which is read at the fill station.
Photometer. In the photometric unit, a special press converts the CRP's plastic envelope into a cuvette. In the process, the pressure in the plastic pack is measured, and the measurement result is used to deter-
mine whether the correct amount of sample and diluent was introduced into the CRP. If the pressure is too low, the test results are marked with the symbol «P» (from the word pressure, pressure). The CRP's binary code is read again, after which the photometer control circuit selects the measurement method, filter type, and ADC parameters.
The ACA uses one of three measurement methods: kinetic, two-filter, and two-cassette (with two CRPs). To determine the concentration of the analyte by the kinetic method, the absorbance of light in the cuvette is measured twice. The time interval between the measurements is strictly fixed. Under the two-filter method, the absorbance is measured with two different light filters. The concentration of the analyte is proportional to the difference between the absorbance values obtained. When working by the two-cassette method, at one and the same wavelength the difference in light absorbance is determined for a mixture of the analyte and the reagents of two different CRPs. The photometer's output signal is converted to the digital form specified by the photometer controller and sent to the printer.
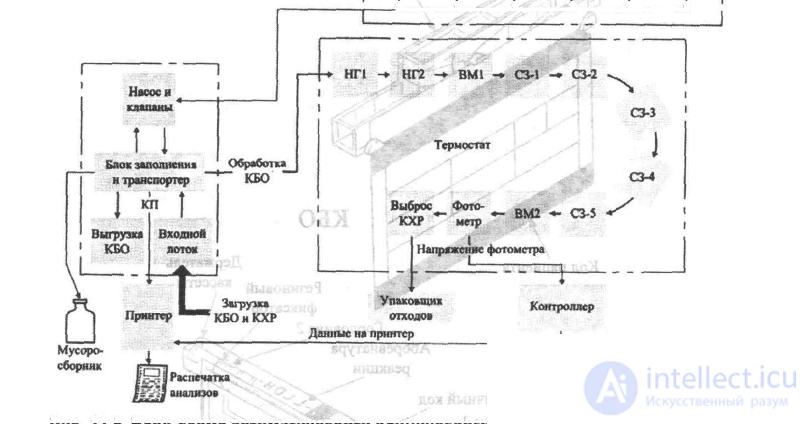
Fig. 11.5 Block diagram of the Automatic Clinical Analyzer (ACA). BSP = biological sample pack. CRP = chemistry reagent pack. Dil. = diluent, Heat. = heater, BM = breaker-mixer, DS = delay station. PC = patient code.
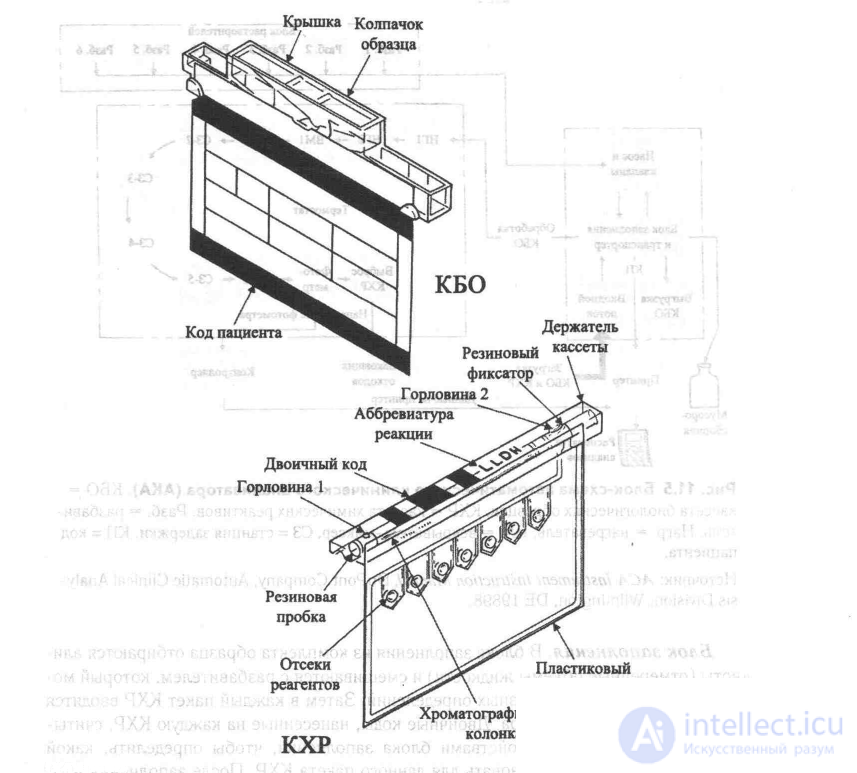
+Fig. 11.6 Biological sample pack (BSP) and chemistry reagent pack (CRP) of the Automatic Clinical Analyzer (ACA).
Chromatology is a group of methods intended for separating mixtures of substances into components. Note that although the term «chromatography» is already firmly established, its
продолжение следует...
Часть 1 16 Equipment for Analyses
Часть 2 Gas-liquid chromatographs - 16 Equipment for Analyses

Comments