
Lecture
Any measuring medical system contains, at the very least, some of the functional blocks shown in fig. 1.1. In this figure information propagates from left to right. The elements and connections shown by dashed lines are not essential. The main difference between a measuring medical system and other measuring systems is that in the former case the source of the signal is living biological tissue, or energy applied to the tissue and transformed by the processes taking place within it.
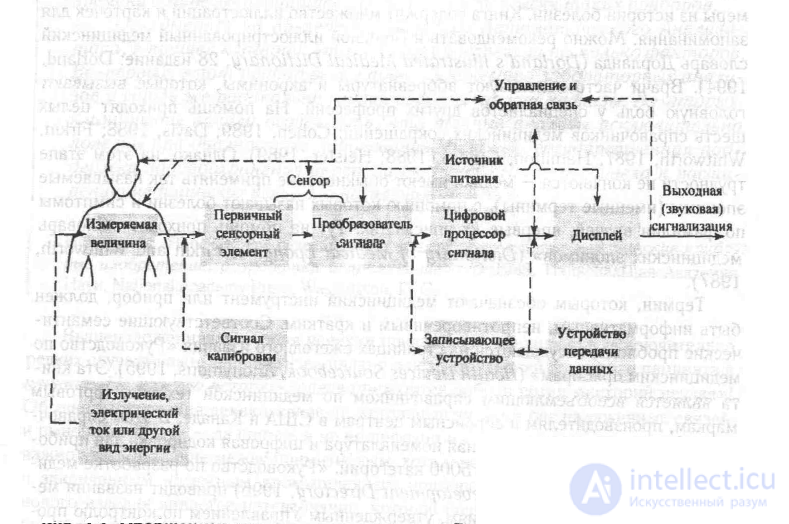
Fig. 1.1 Generalized measuring system. The sensor converts energy or information from the object being measured.
The term «measurand»» (measurand) denotes that which the system measures – a physical quantity, property or state. The accessibility of the measured quantity is an important circumstance, since it may be associated with physical processes inside the body (blood pressure), on the surface of the body (ECG), or outside it (infrared radiation). In addition, the source of the signal may be a tissue sample taken from the body (for example, a blood sample or biopsy material). The most important measurands measured by medical instruments can be grouped into the following categories: biopotentials, pressure, flow, dimensions (imaging), displacement (velocity, acceleration, force), impedance, temperature, metabolite concentrations. Each measurand
can be linked to a particular organ or anatomical structure.
Sensor
In general, the terms «sensor» or «primary sensing element» denote elementary devices that convert one form of energy into another. The term «transducer» denotes a more complex device in which the measured quantity is converted into an electrical signal. The transducer must respond only to the form of energy associated with the measured quantity. The transducer is the «interface» with the biological system, and it must draw a minimum of energy from it and inflict minimal injury on it. Many transducers contain primary sensing elements, such as a membrane, that convert pressure into displacement. The transducer then performs a graded (proportional) conversion of displacement into an electrical signal, carried out by strain gauges mounted on the membrane. In some cases the sensitivity of the transducer can be adjusted over a wide range by replacing the primary sensing element. Many graded primary sensing elements (such as strain gauges) require a supply of electrical energy, which makes it possible to obtain an electrical signal at the output of the transducer.
As a rule, the electrical signal generated by the sensor cannot be fed directly to the recording device. Before that, the sensor signal must be «conditioned», that is, converted. Simple converters amplify and filter the signal, or simply match the impedances of the sensor output and the input of the monitor. Modern practice is to convert the sensor output into digital form, after which the digital signal is processed by a specialized digital device or computer. An example of a converter is a filter that suppresses parasitic electrical interference that has entered the sensor output. In addition, the converter may average several signals of the same type, thereby reducing electrical noise. Finally, the converter can radically change the form of the sensor signal, translating it from the time domain into the frequency domain (for example, by means of a Fourier transform).
Output display
The measurement results must be displayed in a form that is understandable to the operator. The best ways of displaying data may be their digital
Limitations of medical measurements
Many of the most important parameters of a living system are not accessible to direct measurement, since it is impossible to «connect» a sensor without damaging the living organ. Unlike many of the most complex physical systems, in a biological system it is often impossible to «switch off» or «disconnect» a component part, which would be necessary for interfacing the sensor and the object of measurement. Even in cases where it is possible to protect the measurement process from interference from certain organs (for example, filtering out ECG signals when measuring a myogram), the excessively large size of many sensors does not allow them to be connected to the object of measurement. In such cases, quantities not accessible to direct measurement can be measured indirectly. When measuring signals under conditions of interference, it is necessary to correct the data obtained — for example, by filtering them or by other methods of mathematical processing during data analysis. An example of indirect measurement is the ECG, during the recording of which it is not possible to place the electrodes directly on the heart.
Quantities recorded during measurements on humans or animals are rarely constant and deterministic. Many parameters change over time even when all the possible factors affecting the measurement result are standardized. For example, a spread of data is observed even when recording physiological parameters in healthy subjects under the same conditions. Variability of the measured parameters is a characteristic feature of a biological object, traceable at different levels — from macromolecules to the whole organism. In many cases, individual anatomical features correspond to external, obvious differences in patients' parameters. The considerable spread of values obtained in physiological measurements is partly explained by the interaction of various systems of the living organism. Numerous feedback loops are constantly «switched on» between physiological systems, and many of them are insufficiently studied. In rare cases, when measuring a particular parameter it is possible to neutralize or at least estimate the interference from neighboring systems. The most general «remedy» for the variability of physiological characteristics is statistical methods of analysis, based on an assumption about the character of the distribution of the measured quantities. In this case the results of individual measurements are compared with physiological norms.
Practically all biomedical measurements are associated with the delivery of energy to living tissue — either from a dedicated source or from the sensor. In X-ray analysis, ultrasound imaging, and Doppler ultrasound measurements of blood flow, external (separate from the sensor) sources of energy are used that act on living tissue. It is rather difficult to determine a safe level of energy delivered to the body in such measurements, since the mechanisms of tissue damage and recovery have not been sufficiently studied. The fetus at early stages of development should be considered especially vulnerable. Care must be taken not to overheat biological tissue, since even reversible physiological processes caused by overheating can degrade the measurement results. Remarkably, even small flows of energy can cause damage at the molecular level.
The operation of instruments in a medical institution imposes additional constraints on them. The equipment must be reliable, easy to operate, and resistant to physical loads and to the action of corrosive agents. In addition, electronic instruments should be designed in such a way as to minimize the possibility and consequences of electric shock. Issues of patient and medical staff safety must be kept in view at every stage of the development and testing of the apparatus.
An important role in the design of nonstandard equipment for medico-biological experiments is given to the choice of the information-processing method.
At present a fairly large number of methods and algorithms for processing electrophysiological signals are known, which can mainly be divided into three large groups.
1. The first group includes methods and algorithms based on the analysis of the structure of the signals under study (the duration and amplitude of the waves and their various segments, asymmetry, area, the «raggedness» and «sharpness» of the waves, the frequency with which the waves cross certain fixed signal levels, in particular the so-called zero line (isoline), the wave repetition frequency, calculated from fixing the times at which the minima or maxima of the waves occur, etc.)
Methods and algorithms have been developed that make it possible to extract informative features that characterize various structural properties of the time components of the signals under study. The process of extracting indicators that characterize the structure of wave signals is based on direct measurements of the time and amplitude characteristics of the characteristic points of the signals or their derivatives (minima, maxima, inflection points, crossings of given amplitude levels, etc.), with the possible calculation of the simplest computational relations to obtain derived parameters. In order to increase the reliability of the measurements, preliminary filtering and averaging of the characteristics under study over several waves are used. Sometimes, together with filtering, special techniques are used to detect and remove artifacts, for example by passing the signal under study through a level discriminator.
The most widespread of these methods is the method of periodometric analysis and some of its variants, in which the extraction of features for classification is based on fixing the points where the curve under study and its derivatives cross the isoline, and on calculating the mean values and the variance of the values of the time samples. Berg, the developer of the method of periodometric analysis, maintained that analysis of the periods gives almost the same information as exact analysis of the signals. There are known works describing practical classification problems using features extracted on the basis of periodometric analysis.
Among the merits of the periodometric method are, undoubtedly, its simplicity and low cost of implementation, which makes it possible to develop various technical means and special computing devices based on simple operational automata and microprocessors, which are currently finding wide application in medical practice. However, this type of analysis also has a number of potential drawbacks:
— the zero-level crossing frequencies for signals of different types may turn out to be identical;
— only the periodometric properties of the signal are registered, whereas, as is known, in a number of cases the amplitude and planometric characteristics, asymmetry indicators, and a number of others are informative;
— oscillations above and below the isoline are not detected until the crossing frequencies of the isoline by one or several derivatives are determined;
— drift of the isoline introduces a substantial error into the measurement results;
— the crossing frequencies for the first and second derivatives can be heavily contaminated with noise;
— extraction of the various time components and parameters of transient processes is not provided.
The listed drawbacks explain the fact that, despite the enormous number of studies carried out in the direction of using periodometric analysis, in a large number of cases the results obtained cannot be considered satisfactory.
As informative features characterizing signals of a more complex statistical nature (such as electroencephalograms, electromyograms, galvanic skin responses, etc.), the current value of the signal amplitude modulus, the variance of the mean value of the modulus, the wave asymmetry coefficient, the wave flat-topness coefficient, the «raggedness» coefficient, the waveform parameter, the mapping of the structural properties of the signal onto the phase plane, and the like are used.
The complexity of the functioning of biological systems and the large amount of information contained in electrophysiological signals (EPS) do not make it possible to unambiguously link the values of individual signal parameters with diagnostic medical conclusions. Therefore, the next step in the processing of EPS is the search for complex indicators that depend on a number of measured elementary features, or symptom complexes — combinations of features (feature vectors) — that would make it possible to increase the reliability of the results obtained. Here one of the most popular approaches has become one based on applying the methods of pattern recognition theory, in which, at the training stage, a data set is formed from the set of features in the form of special tables indicating which diagnostic class a given set of parameters belongs to. Next, with the help of special mathematical techniques, a decision rule is found that makes it possible to distinguish the entries of the tables of different classes. At the classification stage, the decision rules assign a feature vector to one of the classes identified at the training stage.
+It should, however, be noted that the success of solving the classification problem with such an approach strongly depends on whether it is possible to find such sets of informative features, extracted from the PS, that allow sufficiently reliable decision rules to be constructed. For example, the practice of using this approach for signals of a more complex statistical nature (such as EEG, EMG, etc.) has shown that satisfactory results have been obtained only for a very narrow class of problems. For example, it is possible to solve the particular problem of determining a treatment strategy for patients with epilepsy at early stages of the onset of the disease, but tumor processes, various types of mental disorders, subtle changes in a person's functional state, etc. are poorly diagnosed. This is primarily due to the fact that, for example, for a signal such as the EEG there is not sufficiently definite information either about the composition or about the significance of the features in an EEG recording, and there is no unified approach to the structure and evaluation of combinations of these features.
Among the approximation methods, known ones include those that use spline approximation, approximation by polynomial, trigonometric, and exponential models. The parameters of the models can be determined, for example, by the method of singular analysis, by the method of autocorrelation and cross-correlation analysis.
Methods of spectral analysis have become fairly widespread; the simplest of them makes it possible to extract various frequency components of the signals under study by passing them through a system of bandpass filters with a known passband. Among these methods of EPS analysis, various variants of classical spectral analysis, based on the Fourier, Walsh, Hartley, and other transforms, have become widespread. Good results have been obtained in this direction for some particular problems. However, researchers who actively use spectral-analysis methods for processing complex signals note that reliable results can be obtained only for a rather limited range of problems. Such limitations are usually attributed to the complex, nonstationary nature of the processes under study, to the insufficiently studied types of nonstationarity, and also to the fact that in medical applications the power spectrum is rarely the final result, since the user is usually interested in other parameters, characterizing mainly the features of the observed half-waves of the signals under study. Although approaches to processing random nonstationary processes are currently known, including the application of spectral-analysis methods, they are poorly developed as applied to extracting informative features from a signal such as an electroencephalogram or electromyogram.
From the point of view of computational procedures, the extraction of informative features by spectral-analysis methods (with the exception of using bandpass filters to extract various frequency components) appears to be a fairly labor-intensive task. Therefore, practical implementation requires either the use of specialized computing means, or sufficiently powerful microcomputers or general-purpose computers, possibly with specialized signal processors, for example the KR 1815 series.
For electrophysiological signals possessing significant nonstationarity (for example, in the analysis of spikes or «sharp» waves in signals), elements of nonstationarity can sometimes be easily detected «by eye». For example, the clearly visible spike-and-wave complex during a brief epileptic seizure has a clearly expressed shape. A similar situation arises in identifying evoked potentials as a response to an external stimulus. However, often, with predominant background noise, that is, a low signal-to-noise ratio, nonstationary activity is difficult to distinguish.
Nonparametric methods for detecting nonstationarities are usually based on directly computing, from the EEG signal record, quantities such as derivatives, durations, and amplitudes. Certain mathematical functions of these quantities are also used to detect nonstationary components.
Known methods of processing nonstationary signals are based on the use of matched filters. In this case the waveform must be known, which is a limiting factor, since waveforms can differ considerably between different people and even for one and the same person. It is very difficult to predict in advance the waveform out of the whole variety of signals encountered.
3. The third group of methods is concerned with assessing the degree of «similarity» (synchrony) of the course of electrophysiological processes in different leads, different segments of one and the same process, or in different areas of the body. Methods of correlation analysis and various measures of closeness of the processes studied have found application for these purposes. A number of works note that the use of correlation-analysis methods in solving problems of processing electrophysiological signals is hampered by the fact that reliable results are obtained mainly in the case of studying stationary processes. The form of the correlation functions in its complexity often reaches the complexity of the signal under study. In solving practical problems, the need often arises to clarify the question of which properties or parameters of the signal are responsible for the disruption of the correlation relationship. A direct analysis of the correlation function, in the general case, does not provide an answer as to the cause of the signal mismatch.
+For all the variety of methods and algorithms for the automated processing of electrophysiological signals, in a whole range of problems they are significantly inferior in diagnostic value to the conclusions given by experienced electrophysiologist specialists. Therefore, in some modern systems, the same information that electrophysiologist physicians use in their practical work is extracted from the electrophysiological signals, and then corresponding decision rules are implemented, modeling the logic of medical decision-making. These are mainly rules of a production type, implemented in accordance with crisp and fuzzy logic.
The far from complete list of methods for processing electrophysiological signals considered in this section makes it possible to draw the conclusion that, for their implementation, they require a very broad range of technical means of various types and purposes, from the simplest electronic circuits to complex computing systems and expert systems.

Comments