Lecture
The ratio of the annual increase in the number dX of a certain population to its total number X is called the coefficient of increase in the population r. With a constant value of this value over the entire period of time, the law of growth is linear and leads to an exponential dependence
 (one)
(one)  - the length of time, X 0 - the initial value of the population size.
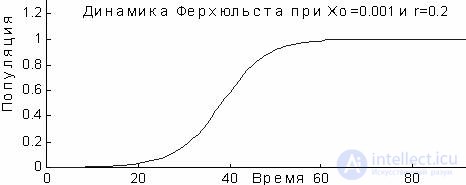
With the coefficient r = 5% = 0.05, the population doubles its number every 14 years. However, for growth there are always limits and dependence (1) is valid for limited periods of time. Growth restrictions were formulated by PF Verhulst in 1845: any ecological niche is able to ensure the existence of a population of only a certain size X, and the growth rate should decrease as the population size approaches X. In other words, the variable coefficient r made the process non-linear. It took more than a hundred years before they realized the resulting unusual consequences. In particular, when growth parameters exceed 200%. With a small population size, its growth leads to an increase in the optimal size, this causes a response, and the population decreases to values of smaller X, then steady oscillations appear between large and small size.
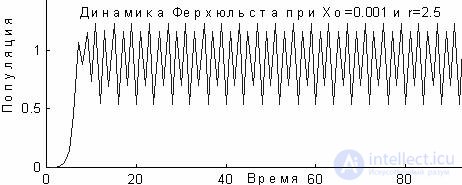
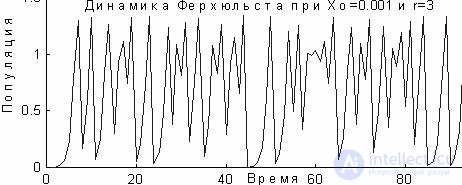
When the growth parameter exceeds 245%, the fluctuations become more and more complicated, the process comes to steady periodic oscillations and further to chaos. This means that the system is out of control, and it is impossible to predict its behavior for a long time. Consequently, the Ferhulst dynamics allow us to find a scenario in which order turns into chaos. This problem requires a more consistent study of the population growth model.
We use the method of analysis considered before and construct a model for the growth of a population [15].
Let x 0 be the initial population size, and x n its population after n years. The growth rate R, by definition, is a relative change in the number of 1 year
 . (2)
. (2) Suppose that R = r is a constant, and we formulate the law of growth dynamics following from (2)
After n years, the population size will be equal to
As mentioned above, in order to limit this number (exponential growth), Verhulst forced the growth rate r to change and be proportional to (1 - x n ), i.e., he assumed that
When x n <1, the population grows, and when x n = 1, the growth stops. From (3) and (4) follows the law governing the dynamics of the process
For x 0 = 0 and x 0 = 1 there is no population growth. Indeed, with x 0 = 0, the population is simply absent, and with x 0 = 1, from (5) it follows that x 1 = (1 + r) -r = 1, that is, there is also no growth. However, if the initial number is at least slightly different from zero, 0 <x 0 <1, then for r> 0, the number x 1 will increase in a year: x 1 > x 0 + rx 0 . Subsequent values of x 1 , x 2 , ... grow until they reach one.
See how small deviations change.  n = x n -1; for this we linearize (5)
 n ) -r (1+
  n ) 2 = 1+
  n (1-r) + r
  n 2 .
n 2 . Denote  n = 1 = x n + 1 -1 and linearize the last expression
 n + 1 ~ (1 + r)
  n (6)
n (6) It can be seen that for 0 <r <2 in absolute value  n + 1 less than
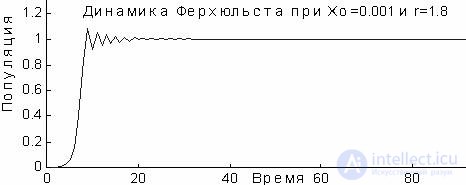
  n . Above was given a graph of the change in time of the population for the case of r = 1.8 and the initial value x 0 = 0.001. The value of x initially grows, since it is less than 1, but at the third step, its value slightly exceeds x 0 = 0.1, then decreases in accordance with (6):
  n + 1 = -0.8
  n , and the process approaches the final state x = 1.
However, when r> 2, relation (6) predicts an increase in deviations  n , and the equilibrium state x = 1 is already unstable. From the graph it can be seen that the process at r = 2.5 starts to oscillate periodically between two levels.
As r increases, analysis of relation (5) gives the following result: for r = 2.5, a broken line is obtained, that is, the process moves to stable periodic oscillations with a period of 4, with a further increase in r, the oscillation periods double. Finally, at r = 2.572, the process ceases to be periodic at all, jumps, and, despite initial determinism, it cannot be predicted for long periods of time. Such behavior is called chaotic, the graph is built for x 0 = 0.001 and r = 3.
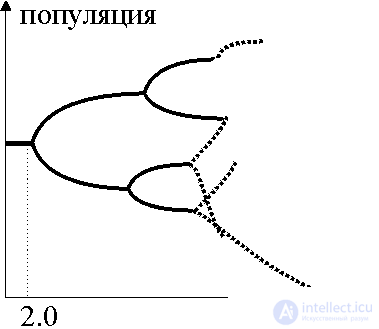
In the case of the Ferhulst process, all possible types of behavior can be represented using the bifurcation diagram, which reflects the dependence of the population dynamics on the parameter r. In the process of calculations, we found the features of the transition period and noted the asymptotic value of x, i.e., we went to the attractor. It consists of one point with r <2, two points with 2 <r <2.449, then from 4, 8, 16, ... points up to chaos, where the points of the attractor fill in whole bands.
An accurate analysis of the bifurcation points in the Ferhulst process in 1977 revealed a remarkable pattern. It concerns the lengths of intervals at which periodic motion with a certain interval is stable. These intervals are reduced with each doubling of the period, and the multiplier characterizing the reduction
 .
. This number is called the "Feigenbaum number".
This discovery caused a great activity of scientists. It is shown that the period doubling scenario is observed both in a turbulent fluid flow, and in nonlinear oscillations in electrical circuits, and in physiology (transition from a normal cycle to fibrillation)
Comments
To leave a comment
Synergetics
Terms: Synergetics