Lecture
The IS-LM model is a model of joint equilibrium of the commodity and money markets. It is a model of Keynesian type (demand-side), describes the economy in the short term, and serves as the basis of the modern theory of aggregate demand.
The IS-LM model was developed by the English economist John Hicks in 1937 in the article “Keynes and Neoclassicals” and became widespread after the publication in 1949 of the book by the American economist Alvin Hansen “Monetary theory and fiscal policy” (therefore, the model is sometimes called the Hicks model Hansen).
The IS (investment-savings) curve describes the equilibrium of the commodity market and reflects the relationship between the market interest rate R and income level Y that arise in the market for goods and services. The IS curve is derived from the simple Keynesian model (the equilibrium model of total expenditures or the Keynesian cross model), but differs in that part of total expenditures and, above all, investment expenditures now depend on the interest rate.
The interest rate ceases to be an exogenous variable and becomes an endogenous quantity determined by the situation in the money market, i.e. inside the model itself. The dependence of a part of total expenses on the interest rate results in the fact that for each interest rate there is an exact value of the equilibrium income value and therefore an equilibrium income curve for the commodity market - the IS curve can be constructed. Equality of investments and savings is observed at all points of this curve (and in a broader sense, the equality of the sum of injections to the sum of withdrawals), which explains the name of the curve (Investment = Savings).
The LM (liquidity-money) curve characterizes the equilibrium in the money market, which exists when the demand for money (primarily due to the absolute liquidity of cash) is equal to the money supply. Since the demand for money depends on the interest rate, there is an equilibrium curve of the money market - the LM curve (Liquidity preference = Money supply), each point of which is a combination of the values of income and interest rates, providing monetary equilibrium.
The intersection of the equilibrium curves of the commodity (IS) and money (LM) markets provides the only values of the interest rate R (equilibrium interest rate) and income level Y (equilibrium income level), providing simultaneous equilibrium in these two markets.
The IS-LM model allows you to: 1) show the relationship and interdependence of the commodity and money markets; 2) to identify factors affecting the establishment of equilibrium in each of these markets separately, and the conditions of their simultaneous equilibrium; 3) to consider the impact of changing equilibrium in these markets on the economy; 4) to analyze the effectiveness of fiscal and monetary policy; 5) derive the function of aggregate demand and determine the factors affecting aggregate demand; 6) to analyze the variants of stabilization policy at different phases of the economic cycle.
The IS-LM model preserves all the prerequisites of a simple Keynesian model:
1) the price level is fixed (P = const) and is an exogenous value, therefore, the nominal and real values of all variables coincide;
2) aggregate supply (output) is completely elastic and is able to satisfy any amount of aggregate demand;
3) income (Y), consumption (C), investment (I), net exports (X) are endogenous variables and are determined within the model;
4) government spending (G), money supply (M), tax rate (t) are exogenous values and are formed outside the model (set from outside);
5) GNP = NNP = ND, since only households pay taxes and there are no indirect taxes on business. The exception is the premise of constant interest rates. If in the “Keynesian cross” model the interest rate is fixed and acts as an exogenous parameter, in the IS-LM model it is endogenous and is formed inside the model; its level changes and is determined by the change in the situation (equilibrium) in the money market. Planned autonomous costs now depend on the interest rate.
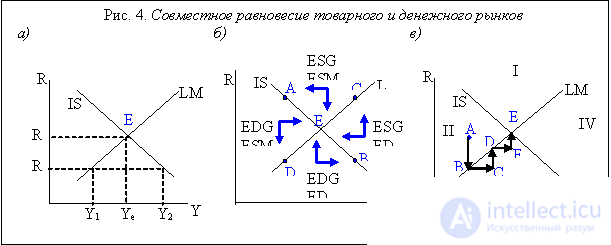
Neither the IS curve nor the LM curve do not themselves determine the value of the equilibrium income Y e and the equilibrium interest rate R e . The balance in the economy is determined jointly by the IS and LM curves at the point of their intersection (Fig. 4. (a)).
Simultaneous equilibrium in the money and commodity markets exists only at single values of income (Y e ) and interest rates (R e ) (Fig. 4. (a)) Other values of interest rates and income mean imbalance in one or both markets. For example, at the interest rate R 1, the equilibrium in the money market will be established at the income level Y 1 (the intersection of the R 1 line with the LM curve), but in the commodity market at this interest rate the equilibrium exists at the income level of 2 (the intersection of the R 1 line with the IS curve ).
The equilibrium position of both markets can be determined by jointly solving the equations of the IS and LM curves. For example, in fig. 4. (b), at points A and B there is an equilibrium in the commodity market (demand for goods = supply of goods), since they lie on the IS curve, and at points C and D, there is an imbalance. On the contrary, points C and D correspond to the equilibrium in the money market (demand for money = money supply), since they are on the LM curve, and points A and B - to imbalance. General equilibrium is a situation of simultaneous equilibrium in the commodity and money markets in the economy, which exists at point E (Fig. 4. (a) and 4. (b)). The value of the equilibrium income Y e (Fig. 4. (a)), corresponding to the simultaneous equilibrium of the commodity and money markets (and, consequently, the securities market, ie the financial market as a whole) Keynes called "the value of effective demand".
How does a system come to general equilibrium if it is in disequilibrium? If the market for goods and services is in disequilibrium, then there is an unforeseen change in stocks, and firms either reduce or increase production, moving the economy to point E. If the money market is in disequilibrium, there will be pressure on the interest rate and it will grow with excess demand for money, because people will start selling bonds, if they cannot satisfy their demand for money by other means, or buy bonds, if the money supply exceeds the demand for them, and the economy starts to move to point E.
The intersection of the IS and LM curves divides the plane into 4 regions (Fig. 4. (b)), in each of which there is a disequilibrium. In areas I and II, there is an excess money supply, as they are above the LM curve, and in areas III and IV, lying below the LM curve, there is an excess demand for money. At the same time, areas I and IV correspond to the oversupply of goods and services, since they are above the IS curve, while in areas II and III there is an excess demand for goods and services.
The directions of adaptation of the economy and its movement towards equilibrium are shown by arrows. If there is an excess supply of goods in the commodity market, the stocks of firms will increase, and the value of output (income) Y will decrease (horizontal arrows to the left in areas I and IV towards the IS curve). With excess demand for goods, stocks of firms are reduced, and output increases (horizontal arrows to the right in areas II and III towards the IS curve). When there is an excess money supply in the money market, people buy bonds, the demand for which increases and therefore the price rises, which leads (due to the inverse relationship between the price of the bond and the interest rate in accordance with the theory of liquidity preference) to a decrease in the interest rate (vertical arrows down towards the LM curve in areas I and II). When there is excess demand for money, on the contrary, people will start selling bonds in order to receive cash in exchange in the conditions of their shortage, which will lead to an increase in the supply of bonds, a decrease in their price and, accordingly, an increase in the interest rate (vertical arrows downward towards the curve LM in areas III and IV). It should be borne in mind that the equilibrium in the money market is restored more quickly, since it is enough to change the structure of the asset portfolio, which does not require a considerable amount of time, while it takes a long time to change the value of output.
Taking this circumstance into account, we will consider the economic mechanism of achieving equilibrium if the economy is in disequilibrium, for example, at point A (Fig. 4. (c)). This point is located in area II, where there is excess money supply and excess demand for goods and services. The excess of the money supply over the demand for money will cause a decrease in the interest rate as a result of people's desire to turn "extra" money into securities and, therefore, an increase in the demand for bonds and an increase in their prices. An equilibrium is established in the money market at point B on the LM curve. But the existing excess demand for goods and services in this area will lead to a decrease in stocks among firms and an increase in output (income), which will cause imbalance in the money market and shift the economy to area III (point C), corresponding to the excess demand for money, which will lead to growth interest rates and return on the LM curve. However, the continuing excess demand in the commodity market, despite the possible reduction in investment demand caused by the increase in interest rates, will provide a further reduction in stocks and an increase in production.
The money market will be out of balance (there will be excess demand for money due to income growth), which will cause the interest rate to rise and return the economy on the LM curve to the point .D that lies below the IS curve and corresponds to the still excessive demand for goods and services. As a result of further reduction of stocks and production growth, the economy will move to t. F, again breaking the equilibrium of the money market, etc., until it comes to the equilibrium point E. Thus, the economy will move as if along a staircase (along the steps) until will not fall into the point of simultaneous equilibrium of the commodity and money markets - the point of intersection of the IS and LM curves.

Comments
To leave a comment
Macroeconomics
Terms: Macroeconomics