Lecture
Inflation ("inflation" - from the Italian word "inflatio", which means "bloating") is a steady upward trend in the general price level.
The following words are important in this definition:
The opposite process of inflation is deflation - a steady downward trend in the general price level. There is also the concept of disinflation (desinflation), which means reducing the rate of inflation.
The main indicator of inflation is the rate (or level) of inflation (rate of inflation), which is calculated as a percentage of the difference in price levels of the current and previous year to the price level of the previous year:

where P t is the general price level (GDP deflator) of the current year, and P t - 1 is the general price level (GDP deflator) of the previous year. Thus, the inflation rate indicator characterizes not the growth rate of the general price level, but the growth rate of the general price level.
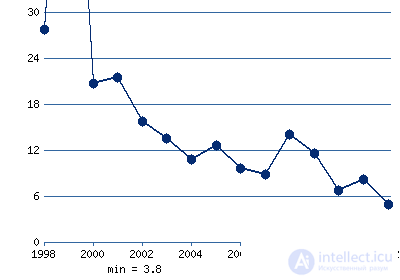
Source - CIA World Factbook
View data on inflation in Russia in the form of a table
View data on inflation in other countries of the world.
The increase in the price level leads to a decrease in the purchasing power of money. Under the purchasing power (value) of money, they understand the amount of goods and services that can be bought for one monetary unit. If the prices of goods increase, then you can buy less goods for the same amount of money than before, so the value of money falls.
Depending on the criteria, there are different types of inflation. If the criterion is the rate (level) of inflation, then allocate: moderate inflation, galloping inflation, high inflation and hyperinflation.
• Moderate inflation is measured by interest per year, and its level is 3-5% (up to 10%). This type of inflation is considered normal for the modern economy and is even considered a stimulus for increasing output.
• Galloping inflation is also measured by interest per year, but its rate is expressed in double digits and is considered a serious economic problem for developed countries.
• High inflation is measured by percent per month and can be 200-300% or more percent per year (note that the calculation of inflation for the year uses the formula of "compound interest"), which is observed in many developing countries and countries with transitional economies.
• Hyperinflation, measured by interest per week and even per day, the level of which is 40-50% per month or more than 1000% per year. The classic examples of hyperinflation are the situation in Germany in January 1922- December 1924, when the growth rate of the price level was 1012 and in Hungary (August 1945-July 1946), where the price level for the year increased 3.8 * 1027 times, with an average monthly increase in 198 times.
If the criterion is the forms of manifestation of inflation, then there are: explicit (open) inflation and suppressed (hidden) inflation.
• Open (explicit) inflation is manifested in the observed increase in the general price level.
• Suppressed (hidden) inflation occurs when prices are set by the state, and at a level lower than the equilibrium market (established by the ratio of supply and demand in the commodity market) (Fig. 1.). The main form of hidden inflation is the shortage of goods.
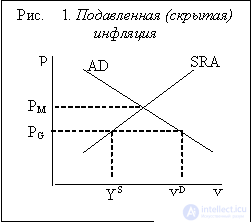
PM is the equilibrium market price at which demand is equal to supply, PG is the price set by the state, YS is the value of aggregate output (the amount of products that are produced and offered for sale by manufacturers), YD is the value of aggregate demand (the amount of products you would like to buy consumers). The difference between YD and YS is nothing but a deficit. The main form of hidden inflation is the shortage of goods. The deficit is a form of manifestation of inflation, since one of the characteristic features of inflation is a decrease in the purchasing power of money. Lack of money means that money does not have purchasing power at all, because a person cannot buy anything from them.
There are two main causes of inflation:
1) an increase in aggregate demand and 2) a decrease in aggregate supply. In accordance with the reason for the rise in the general price level, there are two types of inflation: demand inflation and cost inflation.
• If the cause of inflation is the growth of aggregate demand, then this type is called demand-pull inflation.
Growth in aggregate demand may be caused by either an increase in any of the components of total expenditures (consumer, investment, government, and net exports) or an increase in the money supply.
The majority of economists (especially representatives of the monetarist school) consider the increase in the money supply (money supply) to be the main cause of demand inflation, coming to this conclusion from an analysis of the equation of the quantity theory of money (also called the exchange equation or the Fisher equation). As noted by the head of monetarism, the famous American economist, the Nobel Prize winner Milton Friedman: "Inflation is always and everywhere a purely monetary phenomenon."
Recall the equation of the quantity theory of money: M * V = P * Y, where M (money supply) is the nominal money supply (the mass of money in circulation), V (velocity of money) is the velocity of money circulation (the value that shows how many the average annual turnover is made by one monetary unit, for example, 1 ruble, 1 dollar, etc., or how many transactions a single monetary unit serves on average per year), P (price level) - price level and Y (yield) - real output (real GDP).
The product of the price level by the value of real output (P * Y) is the value of nominal output (nominal GDP). The velocity of money practically does not change and is usually considered a constant value, therefore an increase in the money supply, i.e the growth of the left side of the equation leads to the growth of its right side. Growth in the money supply leads to an increase in the price level in the short-term period (since, in accordance with modern concepts, the aggregate supply curve has a positive slope) (Fig. 2. (a)) and in the long-term period (which corresponds to the vertical aggregate supply curve) (Fig. 2. (b)). At the same time, in the short run, inflation is combined with the growth in real output, and in the long run, real output does not change and is at its natural (potential) level.
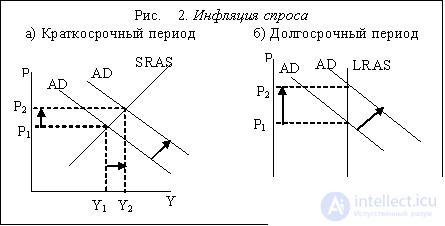
In the long term, the principle of money neutrality is manifested, meaning that a change in the money supply does not affect real indicators (the value of real output has not changed and remains at the level of Y *) (Fig. 2. (b)) .
The exchange equation can be represented in a tempo record (for small changes in its values):
 ,
,
where (deltaМ / Мx 100%) is the growth rate of the money supply, usually denoted m, (deltaV / Vx100%) is the growth rate of the velocity of circulation of money, (deltaP / P x 100%) is the growth rate of the price level, t. e. inflation rate pi, (deltaY / Y x 100%) is the growth rate of real GDP, denoted by g.
Since it is assumed that the velocity of circulation of money practically does not change, then by regrouping the equation, we get: pi = m - g, i.e. the inflation rate is equal to the difference in the growth rate of the money supply and the real output. From this we can conclude, which is called the “monetary rule”: for the price level in the economy to be stable, the government must maintain the growth rate of money supply at the level of average real GDP growth rates.
The question arises: why do governments (especially in developing countries and countries with economies in transition) increase the money supply, imagining the negative consequences of this process? The fact is that the issue of money is carried out in order to finance the state budget deficit, which is an explanation for the increase in the growth rate of the money supply and the main cause of high inflation in developing countries and countries with economies in transition.
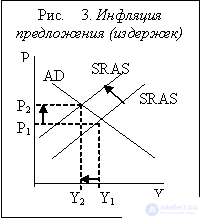
• If inflation is caused by a reduction in aggregate supply (which occurs as a result of increased costs), then this type of inflation is called cost-push inflation. Cost inflation leads to a situation of stagflation that is already known to us — a simultaneous decline in production and an increase in price levels (Fig. 3.)
As a result of a combination of demand inflation and cost inflation, an inflationary spiral arises (Fig. 4.). Suppose that the central bank increased the money supply, which leads to an increase in the growth of aggregate demand. The aggregate demand curve AD1 shifts to the right to AD2. As a result, the price level increases from P1 to P2, and since the wage rate remains the same (for example, W1), real incomes fall (real income = nominal income / price level, therefore the higher the price level, the lower the real incomes). Workers demand higher wage rates in proportion to the price level (for example, to W2). This increases the costs of firms and leads to a shift in the aggregate supply curve of SRAS1 left-up to SRAS2. The price level will increase to P3. Real income will fall again (W2 / P3
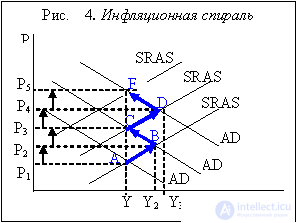
Workers will again begin to demand a nominal wage increase. At first, workers usually perceive its growth as an increase in real wages and increase consumer spending. Aggregate expenditures grow, the aggregate demand curve shifts to the right to AD3, the price level rises to P4. At the same time, the costs of firms grow, and the aggregate supply curve shifts left-up to SRAS3, which leads to an even greater increase in the price level to P5.
The fall in real income leads to the fact that the workers are again beginning to demand higher wages and everything is repeated again. The movement goes in a spiral, each turn of which corresponds to a higher price level, i.e. a higher rate of inflation (from m. A to B, then to C, then to D, then to F, etc.). Therefore, this process is called the inflationary spiral, or wage-price spiral. The increase in the level of prices provokes a rise in wages, and a rise in wages leads to higher prices.
Comments
To leave a comment
Macroeconomics
Terms: Macroeconomics