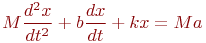
(3.1)
where  – the deviation of the proof mass M from the equilibrium position;
  – the damping coefficient due to damping;
  – the stiffness coefficient of the elastic element;
  – the current acceleration of the object on which the accelerometer is mounted.
The damper is usually adjusted so that the damping coefficient reaches a critical value. In this case, the response time of the accelerometer to a change in acceleration turns out to be the smallest, and even with a step change in acceleration  , oscillations around the new equilibrium position do not arise. To determine the acceleration
  , it is sufficient to measure the deviation
  from the equilibrium position or the force
  , which acts on the elastic element.
Thus, the proof mass M provides for the conversion of the primary information signal in the form of linear acceleration into mechanical displacement or into the deforming force on the elastic element. The elastic element ensures linearity, or at least a one-to-one correspondence, of the conversion. And the damper prevents the occurrence of prolonged oscillatory processes. It turns out that all of them are necessary constituent elements of the accelerometer.
Fig. 3.3 shows the design of a capacitive accelerometer, manufactured using MST. In silicon crystal 1, sections 2 are etched away so that a substantial proof mass 3 is mechanically separated from the other parts of the accelerometer. It is connected to them only by thin bridges 4, which play the role of elastic elements. At a small distance (~ 10 µm) from the silicon crystal, above and below, metal electrodes 5 and 6 are located. The role of the damper is played by a viscous non-conductive liquid, which fills the space between the electrodes and the silicon.
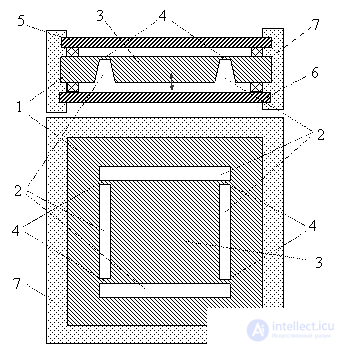
Fig. 3.3. Design of a capacitive accelerometer
In such a design, proof mass 3 can move only vertically. The electrical capacitances between it and the upper (lower) electrodes are connected in opposite arms of an AC bridge circuit. It is balanced so that, in the absence of acceleration, the output signal equals zero. When the object on which the accelerometer is mounted moves with acceleration directed along the axis of the sensor, proof mass 3 is displaced from the equilibrium position, as a result of which one of the capacitances increases while the other decreases. Because of the resulting imbalance, a voltage of the corresponding sign appears at the output of the bridge circuit, and the greater it is, the greater the acceleration. The bridge circuit, the necessary electronic switches, amplifiers, temperature-compensation elements – everything required for signal processing and calibration of the accelerometer – is nowadays formed by MST (microsystem technology) methods on the same silicon crystal.
In the design of the accelerometer described above, the acceleration, which is here the primary information signal, is first converted into linear displacement of the proof mass. The displacement, in turn, is converted into a change in the capacitance of the upper and lower capacitors, and the latter – into an electrical signal.
In piezoresistive accelerometers it is not the linear displacement of the inertial mass that is measured, but the force acting on the elastic element. To measure this force, silicon piezoresistors are formed in the elastic elements.
Angular accelerometers
To measure angular accelerations, a rotor 1 with a sufficiently large moment of inertia (Fig. 3.4) relative to the axis of rotation 2 is required. This rotation must be opposed by an elastic torsion element 3, which creates a moment of force proportional to the twist angle. A damper is also needed to dissipate the energy of the resulting torsional oscillations. Then, when an angular acceleration of the controlled object arises in the direction of the accelerometer's axis, rotor 1, under the action of the moment of inertia, turns through a certain angle.
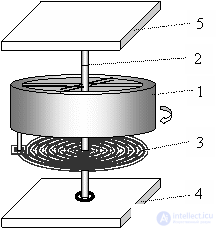
Fig. 3.4. Mechanical diagram of an angular accelerometer: 1 - rotor; 2 - axis of rotation; 3 - elastic element; 4 - lower support; 5 - upper support
The rotation of the rotor is described by a differential equation analogous to (4.1), in which the mass must be replaced by the moment of inertia of the rotor, the linear displacement  by the angle of rotation, and the linear acceleration – by the angular acceleration. The role of the damper is played by an adjustable moment of friction forces between the rotor axis and the supports. By measuring the twist angle or the moment of force on the elastic element, the magnitude of the angular acceleration can be determined.
With the use of microsystem technologies, angular accelerometers are nowadays also made in a microminiature design.
3.5 Vibration measuring sensors
In these sensors, the primary information signal is a change in the state of mechanical oscillations of a body or a system of bodies. Mechanical oscillatory systems can be very sensitive to various influencing factors, which is exploited in building vibration sensors.
The section "Electrical sensors" discussed methods for exciting undamped mechanical and electrical oscillations of a piezoelectric crystal by synchronous energy pumping, for example through a transistor using positive feedback. These oscillations occur at the crystal's own resonant frequency, which usually lies in the range of units to tens of megahertz and depends on its geometric dimensions and mass. If the latter change, the oscillation frequency changes too.
To compensate for the influence of temperature changes and other disturbances, two identical piezoelectric vibrators are installed side by side. One of them – the reference one – remains free of the influence, while the controlled factor acts on the other. To determine the magnitude of this factor's influence, the difference between the oscillation frequencies of the measuring and reference vibrators is measured. It is practically independent of temperature changes and of other extraneous disturbances that affect the frequency of both vibrators equally.
Most often, the influencing factor is the addition of a small mass to the piezoelement, the magnitude of which needs to be determined. In that case, such a vibration sensor works as microscales, whose sensitivity is on the order of 1 microgram. The change in frequency (in Hz) over the operating interval is usually described by the formula
where  – the initial oscillation frequency (MHz);
  – the mass increment (g);
  – the electrode area of the piezocrystal (cm2).

(3.3)
If the dimension is given in the International System of Units SI, then the following formula must be used: 
where  – in Hz;
  –in kg;
  – in m2.
If a specific receptor layer – a thin film of a material that selectively adsorbs (attaches) molecules of some gas – is applied to the surface of two piezoelectric crystals, and one of the crystals is brought into contact with the atmosphere, then as a result of adsorption of molecules of the corresponding gas the mass of that crystal increases slightly. The frequency of its natural oscillations changes accordingly. By measuring the difference in oscillation frequencies, one can determine the specific content of the corresponding gas in the atmosphere. For example, if a thin film of gold is applied to the surface of the crystal, the sensor becomes sensitive to the presence of mercury vapor in the surrounding atmosphere. If mercury vapor is present, its atoms are adsorbed by the gold film, forming an amalgam. The mass of the film increases slightly, which can be detected from the change in the frequency of the piezocrystal's mechanical and electrical oscillations. Naturally, the mass of adsorbed vapor depends on the specific content of the corresponding gas in the monitored medium and on the "exposure" time.
Cantilevers
With the use of modern microsystem technologies, mechanical oscillatory systems can now be made in astonishingly small sizes. Especially popular in this area have become the so-called cantilevers (cantilever) – elastic long beams fixed at one end, resembling in shape the diving boards from which athletes jump into water. As an example, Fig. 3.5 shows three cantilevers 1, formed by MST methods in a silicon crystal 2.
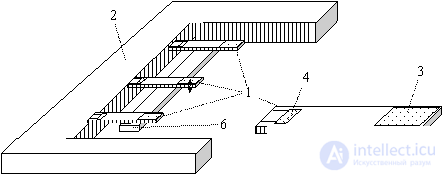
Fig. 3.5
Example of the design of silicon cantilevers: 1 - cantilevers; 2 - main body of silicon; right – enlarged image of a cantilever; 3 - sensitive zone; 4 - piezoresistor; 5 and 6 - electrodes for exciting and sustaining mechanical oscillations
On the right, one of the cantilevers is shown enlarged. On its upper surface a sensitive zone 3 and a piezoresistor 4 are formed, and below – electrode 5. To excite and sustain undamped mechanical oscillations of the cantilevers 1, electrostatic forces are usually used, created by applying an alternating voltage between the cantilever and the excitation electrode 6, formed on a silicon substrate.
. The necessary positive feedback is provided by piezoresistors 4, formed near the fixed end of the cantilever, where the greatest deformations are concentrated. The mechanical oscillations are automatically maintained at the resonant frequency of the cantilever's free oscillations. This frequency is usually a few megahertz. Excitation and sustaining of undamped mechanical oscillations of cantilevers can also be carried out by other methods: magnetic, electromagnetic, etc.
A "receptor layer" is applied to the sensitive zone 3 – a coating selectively sensitive to a controlled chemical substance or to a particular protein, virus, or other analyte. If this analyte is present in the medium the cantilever is in contact with (gas, liquid), some of its atoms (molecules, particles) chemically bind to the sensitive coating 3. Because of the resulting slight change in mass, the frequency of the cantilever's mechanical oscillations changes. The frequency of the signals from piezoresistor 4 changes accordingly. These signals are picked up and processed by electronic circuits formed in the same silicon crystal. Since the cantilever's own mass is very small and even very slight frequency changes are detected, the sensitivity of such vibration sensors turns out to be quite high.
Vibration analyzers
Not only piezocrystals, membranes, and cantilevers have their own resonant frequency. Every mechanical structure has its own resonant frequencies, its own characteristic oscillatory properties. And with any mechanical damage or deformation, the pattern of their natural oscillations changes. This creates a fundamental possibility of detecting undesirable changes and defects that have appeared in a structure from changes in the pattern of mechanical oscillations. The scientific and technical discipline concerned with this is called vibration diagnostics, and the instruments for measuring and analyzing mechanical oscillations are called vibrometers and vibration analyzers.


3.6 Chromatographic sensors
When it is necessary to find out or monitor the chemical composition of a mixture of substances with fairly close physical and chemical properties, the method of chromatography is now widely used. We classify chromatographic sensors as mechanical because in them the primary signals arise from the mechanical movement of molecules of the corresponding substances relative to a stationary base (phase). The classic implementation of this method is shown schematically in Fig. 3.6 on the left.
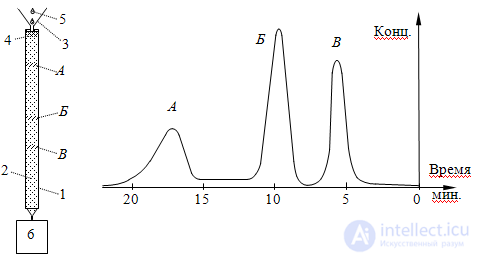
Fig. 3.6. The chromatography method. Left: 1 – chromatographic column; 2 – sorbent; 3 – funnel; 4 – mixture of substances; 5 – addition of liquid; 6 – analyte quantity detector; right – view of a chromatogram
A sample of the controlled mixture 4 is introduced through funnel 3 into chromatographic column 1, filled with sorbent 2. Liquid 5 is then added little by little, which dissolves and carries along mixture 4 and begins to seep down through sorbent 2.
Suppose the mixture consists of substances A, B and C, and they bind somewhat differently to sorbent 2 and to liquid 5 flowing down through the column. Then the rate of transport of these substances down along column 1 turns out to be somewhat different. And as they move, they gradually separate in space. Substance C, whose bond with liquid 5 is strongest compared to its bond with sorbent 2, advances the fastest and reaches the end of the column first. At the outlet of column 1, detector 6 is installed, with which the amount of substance leaving the column per unit time is determined. Substance B comes out next, and last of all – substance A, whose bond with liquid 5 is weakest compared to its bond with sorbent 2.
At the detector 6 outlet, the dependence of the amount of substance leaving the column on time is recorded. It is customarily called a chromatogram. For the example under consideration, it is shown in Fig. 3.6 on the right. The chromatogram clearly shows the number of components in the controlled mixture and its relative composition. For reliability, the chromatographic column is pre-calibrated against the components of interest to the user by passing mixtures of precisely known composition through the column beforehand. The greater the length of the column, the more the components of the mixture are separated, and the higher the resolving power of the chromatographic method. However, this also increases the analysis time.
The variant of the method described is called "column" chromatography. Other variants of chromatographic separation of substances are known: on filter paper or on fabric, in thin layers of sorbent applied to some base, in capillaries.

Exercise 3.1. Sketch a diagram of the basic mechanical scheme of an accelerometer measuring linear acceleration. Explain the purpose of all the main elements of this scheme. Write the differential equation of motion of the inertial mass.
Exercise 3.2. Using formula (3.3), calculate:
Variant 1. The change in oscillation frequency of a quartz piezoelement when its mass increases by 1 microgram, if the frequency of its free oscillations is 4.5 MHz and the electrode area is S cm2.
Variant 2. The mass of the sample on quartz microscales, if the oscillation frequency of the piezoelement changed from 4.80 MHz to 4.72 MHz with an electrode area of 0.3 cm2.
Variant 3. The theoretical sensitivity of the microscales, if the electrode area of the piezoelement is reduced to 5 × 5 mm2, and a frequency change of 10 Hz from the initial 4.5 MHz is recorded.
Where: S1=1.6 cm2.; S2= 0.8 cm2. ; S3=0.4 cm2.
Lectures and tutorial on "Sensors"



 – the coefficient of elasticity,
  – the applied force,
  – the length of the unloaded spring,
  – the amount of extension or compression of the spring.
 – the mass of the hydrometer,
  – the acceleration of gravity,
  – the density of the liquid,
  – the volume of the part of the hydrometer submerged in the liquid.
 , capillary tubes are used, in which the height of the rise or fall of the liquid column h is determined by the value of the surface tension and the density
  of the liquid:
 – the diameter of the capillary,
  – the acceleration of gravity.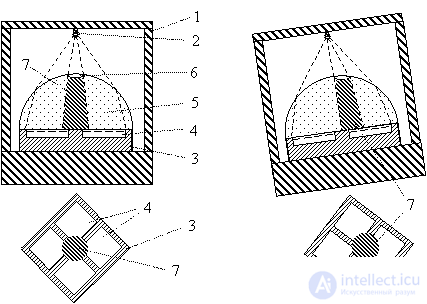
 concentric tracks with transparent and opaque sections are marked out.. Light passes freely through the transparent sections of the tracks and, upon reaching the corresponding photodetectors, causes a "1" signal to appear at the outputs of the corresponding amplifiers. Light does not pass through the opaque sections of the tracks, and "0" signals are formed at the outputs of the corresponding amplifiers.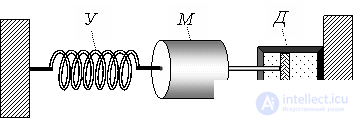


Comments