
Lecture
Benford's law, also known as the law of first digits (the Newcomb–Benford Law (NBL),), is a statistical law that describes the distribution of first digits (1-9) in a set of numbers occurring in various real-world data. This law states that in most data sets, the first digits tend to be distributed not uniformly, but according to a certain logarithmic law.
According to Benford's law, in data sets describing various phenomena, such as financial data, scientific constants, city populations, river lengths, etc., the probability that the first digit is 1 is about 30%, while the probability that the first digit is 9 is only about 5%.
The law holds true for many such distributions, but not for all. It also makes a number of predictions about the frequency of occurrence of the second and third digits.
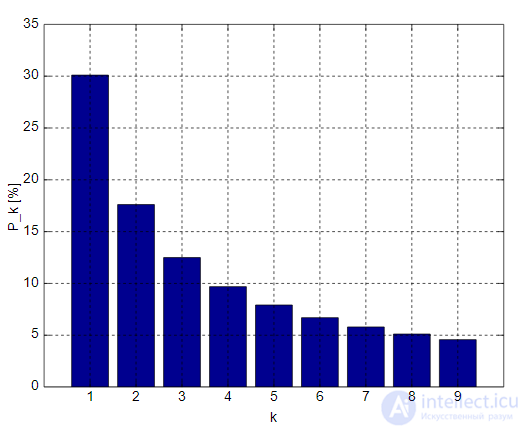
Benford's distribution. Horizontally — the first significant digits, vertically — the probability of their occurrence
The law, discovered by Frank Benford, looks like this: if we have a number base b (b > 2), then for a digit d (d ∈ {1, …, b − 1}) the probability of being the first significant digit is

This is exactly the distance between d and d+1 on a logarithmic scale with base b.
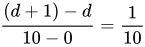
For a uniform distribution, if you have the digits 1, 2, 3, 4, 5, 6, 7, 8, 9, 0 (=10), then you have 10 segments (from 0 to 1, …, from 8 to 9, from 9 to 10). Note that all segments lie in the range [0, 10]. For the segment [d, d+1] a uniform distribution should be proportional to its length, that is, the length of the segment [d, d+1], that is (d+1)-d, divided by the length of the segment [0, 10], which equals 10.
 .
.
If the logarithms are continuously distributed, you must take the logarithm of the number before considering the segments. For logarithms we consider segments from 1 to 10 (since log100 has no meaning). In this case you will have the intervals from log101 to log102, …, from log108 to log109, from log109 to log1010. All segments lie in the interval [log101, log1010]=[0, 1]. The length of the latter equals 1. So, considering the segment [d, d+1] on the ordinary scale, on the logarithmic scale the uniform distribution will be proportional to its length, that is:
 .
.
The table below shows the first-digit probability values found by Benford for the decimal number system.
| d | 1 | 2 | 3 | 4 | 5 | 6 | 7 | 8 | 9 |
| p | 30.1 % | 17.6 % | 12.5 % | 9.7 % | 7.9 % | 6.7 % | 5.8 % | 5.1 % | 4.6 % |
The distribution depends only on the number system, but not on the unit of measurement. In other words, if tons are converted to pounds, and square kilometers — to acres, the distribution will not change.
This manifestation of the law was first noticed by the American astronomer Simon Newcomb in 1881. He noticed that books containing logarithm tables were worn out where the logarithms of numbers beginning with one were found, and were intact for numbers beginning with 9.
This phenomenon was rediscovered by the physicist Frank Benford in 1938. Benford analyzed about 20 tables, among which were data on the drainage basin area of 335 rivers, the specific heat capacity and molecular weight of thousands of chemical compounds, and, among others, the house numbers of the first 342 streets listed in a directory. Analysis of the numbers showed that the digit one is the first significant digit with a probability not of 1/9, as one would expect, but of about 1/3.
Subsequently, Benford's law received its explanation — it applies to sets of numbers that can grow exponentially (in other words, the growth rate of a quantity is proportional to its current value,  ). For example, these include electricity bills, stock quantities in warehouses, stock prices, population figures, mortality rates, river lengths, country areas, and the heights of the tallest structures in the world.
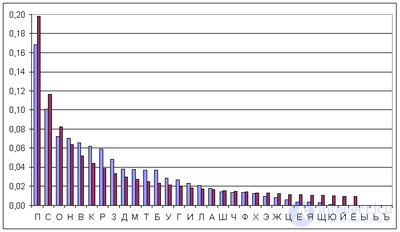
Comparison of Benford's distribution (red) with the distribution of first letters in Russian-language words (blue). Horizontally — the first significant letters, vertically — the probability of their occurrence.
The law generally does not hold for distributions with set minimum or maximum values (a list of companies with revenues from 50,000 to 100,000 dollars). Distributions covering only one or two orders of magnitude (adult IQ) are also not suitable. Benford's law does not apply to a set of letters (fig.). The volume of data must be sufficient for the application of statistical methods.
Benford's law can be explained in different ways.
The exact form of Benford's law can be explained by assuming that the logarithms of numbers are uniformly distributed; for example, the probability of finding a number between 100 and 1000 (logarithm between 2 and 3) is the same as between 10,000 and 100,000 (logarithm between 4 and 5). For many sets of numbers, especially those with exponential growth, such as incomes or stock market prices, this is a reasonable assumption.
For example, if a quantity increases continuously and doubles every year, then it will be twice its initial value after one year, four times its initial value after two years, eight times its initial value after three years, and so on. When this quantity reaches a value of 100, it will have the significant digit 1 throughout the year, reaching 200 by the end of the first year. During the following year, the value will increase from 200 to 400; the significant digit will be 2 (the value will be from 200 to 300) for a little over seven months (remember, we are dealing with exponential growth, that is, from 200 to 300 the function grows «more slowly» than from 300 to 400) and 3 for the remaining five months. In the third year, the significant digit will pass through the values 4, 5, 6, and 7, spending less and less time to reach the next digit, reaching 800 by the end of that year. At the beginning of the fourth year, the significant digit will pass from 8 to 9. The significant digit will become 1 again when the value reaches 1000 and everything starts over; it will take a year to double the value from 1000 to 2000. This example demonstrates that data tables that include measurements of exponentially growing quantities will be consistent with Benford's law. However, this law also holds in many cases where exponential growth is not obvious.
This law can alternatively be explained by the fact that if it is indeed true that the first digit has a particular distribution, then it should not depend on the units in which it is measured. This means that when converting, for example, feet to yards (multiplication by a constant), the distribution should remain unchanged — this is scale invariance, and the only continuous distribution that satisfies this requirement is the one in which the logarithm is uniformly distributed.
For example, the first (non-zero) digit of the length or distance of an object should have the same distribution regardless of whether the measurement is made in feet, yards, or something else. But there are three feet in a yard, so the probability that the first digit of a length in yards is 1 should be the same as the probability that the first digit of a length in feet is 3, 4, or 5. Applying this to all possible measurement scales gives a logarithmic distribution, and given that log10(1) = 0 and log10(10) = 1, this gives Benford's law. That is, if there is a first-digit distribution that does not depend on the units of measurement, the only possible first-digit distribution is the one that obeys Benford's law.
For numbers drawn from a specific distribution, for example, IQ values, people's heights, or other variables subject to a normal distribution, the law does not hold. However, if you «mix» numbers from a set of such distributions, for example, taking numbers from newspaper articles, Benford's law reappears. This can also be proven mathematically: if you repeatedly «randomly» choose a probability distribution and then randomly choose a number according to that distribution, the resulting list will obey Benford's law
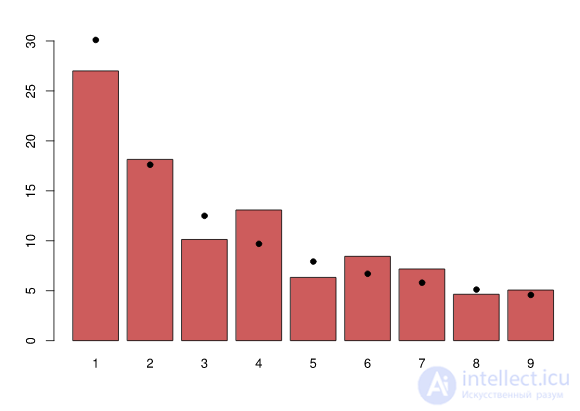
Distribution of the first digits of the population of 237 countries of the world. The black dots — Benford's distribution.
In the list of heights of the 58 tallest structures in the world in their category (as of September 2010), the digit «1» occupies the first position much more often than the digit «9», regardless of the unit of measurement:
| First digit | Meters | Feet | ||
|---|---|---|---|---|
| Count | % | Count | % | |
| 1 | 27 | 47.4 % | 13 | 22.8 % |
| 2 | 8 | 14.0 % | 8 | 14.0 % |
| 3 | 7 | 12.3 % | 8 | 14.0 % |
| 4 | 5 | 8.8 % | 3 | 5.3 % |
| 5 | 2 | 3.5 % | 14 | 24.6 % |
| 6 | 3 | 5.3 % | 5 | 8.8 % |
| 7 | 2 | 3.5 % | 3 | 5.3 % |
| 8 | 3 | 5.3 % | 1 | 1.8 % |
| 9 | 0 | 0.0 % | 2 | 3.5 % |
This law is based on the logarithmic nature of many processes and phenomena, which leads to smaller numbers having a higher probability of being the first digit than larger numbers. Benford's law is often used to verify the authenticity of data and to detect anomalies in accounting reports, tax returns, and other numerical data. If, despite meeting the parametric requirements, real-world data sets do not conform to Benford's law in the sense that the number of occurrences of a certain digit deviates significantly from what is expected under Benford's law, then the investigator subjects those data sets, beginning with that digit, to further scrutiny. deeper analysis, to find the cause(s) of these discrepancies. This quick procedure can lead to a deeper understanding of the characteristics of the data set under study, or to the detection of manipulation during the creation of the data.
However, it should be noted that Benford's law is not always applicable and is not an absolute constant. In some cases, data may diverge from this law due to the specifics of particular processes or data manipulation. Checking data distribution against Benford's law is used to detect malicious data manipulation, including for detecting:
harvest results
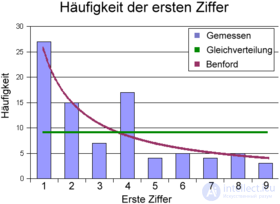
Distribution of first digits in a table of 87 numbers (see text)
The table shows the results of the 2002 harvest. In the chart, the blue bars indicate the frequency of occurrence of the first digits out of 87 recorded numbers. Benford's distribution is shown by the red line. It reflects the distribution much better than a uniform distribution (green line). Despite the small sample, a preference for small first-digit values is recognizable, as is the tendency for the second digit.
The table summarizes the results. The 1st digit column shows how often the digit appears in the first position, the Benford column shows how often it is expected there according to Benford's distribution. The same applies to the number of numbers with a digit in the second position in the 2nd digit column. Thus the number 1 appears in the first position 27 times, 26.19 times were expected. The number 4 appears first 17 times; according to Benford, it should occur on average 8.43 times.
As the digit's place value decreases, the Benford distribution shown above increasingly approaches a uniform distribution of digits.
| digit | 1st digit | Benford | 2nd digit | Benford |
|---|---|---|---|---|
| 0 | — | — | 9 | 10.41 |
| 1 | 27 | 26.19 | 17 | 9.91 |
| 2 | 15 | 15.32 | 9 | 9.47 |
| 3 | 7 | 10.87 | 11 | 9.08 |
| 4 | 17 | 8.43 | 5 | 8.73 |
| 5 | 4 | 6.89 | 9 | 8.41 |
| 6 | 5 | 5.82 | 7 | 8.12 |
| 7 | 4 | 5.05 | 8th | 7.86 |
| 8th | 5 | 4.45 | 7 | 7.62 |
| 9 | 3 | 3.98 | 5 | 7.39 |
| total | 87 | 87 |
Benford's law is used to detect fraud when preparing balance sheets, falsification of accounts, and generally for the rapid detection of glaring accounting irregularities. Benford's law was used to expose a surprisingly «creative» accounting system at Enron and Worldcom, through which management defrauded investors of their investments (→ white-collar crime). Today accountants and tax investigators use methods based on Benford's law. These methods form an important part of the mathematical-statistical methods that have been used for several years to detect accounting fraud, tax fraud and investor fraud, as well as data fraud in general. It has furthermore been shown that the first digits of market prices also obey Benford's law.
Benford's law can also help detect data falsification in science. It was data sets from the natural sciences that led to Benford's law. Karl-Heinz Tödter of the research center of the Deutsche Bundesbank used the same law to review the results of 117 economic papers in an article for the German Economic Review.
Political scientists have used Benford's law to study the results of several federal elections (from 1990 to 2005) at the district level and occasionally (4 cases in 1500 tests) found significant irregularities concerning the first vote. When checking the second vote, that is, direct party-list elections, irregularities were found in 51 of 190 tests. According to the study's author, Achim Görres, this result is not a sign of manipulation.
Evidence of possible falsification of the 2009 presidential election in Iran was also found.
Other experts believe that Benford's law has limited applicability when studying elections.
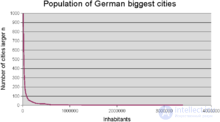
Distribution of the sizes of major German cities
The figure on the right shows the population of the 998 largest cities in Germany. Benford's analysis gives the following frequencies of initial digits:
| digit | Measured | Expected |
|---|---|---|
| 1 | 340 | 300.4 |
| 2 | 320 | 175.7 |
| 3 | 133 | 124.7 |
| 4 | 87 | 96.7 |
| 5 | 50 | 79.0 |
| 6 | 24 | 66.8 |
| 7 | 20 | 57.9 |
| 8th | 12 | 51.1 |
| 9 | 12 | 45.7 |
The frequency of the digits 3 and 4 corresponds to the mathematical expectation. On the other hand, the digit 1 appears more often. The deviation of digit 2 is particularly pronounced, at the expense of digits 7, 8, and 9, which are notably rarely observed.
Again, this example shows that records must meet certain requirements to qualify for the NBL; this is not the case in the present data set. The reason for this is the restriction to cities; the distribution of all municipalities should lead to a more precise match. In addition, there is a natural minimum settlement size, and the merging of municipalities also affects the distribution. Curiously, even about 50% of the examples that Benford cited in his publication as evidence of the NBL belong to the class of data sets whose initial digits are not Benford-distributed, but at most have an approximately similar distribution of initial digits.

Comments