
Lecture
In examining this example we will use fictitious data so that the reader can carry out the necessary calculations independently.
So, suppose that during a study the influence of drug A on the content of substance B (in mmol/g) in tissue C and the concentration of substance D in the blood (in mmol/l) was studied in patients divided by some characteristic E into 3 groups of equal size (n = 10). The results of this fictitious study are given in the table:
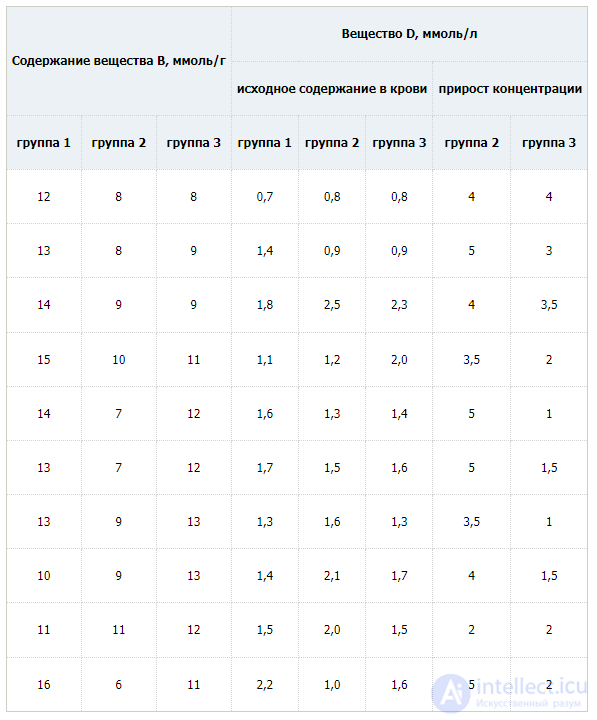
We would like to warn you that samples of size 10 are used here for simplicity of data presentation and calculation; in practice, such a sample size is usually insufficient for forming a statistical conclusion.
As an example, let us consider the data in the 1st column of the table.
The arithmetic mean, which is very often simply called the «mean», is obtained by adding up all the values and dividing this sum by the number of values in the set. This can be shown using an algebraic formula. A set of n observations of variable x can be represented as x1, x2, х3, ..., xn
Formula for determining the arithmetic mean of the observations  (pronounced «x-bar»):
= (Х1 + Х2 + ... + Xn) / n
= (12 + 13 + 14 + 15 + 14 + 13 + 13 + 10 + 11 + 16) / 10 = 13.1;
One way of measuring the spread of the data is to determine the degree of deviation of each observation from the arithmetic mean. Obviously, the greater the deviation, the greater the variability of the observations. However, we cannot use the mean of these deviations as a measure of spread, because positive deviations offset negative deviations (their sum equals zero). To solve this problem, we square each deviation and find the mean of the squared deviations; this quantity is called the variation, or variance. Take n observations x1, x2, х3, ..., xn, whose mean equals  . We calculate the variance, usually denoted as s2, of these observations:
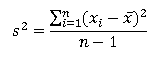
The sample variance of this indicator equals s2 = 3.2.
The standard (root-mean-square) deviation is the positive square root of the variance. For n observations this looks as follows:
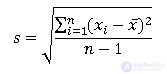
We can think of the standard deviation as a kind of average deviation of the observations from the mean. It is calculated in the same units (dimensions) as the original data.
s = sqrt (s2) = sqrt (3.2) = 1.79 [sqrt (x) - the function of extracting the square root of x].
If you divide the standard deviation by the arithmetic mean and express the result as a percentage, you obtain the coefficient of variation.
CV = (1.79 / 13.1) * 100% = 13.7
1.79 / sqrt (10) = 0.57 [sqrt (x) - the function of extracting the square root of x];
Used to test the hypothesis that the mean value  differs from some known value m
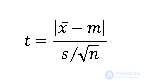
The number of degrees of freedom is calculated as f=n-1.
In this case the confidence interval for the mean lies between the bounds 11.87 and 14.39.
For a confidence level of 95% m=11.87 or m=14.39, that is = |13.1-11.82| = |13.1-14.38| = 1.28
Accordingly, in this case for the number of degrees of freedom f = 10 - 1 = 9 and a confidence level of 95%, t=2.26.

Comments