
Lecture
Statistics forms the foundation of data science, or of any analysis for that matter. A good knowledge of statistics can help an analyst make correct business decisions.
On one hand, descriptive statistics helps us understand data and its properties using central tendency and variability. On the other hand, inferential statistics helps us draw conclusions about the properties of a population from a given data sample. Knowledge of both descriptive and inferential statistics is important for a beginner data scientist or analyst.
To help you improve your knowledge of statistics, we conducted this practical test. The test briefly covered both descriptive and inferential statistics. I am giving the answers with explanations in case you got stuck on certain questions.
If you missed the test, try to solve the questions before reading the solutions.
Below are the distribution scores; they will help you assess your performance.
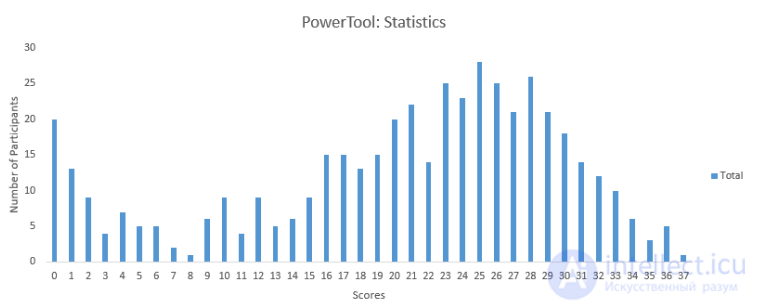
You can see the final results here. More than 450 people took this test, and the highest score was 37. Here are some statistics about the distribution.
Mean score: 20.40
Median score: 23
Mode score: 25
1) Which of these measures are used to analyze the central tendency of data?
A) Mean and normal distribution
B) Mean, median and mode
C) Mode, Alpha and Range
D) Standard deviation, range and mean
E) Median, range and normal distribution
Solution: (B)
Mean, median, and mode are three statistical measures that help us analyze the central tendency of data. We use these measures to find the central value of the data in order to summarize the entire data set.
2) Given five numbers: (5, 10, 15, 5, 15). Now, what will be the sum of the deviations of the individual data points from their mean?
A) 10
B) 25
C) 50
D) 0
E) None of the above
Solution: (D)
The sum of individual deviations will always be 0.
3) A test is conducted annually. The mean score of the test is 150 and the standard deviation is 20. If Ravi's z-score is 1.50, what is his score on the test?
A) 180
B) 130
C) 30
D) 150
E) None of the above
Solution: (A)
X = μ + Zσ, where μ is the mean, σ is the standard deviation, and X is the score we are calculating. Therefore, X = 150 + 20 * 1.5 = 180
4) Which of the following measures of central tendency will always change when a single value in the data changes?
A) Mean
B) Median
C) Mode
D) All of these
Solution: (A)
The mean of a data set will always change if we change any value in the data set. Since we sum all the values together to obtain it, every value in the data set contributes to it. The median and mode may or may not change when a single value in the data set changes.
5) Below we have presented six data points on a scale, where the vertical lines on the scale represent units.
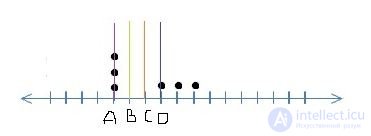
Which of the following lines represents the mean value of the given data points, where the scale is divided into equal units?
A) A
B) B
C) C
D) D
Solution: (C)
This is a bit tricky to visualize just by looking at the data points. We can simply substitute values to understand the mean. Let A equal 1, B equal 2, C equal 3, and so on. The shown data values become {1,1,1,4,5,6}, which will have a mean of 18/6 = 3, i.e. C.
6) If a positively skewed distribution has a median of 50, which of the following statements is true?
A) The mean is greater than 50
B) The mean is less than 50
C) The mode is less than 50
D) The mode is greater than 50
E) Both A and C
F) Both B and D
Solution: (E)
Below are the distributions for negatively skewed, positively skewed, and non-skewed curves.
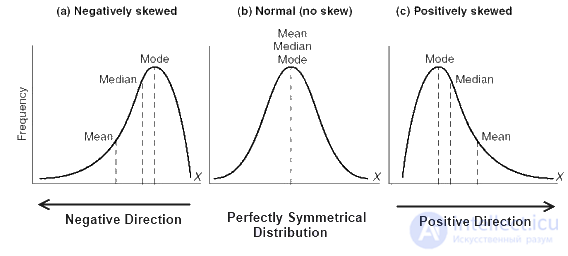
As we can see, for a positively skewed curve Mode < Median < Mean.
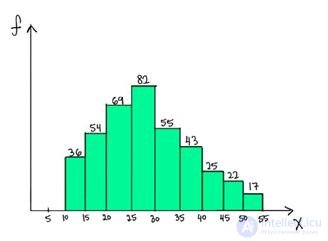
7) Which of the following is a possible value for the median of the distribution shown below?
A) 32
B) 26
C) 17
D) 40
Solution: (B)
To answer this question, we need to go back to the basic definition of the median. The median is the value that has approximately half of the values before it and half of the values after it. The number of values less than 25 is (36 + 54 + 69 = 159), and the number of values greater than 30 is (55 + 43 + 25 + 22 + 17 = 162). Thus, the median must lie somewhere between 25 and 30. Therefore, 26 is a possible value for the median.
8) Which of the following statements about Bessel's correction are true when calculating the sample standard deviation?
A) Only 2
B) Only 3
C) Both 2 and 3
D) Both 1 and 3
Solution: (C)
Contrary to popular belief, Bessel's correction should not always be applied. It is mainly applied when we are trying to estimate the population standard deviation using the sample standard deviation. The bias is definitely reduced, since the standard deviation now (after correction) will reflect the variance of the population more than the variance of the sample.
9) If the variance of a data set is correctly calculated using a formula with (n - 1) in the denominator, which of the following is true?
A) The data set is a sample
B) The data set is a population
C) The data set can be either a sample or a population
D) The data set is taken from a census
E) None of the above
Solution: (A)
If the variance has the value n-1 in the formula, this means that the set is a sample. We are trying to estimate the population variance by dividing the sum of squared deviations from the mean by n-1.
When we have actual population data, we can directly divide the sum of squared deviations by n instead of n-1.
10) [True or False] The standard deviation can be negative.
A) TRUE
B) FALSE
Solution: (B)
Below is the formula for the standard deviation.
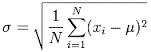
Since the differences are squared, summed, and then rooted, negative standard deviations are impossible.
11) Is the standard deviation robust to outliers?
A) True
B) False
Solution: (B)
If you look at the formula above for the standard deviation, a very high or very low value will cause an increase in the standard deviation, since it will differ greatly from the mean. Therefore, outliers will affect the standard deviation.
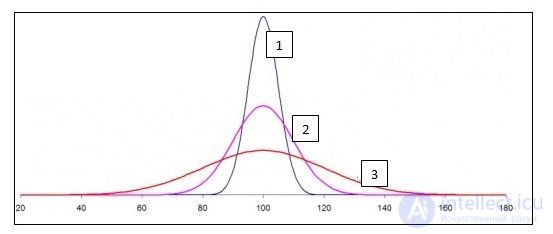
12) Which of the following is true for the normal distribution shown below?
σ1, σ2 and σ3 represent the standard deviations for curves 1, 2 and 3 respectively.
A) σ1> σ2> σ3
B) σ1 <σ2 <σ3
C) σ1 = σ2 = σ3
D) None
Solution: (B)
From the definition of the normal distribution, we know that the area under the curve equals 1 for all three shapes. Curve 3 is more spread out and therefore more dispersed (most values lie within 40–160). Therefore, it will have the highest standard deviation. Similarly, curve 1 has a very low range, and all values lie in a small range of 80–120. Therefore, curve 1 has the smallest standard deviation.
13) What will the critical Z values be for a 98% confidence interval for a two-tailed test?
A) +/- 2.33
B) +/- 1.96
C) +/- 1.64
D) +/- 2.55
Solution: (A)
To answer this question, we need to look at the z table. For a two-tailed test and a 98% confidence interval, we need to check the area before the z value as 0.99, since 1% will be to the left of the mean and 1% to the right. Therefore, we need to check the z value for the area > 0.99. The value will be +/- 2.33.
14) [True or False] The standard normal curve is symmetric about 0, and the total area under it equals 1.
A) TRUE
B) FALSE
Solution: (A)
By definition of the normal curve, the area under it equals 1 and it is symmetric about zero. The mean, median, and mode are equal and equal to 0. The area to the left of the mean equals the area to the right of the mean. Therefore, it is symmetric.
Context for questions 15-17
Studies show that listening to music while studying can improve your memory. To demonstrate this, a researcher collects a sample of 36 college students and gives them a standard memory test while they listen to background music. Under normal circumstances (without music) the resulting average score was 25, and the standard deviation was 6. The mean score for the sample after the experiment (i.e. with music) was 28.
15) What is the null hypothesis in this case?
A) Listening to music while studying has no effect on memory.
B) Listening to music while studying may worsen memory.
C) Listening to music while studying may improve memory.
D) Listening to music while studying will not improve memory, but may worsen it.
Solution: (D)
The null hypothesis is the commonly assumed statement that there is no relationship in the phenomena being measured. Here, the null hypothesis is that there is no relationship between listening to music and improved memory.
16) What would a Type I error be?
A) Concluding that listening to music while studying improves memory, and this being correct.
B) Concluding that listening to music while studying improves memory, when in fact it does not.
C) Concluding that listening to music while studying does not improve memory, but it does.
Solution: (B)
A Type 1 error means that we reject the null hypothesis when it is in fact true. The null hypothesis is that music does not improve memory. The Type 1 error is that we reject it and say that music does indeed improve memory, when in fact it does not.
17) After conducting a Z-test, what can we conclude ____?
A) Listening to music does not improve memory.
B) Listening to music significantly improves memory at p.
C) There is not enough information to draw a conclusion.
D) None of the above
Solution: (B)
Let's perform a Z-test for the given case. We know that the null hypothesis is that listening to music does not improve memory.
The alternative hypothesis is that listening to music improves memory.
In this case, the standard error, i.e. 
The Z-score for a sample mean of 28 from this population is

The critical Z value for α = 0.05 (one-tailed) will be 1.65, as seen from the z table.
Therefore, since the observed Z value is greater than the critical Z value, we can reject the null hypothesis and say that listening to music does indeed improve memory with 95% confidence.
18) Based on his analysis, a researcher concludes that a placebo cures AIDS. What error is he making?
A) Type 1 error
B) Type 2 error
C) None of these. The researcher is not making an error.
D) Cannot be determined
Solution: (D)
By definition, a Type 1 error rejects the null hypothesis when it is in fact true, while a Type 2 error accepts the null hypothesis when it is actually false. In this case, to determine the error we first need to define the null and alternative hypotheses.
19) What happens to the confidence interval when we introduce some outliers into the data?
A) The confidence interval is robust to outliers
B) The confidence interval will increase with the appearance of outliers.
C) The confidence interval will decrease with the appearance of outliers.
D) In this case we cannot determine the confidence interval.
Solution: (B)
We know that the confidence interval depends on the standard deviation of the data. If we introduce outliers into the data, the standard deviation increases, and therefore the confidence interval also increases.
Context for questions 20-22
A doctor wants to lower the blood sugar level of all his patients by changing their diet. He found that the mean sugar level of all patients is 180 with a standard deviation of 18. Nine of his patients switch to the diet, and the sample mean is 175. He is now considering recommending that all his patients switch to the diet.
Note: he is calculating a 99% confidence interval.
20) What is the standard error of the mean?
A) 9
B) 6
C) 7.5
D) 18
Solution: (B)
The standard error of the mean is the standard deviation divided by the square root of the number of values, i.e.
Standard error =  = 6
= 6
21) What is the probability of getting a mean of 175 or less after all patients start following the diet?
A) 20%
B) 25%
C) 15%
D) 12%
Solution: (A)
This actually wants us to calculate the probability that the population mean will be 175 after the intervention. We can calculate the Z value for the given mean.
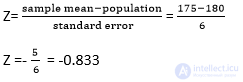
If we look at the z table, the corresponding value for z = -0.833 ~ 0.2033.
Therefore, there is about a 20% probability that if everyone starts the diet, the population mean will be 175.
22) Which of the following statements is true?
A) The doctor has strong evidence that the diet reduces blood sugar levels.
B) The doctor does not have enough evidence that following the diet reduces blood sugar levels.
C) If the doctor prescribes the same diet for all future patients, the average blood pressure will fall below 160.
Solution: (B)
We need to check whether we have enough evidence to reject the null. The null hypothesis is that the diet has no effect on blood sugar levels. This is a two-tailed test. The critical z value for a two-tailed test will be ± 2.58.
The z value, as we calculated, is -0.833.
Since the Z value < the critical Z value, we do not have enough evidence that the diet lowers blood sugar levels.
Context for question 23-25
A researcher is trying to study the effect of two different teaching methods. He divides 20 students into two groups of 10 each. For group 1, the teaching method uses fun examples. For group 2, the teaching method consists of using software to help students study. After a 20-minute lecture for both groups, all students take a test.
We want to calculate whether there is a significant difference in the scores of both groups.
It is given that:
23) What is the value of the t-statistic?
A) 3.191
B) 3.395
C) Cannot be determined.
D) None of the above
Solution: (A)
The t-statistic for a given group is nothing but the difference between the group means divided by the standard error.
= (10-7) /0.94 = 3.191
24) Is there a significant difference in the scores of the two groups?
A) Yes
B) No
Solution: (A)
The null hypothesis in this case would be that there is no difference between the groups, while the alternative hypothesis would be that the groups differ significantly.
The critical t value for a two-tailed test at α = 0.05 is ± 2.101. The obtained t-statistic is 3.191. Since the t-statistic exceeds the critical t value, we can reject the null hypothesis and say that the two groups differ significantly with 95% confidence.
25) What percentage of the variability in scores is explained by the teaching method?
A) 36.13
B) 45.21
C) 40.33
D) 32.97
Solution: (A)
The % variability of scores is determined by the R2 value. The formula for R2 is defined as
R2 = 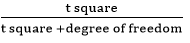
The degrees of freedom in this case will be 10 + 10 - 2, since there are two groups of size 10 each. The degrees of freedom is 18.
R2 = 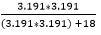 = 36.13
26) [True or False] The F statistic cannot be negative.
A) TRUE
B) FALSE
Solution: (A)
The F-statistic is a value we obtain when we run an ANOVA test on different groups to understand the differences between them. The F statistic is determined by the ratio of between-group variability to within-group variability.
Below is the formula for the f statistic.

Since both the numerator and the denominator contain squared terms, the F statistic cannot be negative.
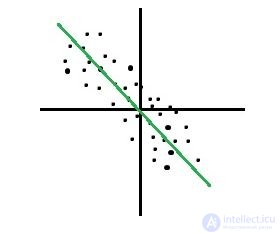
27) Which of the graphs below has a very strong positive correlation?
A) B) C) D)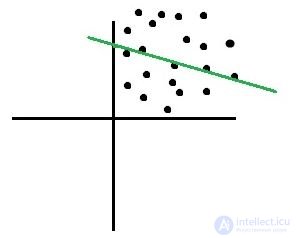
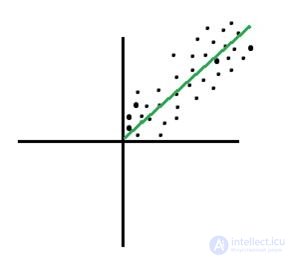
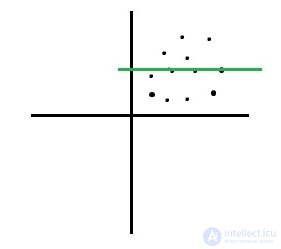
Solution: (B)
A strong positive correlation will occur when the following condition is met. If x increases, y must also increase; if x decreases, y must also decrease. In this case, the slope of the line will be positive, and the data points will show a clear linear relationship. Option B shows a strong positive relationship.
28) The correlation between two variables (Var1 and Var2) is 0.65. Now, after adding the number 2 to all values of Var1, the correlation coefficient will be _______?
A) Increase
B) Decrease
C) None of the above
Solution: (C)
If a constant value is added to or subtracted from any variable, the correlation coefficient does not change. This is easy to understand if we look at the formula for calculating correlation.
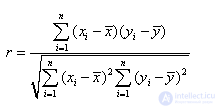
If we add a constant value to all x values, xi changes by the same number, and the differences remain the same. Therefore, the correlation coefficient does not change.
29) It is observed that there is a very high correlation between math test scores and the amount of physical exercise performed by a student on the day of the test. What can be concluded from this?
A) Only 1
B) 1 and 3
C) 2 and 3
D) All statements are true
Solution: (C)
Although sometimes causation may seem intuitive due to a high correlation, in reality correlation does not imply any causal conclusions. It simply tells us the strength of the relationship between two variables. If both variables move together, there is a high correlation between them.
30) If the correlation coefficient (r) between math test scores and the amount of physical exercise by a student is 0.86, what percentage of the variability in the math test is explained by the amount of exercise?
A) 86%
B) 74%
C) 14%
D) 26%
Solution: (B)
The % of variability is expressed by the square of the correlation coefficient r2. This value represents the proportion of variation in one variable that can be explained by another variable. Therefore, the % of variability explained will be 0.862.
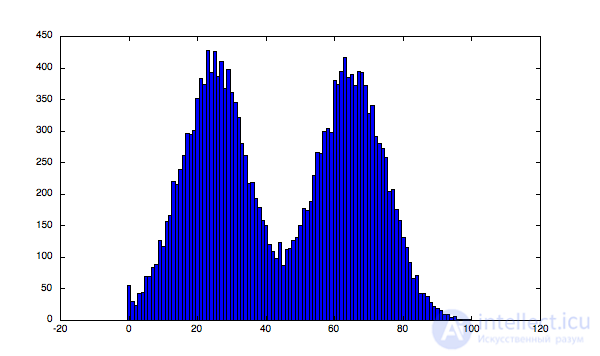
31) Which of the following is true regarding the given histogram?
A) The histogram above is unimodal
B) The histogram above is bimodal.
C) The data above is not a histogram
D) None of the above
Solution: (B)
The histogram above is bimodal. As we can see, there are two values for which we can see peaks in the histogram, indicating high frequencies for those values. Therefore, the histogram is bimodal.
32) Consider the regression line y = ax + b, where a is the slope and b is the intercept. If we know the value of the slope, with which parameter can we always find the value of the intercept?
A) Put the value (0,0) into the regression line True
B) Put any value from the points used to fit the regression line and calculate the value of b False
C) Put the mean values of x and y into the equation along with the value of a to obtain b True
D) None of the above can be used. False.
Solution: (C)
In the case of ordinary least squares regression, the line will always pass through the mean values of x and y. If we know one point on the line and the value of the slope, we can easily find the intercept.
33) What happens when we introduce more variables into a linear regression model?
A) The r-squared value may increase or remain constant, the adjusted r-squared value may increase or decrease.
B) R-squared may increase or decrease, while adjusted r-squared always increases.
C) Both r-squared and adjusted r-squared always increase when new variables are introduced into the model.
D) Both values may increase or decrease depending on the variables introduced.
Solution: (A)
R-squared always increases, or at least remains constant, because in the case of ordinary least squares, the sum of squared error never increases when additional variables are added to the model. Therefore, R-squared does not decrease. Adjusted R-squared is a modified version of R-squared, adjusted for the number of predictors in the model. Adjusted R-squared increases only if the new term improves the model more than would be expected by chance. It decreases when a predictor improves the model less than expected by chance.
34) On a scatter plot, the vertical distance to a point above or below the regression line is known as ____?
TODO img A) Residual
B) Prediction error
C) Prediction
D) Both A and B
E) None of the above
Solution: (D)
The lines we see in the graph above represent the vertical distance of the points from the regression line. They are known as residuals or prediction error.
35) In univariate least-squares linear regression, the relationship between the correlation coefficient and the coefficient of determination is ______?
A) Both are unrelated False
B) The coefficient of determination is the square of the correlation coefficient True
C) The coefficient of determination is the square root of the correlation coefficient. False.
D) Both are the same F
Solution: (B)
The coefficient of determination is the R-squared value, and it tells us the degree of variability of the dependent variable explained by the independent variable. It is nothing but the square of the correlation coefficient. In the case of multivariate regression, the r-squared value represents the ratio of the sum of explained variance to the sum of total variance.
36) What is the relationship between the significance level and the confidence level?
A) Significance level = Confidence level
B) Significance level = 1 - Confidence level
C) Significance level = 1 / Confidence level
D) Significance level = sqrt (1 - Confidence level)
Solution: (B)
The significance level is 1 - the confidence interval. If the significance level is 0.05, the corresponding confidence interval is 95% or 0.95. The significance level is the probability of obtaining a result as extreme as, or more extreme than, the result actually obtained when the null hypothesis is true. The confidence interval is the range of plausible values for a population parameter, such as the population mean. For example, if you calculate a 95% confidence interval for the average price of ice cream, you can be 95% confident that this interval contains the true average cost of all ice cream.
The significance level and the confidence level are complementary parts of the normal distribution.
37) [True or False] Suppose you are given a variable V, along with its mean and median. Based on these values, you can determine whether the variable "V" is skewed to the left or to the right for the condition.
mean (V) > median (V)
A) True
B) False
Solution: (B)
Since the type of distribution of the variable V is not mentioned, we cannot say for certain whether it is skewed to the left or to the right.
38) The line described by the linear regression (OLS) equation tries to ____?
A) Pass through as many points as possible.
B) Pass through as few points as possible
C) Minimize the number of points it touches
D) Minimize the squared distance from the points
Solution: (D)
The regression line tries to minimize the squared distance between the points and the regression line. By definition, ordinary least squares regression tries to obtain the minimum sum of squared errors. This means that the sum of squared residuals must be minimized. This may or may not be achieved by passing through the maximum number of points in the data. The most common case where not all points are passed through and the error is still reduced is when the data has many outliers or is not very strongly linear.
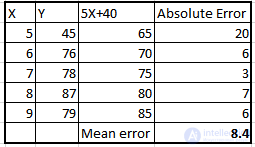
39) We have a linear regression equation (Y = 5X +40) for the table below.
| X | Y |
| 5 | 45 |
| 6 | 76 |
| 7 | 78 |
| 8 | 87 |
| 9 | 79 |
Which of the following is the MAE (mean absolute error) for this linear model?
A) 8.4
B) 10.29
C) 42.5
D) None of the above
Solution: (A)
To calculate the mean absolute error for this case, we must first calculate the y values using the given equation, and then calculate the absolute error relative to the actual y values. Then the mean of this absolute error will be the mean absolute error. The table below shows these values.
40) A regression analysis of weight (y) and height (x) resulted in the following least-squares line: y = 120 + 5x. This means that when height increases by 1 inch, weight is expected to
A) increase by 1 pound
B) increase by 5 pounds
C) increase by 125 pounds
D) none of the above
Solution: (B)
Looking at the equation, we get y = 120 + 5x. If height increases by 1 unit, weight increases by 5 pounds. Since 120 will be the same in both cases, it cancels out in the difference.
41) [True or False] Pearson captures how linearly dependent two variables are, whereas Spearman captures the monotonic behavior of the relationship between the variables.
A) TRUE
B) FALSE
Solution: (A)
The statement is true. Pearson correlation evaluates the linear relationship between two continuous variables. The relationship is linear when a change in one variable is associated with a proportional change in the other variable.
Spearman evaluates the monotonicity of the relationship. A monotonic relationship is one where the variables change together, but not necessarily at a constant rate.
I hope you enjoyed solving the questions, and that they made you scratch your head at times. Share your thoughts on the topics above, as well as your feedback.
We would be happy to bring your ideas to life in future articles and tests. Also, a single question may have several approaches, and the solution above may show only one of them. I tried to describe the solutions, but feel free to explore further in case of doubt, using the comments below.

Comments