
Lecture
Logistic regression is probably the most frequently used algorithm for solving all classification problems. Moreover, it is one of the first methods people start getting their hands dirty with.
We saw the same spirit in the test we designed to assess people on logistic regression. More than 800 people took this test. This skill test is designed specifically for you, to check your knowledge of logistic regression and its nuances.
If you are one of those who missed this test, here are the questions and solutions. You missed the live test, but you can read this article to find out how many of them you could have answered correctly.
Here is the leaderboard of participants who took the test.
Below is the distribution of participants' scores:
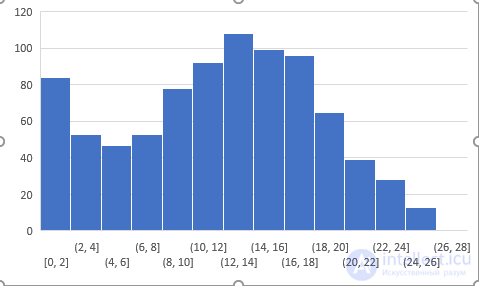
You can view the results here. More than 800 people took part in the skill test, and the highest score was 27.
Here are a few resources to gain deeper knowledge on the subject.
1) True-False: is logistic regression a supervised machine learning algorithm?
A) TRUE
B) FALSE
Solution: A
Indeed, logistic regression is a supervised learning algorithm because it uses true labels for training. A supervised learning algorithm must have input variables (x) and a target variable (Y) when training a model.
2) True-False: is logistic regression mainly used for Regression?
A) TRUE
B) FALSE
Solution: B
Logistic regression is a classification algorithm, do not confuse it with regression because of the name.
3) True-False: is it possible to design a logistic regression algorithm using a neural network algorithm?
A) TRUE
B) FALSE
Solution: A
True, a neural network is a universal approximator, so it can implement a linear regression algorithm.
4) True-False: is it possible to apply a logistic regression algorithm to a classification problem with three classes?
A) TRUE
B) FALSE
Solution: A
Yes, we can apply logistic regression to a 3-class classification problem. We can use the «One vs All» method to classify 3 classes in logistic regression.
5) Which of the following methods do we use to best fit the data in logistic regression?
A) Least Square Error
B) Maximum Likelihood
C) Jaccard distance
D) Both A and B
Solution: B
Logistic regression uses maximum likelihood estimation to train the logistic regression.
6) Which of the following evaluation metrics cannot be applied in case of the logistic regression output to compare with the target?
A) AUC-ROC
B) Accuracy
C) Logloss
D) Mean Squared Error
Solution: D
Since logistic regression is a classification algorithm, its output cannot be a real-valued number, so mean squared error cannot be used to evaluate it.
7) One of the very good methods for analyzing the performance of logistic regression is AIC, which is similar to R-Squared in linear regression. Which of the following is true about AIC?
A) We prefer a model with the minimum AIC value
B) We prefer a model with the maximum AIC value
C) Both are correct, but it depends on the situation
D) Neither of these
Solution: A
We select the best model in logistic regression, which can have the least AIC. For more information, see this source: http://www4.ncsu.edu/~shu3/Presentation/AIC.pdf
8) [True-False] Standardization of features is required before training logistic regression.
A) TRUE
B) FALSE
Solution: B
Standardization is not required for logistic regression. The main goal of standardization of features is to help the convergence of the methods used for optimization.
9) Which of the following algorithms do we use for variable selection?
A) LASSO
B) Ridge
C) Both
D) None of these
Solution: A
In the case of Lasso, we apply an absolute penalty; after increasing the penalty in Lasso, some coefficients of the variables may become equal to zero.
Context: 10-11
Consider the following logistic regression model: P (y = 1 | x, w) = g (w0 + w1x),
where g (z) is the logistic function.
In the equation above, P (y = 1 | x; w), viewed as a function of x, which we can obtain by varying the parameters w.
10) What will be the range of p in this case?
A) (0, inf)
B) (-inf, 0)
C) (0, 1)
D) (-inf, inf)
Solution: C
For values of x in the range of real numbers from −∞ to +∞, the logistic function will give a result between (0,1)
11) In the question above, which function do you think makes p lie between (0,1)?
A) logistic function
B) log-likelihood function
C) A mix of both
D) None of them
Solution: A
The explanation is the same as question no. 10.
Context: 12-13
Suppose you are training a logistic regression classifier and your hypothesis function H has the form
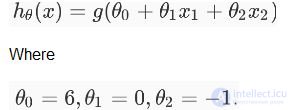
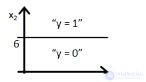
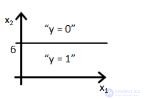
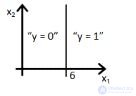
12) Which of the following figures will represent the decision boundary according to the above classifier?
A)
B)
C)
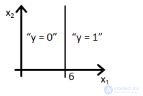
D)
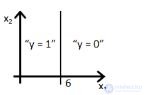
Solution: B
Option B would be the correct answer. Since our line will be represented as y = g (-6 + x2), which is shown in option A and option B. But option B is the correct answer because, when you put the value x2 = 6 into the equation, then y = g (0), you get this, meaning y = 0.5 will be on the line; if you increase the value of x2 above 6, you will get negative values, so the output will be in the region y = 0.
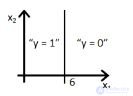
13) If you replace the coefficient of x1 with x2, what will the result be?
A)
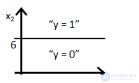
B)
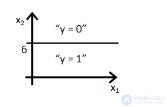
C)
D)
Solution: D
The same explanation as in the previous question.
14) Suppose you are given a fair coin and you want to find the odds of getting heads. Which of the following is true for this case?
A) odds are 0
B) odds are 0.5
C) odds are 1
D) None of these values
Solution: C
Odds are defined as the ratio of the probability of success and the probability of failure. So, in the case of a fair coin, the probability of success is 1/2 and the probability of failure is 1/2, so the odds will be equal to 1.
15) The logit function (given as l (x)) is the function of the log of odds. What can be the range of the logit function in the domain x = [0,1]?
A) (- ∞, ∞)
B) (0,1)
C) (0, ∞)
D) (- ∞, 0)
Solution: A
For our purposes, the odds function has the advantage that it converts a probability function that has values from 0 to 1 into an equivalent function with values from 0 to ∞. When we take the natural logarithm of the odds function, we get a range of values from -∞ to ∞ .
16) Which of the following options is true?
A) The error values of linear regression must be normally distributed, but in the case of logistic regression this is not so.
B) The error values of logistic regression must be normally distributed, but in the case of linear regression this is not so.
C) Both the error values of linear regression and logistic regression must have a normal distribution.
D) The error values of linear regression and logistic regression need not have a normal distribution.
Solution: A
Only A is true. Refer to this guide https://czep.net/stat/mlelr.pdf
17) Which of the following is true regarding the logistic function for any value of «x»?
Note.
Logistic (x): the logistic function of any number «x».
Logit (x): the logit function of any number «x».
Logit_inv (x): the inverse logit function of any number «x»
A) Logistic (x) = Logit (x)
B) Logistic (x) = Logit_inv (x)
C) Logit_inv (x) = Logit (x)
D) None of these
Solution: B
Refer to this link for the solution: https://en.wikipedia.org/wiki/Logit
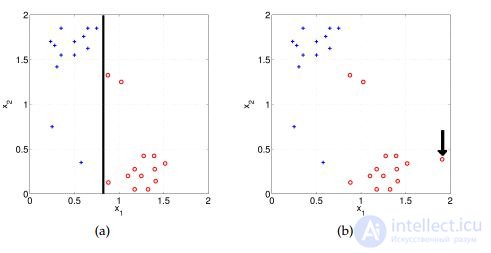
18) How will bias change when using high (infinite) regularization?
Suppose you were given two scatter plots «a» and «b» for two classes (blue for positive and red for negative class). In scatter plot «a», you correctly classified all data points using logistic regression (the black line is the decision boundary).
A) bias will be high
B) bias will be low
C) can't say
D) none of these
Solution: A
The model will become very simple, so the bias will be very high.
19) Suppose you applied a logistic regression model to some data and got training accuracy X and test accuracy Y. Now you want to add some new features to the same data. Choose the option(s) which is/are correct in such a case.
Note: Consider that the remaining parameters are the same.
A) Training accuracy increases
B) Training accuracy increases or remains the same
C) Test accuracy decreases
D) Test accuracy increases or remains the same
Solution: A and D
Adding more features to the model will increase the training accuracy because the model has to account for more data in order to fit the logistic regression. But the testing accuracy increases if the feature turns out to be significant.
20) Choose which of the following options is true regarding the «One vs All» method in logistic regression.
A) We need to fit n models for an n-class classification problem
B) We need to fit n-1 models to classify into n classes
C) We need to fit only 1 model to classify into n classes
D) None of these
Solution: A
If there are n classes, then n separate logistic regressions must be fit, where the probability of each category is predicted over the rest of the categories combined.
21) Below are shown two different logistic models with different values of β0 and β1.
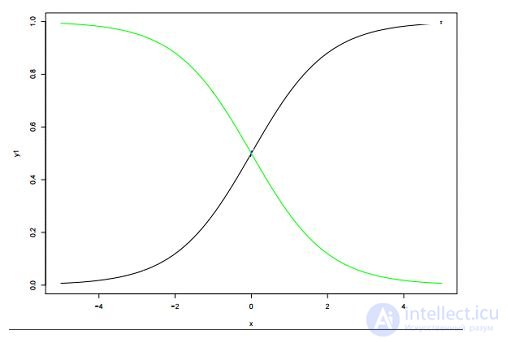 Which of the following statements is true regarding the values of β0 and β1 of the two logistic models (green, black)?
Note: Consider Y = β0 + β1 * X. Here β0 is the intercept and β1 is the coefficient.
A) β1 for green is greater than for black
B) β1 for green is lower than for black
C) β1 is the same for both models
D) can't say
Solution: B
β0 and β1: β0 = 0, β1 = 1 - color X1 (black) and β0 = 0, β1 = −1 - color X4 (green)
Context 22-24
Below are three scatter plots (A, B, C from left to right) and hand-drawn decision boundaries for logistic regression.
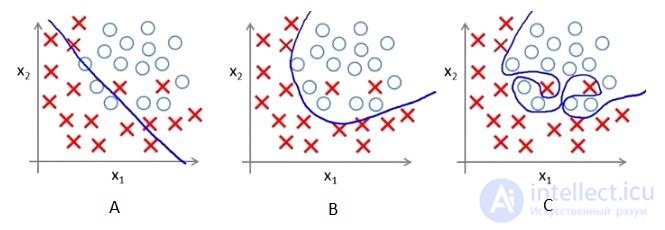
22) Which of the following figures shows that the decision boundary overfits the training data?
A) A
B) B
C) C
D) None of these
Solution: C
Since in figure 3 the decision boundary is not smooth, this means the data will be overfit.
23) What conclusions did you reach after seeing this visualization?
A) 1 and 3
B) 1 and 3
C) 1, 3 and 4
D) 5
Solution: C
The trend in the plots looks like a quadratic trend with respect to the independent variable X. A higher-degree polynomial (the plot on the right) can have very high accuracy on the train population, but is expected to perform poorly on the test dataset. But if you look at the plot on the left, we will have the maximum training error, because it does not fit the training data well.
24) Suppose the above decision boundaries were generated for different values of regularization. Which of the above decision boundaries shows the maximum regularization?
A) A
B) B
C) C
D) All have the same regularization
Solution: A
Since higher regularization means a higher penalty, it means a less complex decision boundary, which is shown in the first figure A.
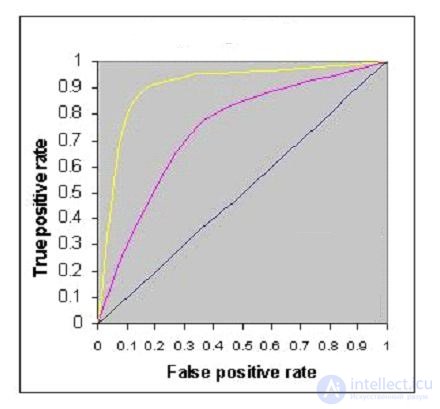
25) The figure below shows AUC-ROC curves for three logistic regression models. Different colors show the curves for different hyperparameter values. Which of the following AUC-ROC curves will give the best result?
A) yellow
B) pink
C) black
D) all the same
Solution: A
The best classification is the one with the largest area under the curve, so the yellow line has the largest area under the curve.
26) What would you do if you wanted to train logistic regression on the same data, which would take less time and also give comparatively similar accuracy (may be different)?
Suppose you are using a logistic regression model on a huge dataset. One of the problems you may face while working with such huge data is that training the logistic regression will take a very long time.
A) Decrease the learning rate and decrease the number of iterations
B) Decrease the learning rate and increase the number of iterations
C) Increase the learning rate and increase the number of iterations
D) Increase the learning rate and decrease the number of iterations
Solution: D
If you decrease the number of iterations during training, it will take less time for convergence, but it will not give the same accuracy; to get similar (though not exact) accuracy, you need to increase the learning rate.
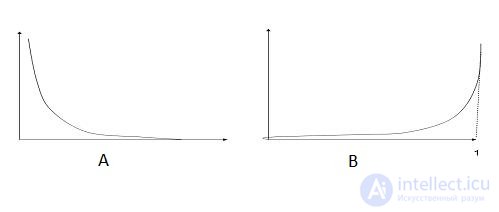
27) Which of the following images shows the cost function for y = 1.
Below is the loss function in logistic regression (loss function on the Y axis and log-probability on the X axis) for a two-class classification problem.
Note: Y is the target class
A) A
B) B
C) Both
D) None of these
Solution: A
A is the correct answer, since the loss function decreases as the log-probability increases
28) Suppose the following graph is the cost function for logistic regression.
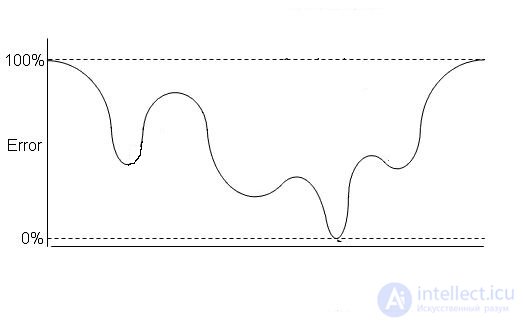
Now, how many local minima are present on the graph?
A) 1
B) 2
C) 3
D) 4
Solution: C
There are three local minima present on the graph
29) Imagine you were given the logistic regression graph below, which shows the relationship between the cost function and the number of iterations for 3 different learning rate values (different colors show different curves at different learning rates).
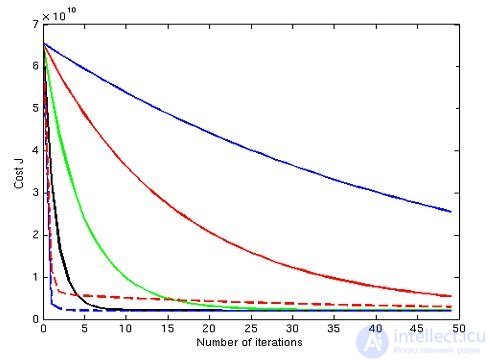 Suppose you saved the graph for future use but forgot to save the values of the different learning rates for this graph. Now you want to figure out the relationship between the slope-rate values of this curve. Which of the following would be the true relationship?
Note:
A) l1> l2> l3
B) l1 = l2 = l3
C) l1 <l2 <l3
D) None of these
Solution: C
If you have a low learning rate, then your cost function will decrease slowly, but in the case of a high learning rate, the cost function will decrease very quickly.
30) Can a logistic regression classifier achieve perfect classification on the data below?
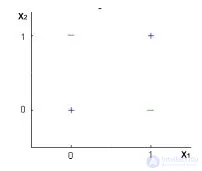
Note: you may only use the variables X1 and X2, where X1 and X2 can only take two binary values (0,1).
A) TRUE
B) FALSE
C) Can't say
D) None of these
Solution: B
No, logistic regression forms only a linear decision surface, but the examples in the figure are not linearly separable.
https://www.cs.cmu.edu/~tom/10701_sp11/midterm_sol.pdf
I tried my best to make the solutions as comprehensive as possible, but if you have any questions/doubts, leave your comments below. I would love to hear your feedback on the skill test. To learn more about such skill tests, visit our current hackathons.

Comments