
Lecture
The natural learning trajectory for statistics begins with measures of central tendency, followed by correlation, regression, and other advanced concepts. Among these initial concepts, I found correlation easy to understand, but I was puzzled when it was linked to other statistical concepts and metrics such as causation, regression, distribution, the Pearson correlation coefficient, etc. It took me some time to succeed and get a solid grasp of this concept. I managed it because I kept trying and did my best every time I failed. So don't stop, keep trying!
To begin with, if you're still trying to understand the difference between correlation and causation, you should refer to my previous article, where I explained these concepts in the simplest possible way.
Let's go ahead and learn about the most frequently asked questions about correlation. If you are studying statistical concepts, you are bound to run into these questions, which in most cases people try to avoid. For people like me, it should serve as a good reminder.
And if you want to learn these questions for a data science interview, then practice on the questions below.
The answers to many of the above questions may seem intuitive, however in this article you may find several unexpected factors regarding correlation.
Let's get started!
The most widely used correlation coefficient is the Pearson coefficient. Here is the mathematical formula for obtaining the Pearson coefficient.
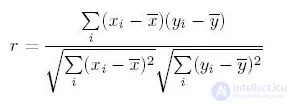
Explanation: This is simply the ratio of the covariance of two variables to the product of the variance (of the variables). It takes a value from +1 to -1. An extreme value on either side means they are strongly correlated with each other. A value of zero indicates NIL correlation, but not independence. You will clearly understand this in one of the following answers.
The absence of dependence between two variables means zero correlation. However, the converse is not true. Zero correlation can even coexist with perfect dependence. Here is an example:
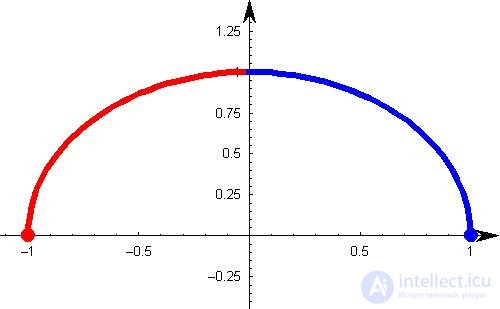
In this scenario, where the square of x is linearly dependent on y (the dependent variable), everything to the right of the y-axis is negatively correlated, and everything to the left is positively correlated. So what will the Pearson correlation coefficient be?
If you do the math, you will see zero correlation between these two variables. What does this mean? For a pair of variables that are completely dependent on each other, you can still get a zero correlation.
Tip to remember: correlation quantifies the linear relationship of two variables. It cannot capture a nonlinear relationship between two variables.
Good reading: must-read books on analytics / data science
Suppose X, Y, and Z are random variables. X and Y are positively correlated, and Y and Z are also positively correlated. Does it follow that X and Z must be positively correlated?
As we will see from the example, the answer (perhaps surprisingly) is «No.» We can prove that if the correlations are close enough to 1, then X and Z must be positively correlated.
Suppose C (x, y) is the correlation coefficient between x and y. Similarly we have C (x, z) and C (y, z). Here is the equation obtained from the mathematical solution of the correlation equation:
C (x, y) = C (y, z) * C (z, x) - square root ((1 - C (y, z) ^ 2) * (1 - C (z, x) ^ 2))
Now, if we want C (x, y) to be greater than zero, we basically want the right-hand side of the above equation to be positive. Therefore, you need to solve:
C (y, z) * C (z, x) > square root ((1 - C (y, z) ^ 2) * (1 - C (z, x) ^ 2))
In fact we can solve the above equation for both C (y, z) > 0 and C (y, z) < 0 together by squaring both sides. This will ultimately yield a result, since C (x, y) is a nonzero number, if the following equation holds:
C (y, z) ^ 2 + C (z, x) ^ 2 > 1
Wow, this is the equation of a circle. Therefore, the following plot explains everything:
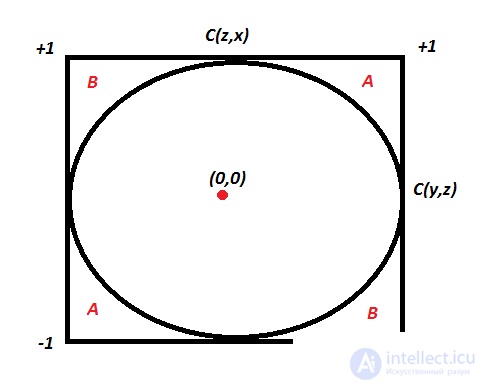
If the two known correlations lie in zone A, the third correlation will be positive. If they lie in zone B, the third correlation will be negative. Inside the circle we cannot say anything about the relationship. A very interesting conclusion is that even if C (y, z) and C (z, x) are both 0.5, C (x, y) can in fact still be negative.
The answer is yes. Even a single outlier can change the direction of the coefficient. Here are several cases, each with the same correlation coefficient of 0.81:
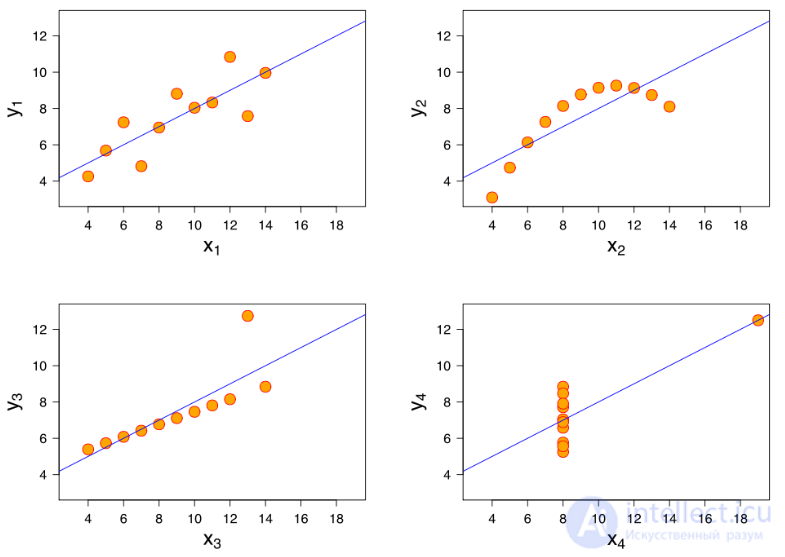
Consider the last two graphs (X3Y3 and X4Y4). X3Y3 is undoubtedly a case of perfect correlation, where a single outlier significantly reduces the coefficient. The last graph is the complete opposite - the correlation coefficient becomes a large positive number because of a single outlier. Ultimately, this turns out to be the biggest problem with the correlation coefficient - it is strongly affected by outliers.
Check your potential: should I become a data scientist?
If you have read the three answers above, I'm sure you can answer this question. The answer is no, because a causal relationship can also lead to a nonlinear relationship. Let's understand how!
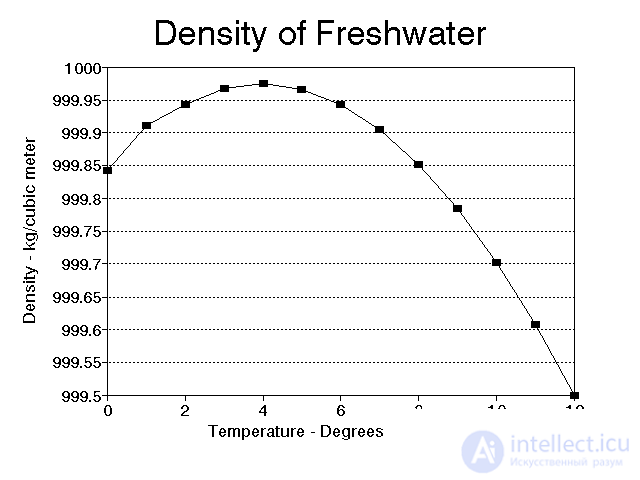
Below is a graph showing the density of water from 0 to 12 degrees Celsius. We know that density is an effect of the change in temperature. But density can reach a maximum value at 4 degrees Celsius. Therefore, it will not be linearly correlated with temperature.
These two are really close. So let's start with a few common features.
What is the difference between correlation and simple linear regression?
Now let's think about a few differences between them. Simple linear regression gives much more information about the relationship than the Pearson correlation. Here are a few things that regression gives you and the correlation coefficient does not.
The simplest answer here is that Pearson captures how linearly dependent two variables are, whereas Spearman captures the monotonic behavior of the relationship between the variables.
For example, consider the following relationship:
y = exp(x)
Here you will find that the Pearson coefficient is 0.25, while the Spearman coefficient is 1. As a rule, you should start with Spearman only when you have some initial hypothesis about the nonlinearity of the relationship. Otherwise we usually try Pearson first, and if it's low, then Spearman. This way, you'll learn whether the variables are linearly related or simply have monotonic behavior.
If you skipped the mathematical formula for correlation at the beginning of this article, now is a good time to go back to it.
Correlation is simply covariance normalized by the standard deviation of both factors. This is done in order to get a number from +1 to -1. Covariance is very difficult to compare, since it depends on the units of measurement of the two variables. It may turn out that a student's grades are more related to their toenail length in millimeters than to their attendance.
This is simply due to the difference in the units of measurement of the second variable. Hence, we see the need to normalize this covariance by some spread to make sure we are comparing apples to apples. This normalized number is known as correlation.
Questions about correlation come up very often in interviews. The main thing to know is that correlation is an estimate of the linear dependence of two variables. Correlation is transitive for a limited range of correlation pairs. It is also strongly affected by outliers. We learned that neither does correlation imply causation, nor the reverse.
Did you manage to answer all the questions at the beginning of this article? Did this article help you dispel any doubts about correlation? If you have more questions about correlation, we will be happy to answer them.

Comments