Lecture
Let's start with the simplest. We use our ability to generate random numbers to simulate the loss of random events.
A random event implies that a certain event has several outcomes, and which outcome will occur once again is determined only by its probability. That is, the outcome is chosen randomly, taking into account its probability.
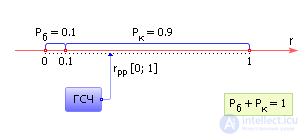
For example, suppose that we know the probability of production of defective products P b = 0.1. You can simulate the occurrence of this event by playing a uniformly distributed random number from the range from 0 to 1 and setting which of the two intervals (from 0 to 0.1 or from 0.1 to 1) it fell (see Fig. 23.1). If the number falls within the range (0; 0.1), then a marriage is released, that is, an event has occurred, otherwise, the event did not occur (a conditional product is issued). With a significant number of experiments, the frequency of numbers falling in the interval from 0 to 0.1 will approach the probability P = 0.1, and the frequency of numbers falling in the interval from 0.1 to 1 will approach P c = 0.9.

Fig. 23.1. The scheme of using a random generator
numbers to simulate a random event
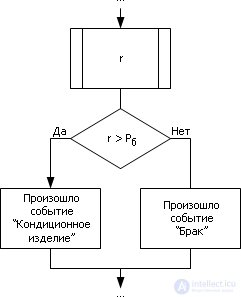
A fragment of the algorithm is presented in Fig. 23.2.

Fig. 23.2. Flowchart simulate a random event
Note that it does not matter how you place on the segment [0; 1] interval P b - at the beginning or at the end, since the Monte Carlo method takes into account only the frequency of random points in the interval, and it depends only on the size of the interval and does not depend on its location.
Events are called inconsistent if the probability of occurrence of these events is simultaneously 0. It follows that the total probability of a group of incompatible events is 1.
Denote by a 1 , a 2 , ..., a n events, and P 1 , P 2 , ..., P n - the probability of occurrence of individual events.
Since events are incompatible, the sum of the probabilities of their loss is 1: P 1 + P 2 + ... + P n = 1.
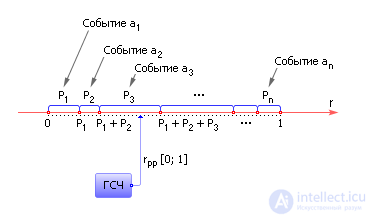
Again, to simulate the occurrence of one of the events, we use a random number generator, the value of which is also always in the range from 0 to 1. Set aside for the unit interval [0; 1] segments P 1 , P 2 , ..., P n . It is clear that the sum of the segments will be exactly one interval. The point corresponding to the number drawn from the RNG on this interval will indicate one of the segments. Accordingly, random numbers will fall more often into larger segments (the probability of occurrence of these events is greater!), And smaller segments — less often (see Fig. 23.3).

Fig. 23.3. Generation of non-concurrent random events using random number generator
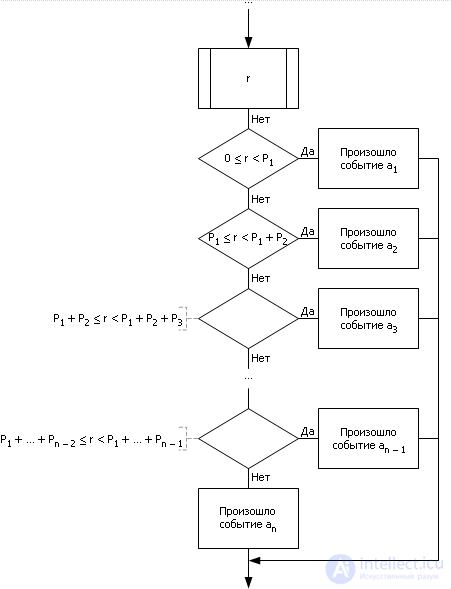
In fig. 23.4 shows a block diagram that implements the described algorithm. The algorithm determines using a filter constructed as a sequence of conditional operations ( IF ), in which of the intervals - from 0 to P 1 , from P 1 to ( P 1 + P 2 ), from ( P 1 + P 2 ) to ( P 1 + P 2 + P 3 ) and so on - hit the number generated by the random number generator. If the number falls into one of the intervals (which will always and necessarily), then this corresponds to the occurrence of the event associated with it.

Fig. 23.4. Block diagram of the algorithm for simulating random incompatible events
An example with the possible outcome of four incompatible random events.
We simulate the loss of a sequence of events - we will choose a card from a deck of cards at random (determine its suit). We will not return cards to the deck.
There are 36 cards of four suits in the deck with 9 cards of each suit. We divide the interval from 0 to 1 into equal four parts: [0.00–0.25], [0.25–0.50], [0.50–0.75], [0.75–1.00]. The first part will correspond to the cards of the suit of worms (H), the second to the cards of the suit peak (P), the third to the cards of the suit of blame (C), the fourth to the diamonds (B).
Take a random uniformly distributed number in the range from 0 to 1 from a table of random numbers or standard RNG. Let, for example, it will be the number 0.597. This number falls into the third interval corresponding to the suit B. A random event has occurred: "The suit of the drawn card - B".
Since now in the deck there are 9 cards of suit C, 9 cards of suit P, 8 cards of suit C, 9 cards of suit B, the interval from 0 to 1 will be divided into segments: 9/35, 9/35, 8/35, 9 / 35, that is, [0.000-0.257], [0.257-0.514], [0.514-0.743], [0.743-1.000]. Let's play a random uniformly distributed number in the range from 0 to 1. For example, 0.321. This number falls into the second interval corresponding to the suit P.
Continuing the process, you can get (depending on the specific random numbers), for example, the following sequence: C — P — B — H — B — P — H— ... (for illustration, see figure 23.5).

Fig. 23.5. Illustration of the operation of the random number generator on the example of choosing cards from the deck
Task. Events A, B, C form a complete group of events. Known probability of two events. Find the probability of the third event and determine what event occurred if, during the simulation, the random number generator produced a random number X.
Source data table
|
X |
P (A) |
P (B) |
P (C) |
|
0.9 |
0.35 |
0.4 |
? |
Decision
1 . because events form a complete group then
P (C) = 1-0.35-0.4 = 0.25

0.9> 0.75 => event P (C) has come
Answer : P (C) = 0.25. at X = 0.9, event P (C) has arrived .
Comments
To leave a comment
System modeling
Terms: System modeling