
Lecture
Earlier, the mathematical models of differential and integral contribution used to assess the compatibility of a set of REE (Radio-Electronic Equipment) were considered. The differential contribution model is of the greatest practical importance, as it makes it possible to establish the hazard of interference for a specific radio device and to identify the source of interference.
At the same time, it must allow determining the signal-to-interference ratio referred to the receiver input within the required receiver frequency band. The parameters of all radio channel elements that determine the probable interference level should be specified. This purpose is served by detailed information on the emission characteristics of interference sources, the antennas of the radio devices under consideration, and the parameters of spurious reception channels over a sufficiently wide frequency band. The amount of initial data required in general for EMC (electromagnetic compatibility) analysis depends on the purpose of the study and the mathematical models used for the radio channel elements.
The essence of EMC analysis lies in a stage-by-stage approximate assessment of all possible interference components and the exclusion, at various stages, of those that, in the given approximation, do not affect the interference level.
In EMC analysis, the threshold selection criterion is widely used, namely: a threshold is set for the interfering signal, exceeding which indicates a hazardous interference. Thus, for radio communication, television, and sound broadcasting systems, the standards for the value of protection ratios for the signal-to-interference ratio, recommended in ITU-R documents, are widely used. If the levels of interfering signals are below the threshold, they are not analyzed and are considered non-hazardous.
Let us consider a certain distributed set of REE. The initial data for the analysis are:
Some parameters and characteristics must be known over a wide frequency band. If information about them is unavailable, the results of statistical processing of measurements of the characteristics of similar REE, or regulatory documents relating to the required characteristics, can be used.
For various combinations of modulation types of wanted and interfering emissions and the required quality of REE operation, the assessment criteria for compatibility and EMC indicators, for example, the required values of protection ratios, must be specified.
EMC analysis may, for example, include several sequentially performed stages of selection and assessment of EMC conditions:
The spatial and frequency selection stages are necessary for the preliminary «screening out» of potentially non-hazardous interference sources. Thus at the spatial selection stage, an assessment of the possible propagation mechanisms of interfering signals makes it possible to select, from numerous probable interference sources, only those located within a limited part of the surrounding space.
At the frequency selection stage, potential interference sources whose emission spectrum components do not fall within the channels coinciding with the main, adjacent, and spurious reception channels of the analyzed radio receivers can be excluded from consideration. In the simple variant of frequency selection, only the possibility of interference occurring in the main and adjacent reception channels is taken into account. The frequency selection stage may precede the spatial selection stage.
At the amplitude selection stage, an amplitude assessment of the interference is performed, consisting in determining the levels of the wanted signal and the potential interference and analyzing the ratio of these levels at the input of the radio receiver. As a result, hazardous interference is selected for further analysis, while non-hazardous interference is excluded from consideration.
At the next stage – frequency assessment of interference (FAI) – the frequency relationships between individual source-receptor pairs of interference are analyzed and taken into account.
At the comprehensive interference assessment stage, the impact on EMC conditions of the combination of interfering emissions, including the influence of nonlinear effects, is assessed. The comprehensive assessment is based on the previous stages of EMC analysis; it is the most complex to implement and requires the maximum computation time.
The main characteristic of interference is the dependence of power spectral density on frequency. Interference affecting automation systems has a spectrum from direct current to units of gigahertz (see Fig. 3.1) . Interference lying within the passband of analog automation systems has frequencies up to tens of kilohertz. Digital circuits are affected by interference in the band up to hundreds of megahertz. Gigahertz-range interference has no direct effect on automation systems; however, after conversion in nonlinear elements or due to the aliasing effect, it can generate low-frequency interference lying within the boundaries of the perceived spectrum.
Devices in which the current or voltage level switches over a short period of time are sources of broadband interference (motors, switches, relays and contactors, tram current collectors, etc.). Devices in which the current or voltage changes periodically with a limited rate of rise produce narrowband interference (for example, cell phones, radio transmitters, signal generators, microwave ovens, microprocessor systems).
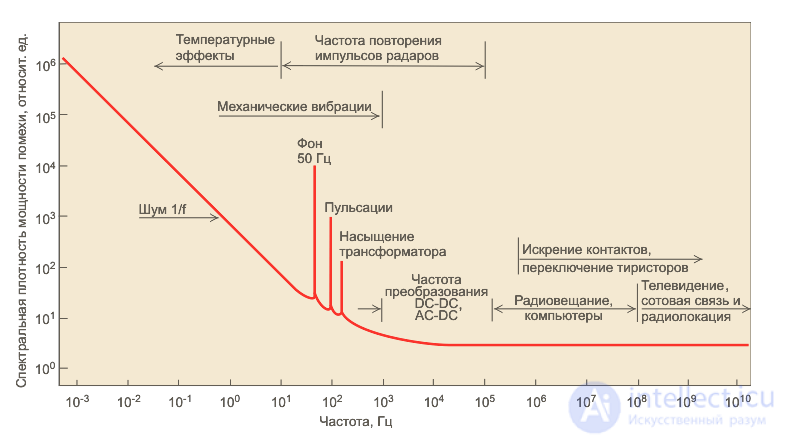
Fig. 3.1. Relative level of power spectral density and frequency of the main sources of electromagnetic interference
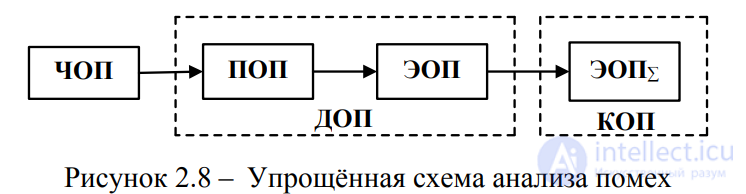
. Figure 2.8 – Simplified diagram of interference analysis
Figure 2.8 shows a simplified diagram of the analysis of interference penetrating through the main and spurious reception channels
The task of the FAI stage is to select interference satisfying the frequency criterion (FC) and to determine the frequency parameters of the interference penetration channel.
To do this, it is necessary to perform an enumeration with respect to each p-th
emission of all s-th reception channels and perform an FC check for each combination
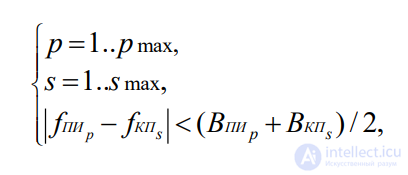 (2.72)
where
 - average frequency of the p-th emission;
 - average frequency of the s-th reception channel;
 - bandwidth of the p-th emission at level Xz;
 - bandwidth of the s-th reception channel at level Sz;
The signal circuits and grounding circuits of automation systems contain the entire spectrum of possible interference. However, only interference whose frequencies lie within the passband of automation devices has a parasitic effect.
In the process of pairwise EMC assessment within the considered set of REE, a receiver is first selected for analysis, after which the level of the wanted signal (dB) at its input is determined by a formula; the index S indicates that the corresponding quantity belongs to the wanted signal
 . (9.1)
Here PRS – power of the wanted signal at the receiver input; \
PTS - power of the wanted signal source;
GTS , GRS – maximum gain coefficients of the transmitting and receiving antennas along the propagation path of the wanted signal,
μTS and μRS - efficiency of the transmitting and receiving feeder paths (dB);
fS - frequency of the wanted signal,
A Σ – total losses along the propagation path (dB).
Similar relationships are used when calculating the interference level; the notation here is the same as in (9.1), and the index I indicates that the corresponding quantity belongs to the interfering signal
 (9.2)
(9.2)
where PRI – interference power at the receiver input;
PTI - power of the interference source;
fI - frequency of the interfering signal,
δRI - coefficient accounting for the mismatch between the polarizations of the receiving antenna and the interfering signal;
kSI – frequency correction coefficient accounting for the selectivity of the radio receiver (dB).
It should be borne in mind that in formula (9.2) GTI and GRS - these are the gain coefficients of both antennas along the propagation path of the interference,
ηTI and ηRI - efficiency of the transmitting and receiving feeder paths (dB), and in this situation the effect of the mismatch between the receiving antenna and the feeder at the interference frequency should be taken into account.
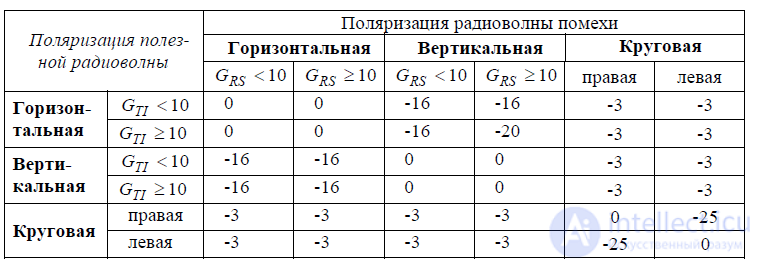
The values of the coefficient RI , which accounts for the mismatch between the polarizations of the receiving antenna and the radio wave of the interfering signal, are given in Table 9.1.
Table 9.1 - Correction coefficient of polarization losses RI
Formulas (9.1) and (9.2) should be applied when the interference source is located in the far field of the radio receiver antenna. If the distance between them is less than 10, the interference power at the receiver input is calculated using the formula:
 , (9.3)
where - coefficient accounting for the isolation between antennas;
PTa - power at the input of the interference source antenna,
PRa - power at the output of the interference receptor antenna.
The noise power at the input of the radio receiver is found using the expression
 , (9.4)
where PN equivalent noise power at the input (dBW),
NR noise figure of the receiving system (dB), accounting for thermal and cosmic noise,
BR bandwidth of the main reception channel at the 3 dB level (MHz).
Taking into account expressions (9.1) … (9.4), the signal-to-interference and signal-to-noise ratios can be determined. However, unlike the signal (9.1), the analysis of expression (9.2) is performed stage by stage.
At this stage, the following main tasks are solved:
The formula for calculating the interference level is obtained from (9.2) if the term kSI ( fS , fI ), characterizing the selective properties of the receiver, is excluded from it.
Since the terms of equality (9.2) depend on frequency, by introducing this dependence explicitly and writing the basic relation for calculating the average interference level relative to the receiver sensitivity PR0 , we obtain, at the amplitude selection stage,
 . (9.5)
Each of the terms is described by the corresponding mathematical model discussed earlier.
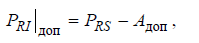
The permissible power of the interfering signal PRI adm at the input of the analyzed receiver, under a deterministic assessment of REE operation quality, is calculated using the formula
 ,
,
where Aadm is the permissible minimum protection ratio, equal to the ratio of the average powers of the wanted and interfering signals at which normal operation of the REE is ensured.
For a simplified EMC assessment under group interference, it may be replaced by a single equivalent interference. For this purpose, one main interference with the largest ratio of its power PIk to the permissible power value PIkadm for this radio interference is selected from the set of interferences. The powers of all interferences are summed with weighting coefficients in the form of ratios of the permissible powers  of each interference
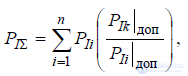
where n - number of single interferences in the total interference signal.
At the frequency selection stage, the selective properties of the receiver with respect to frequency are taken into account, and the main tasks are as follows:
The frequency correction coefficient kSI , which accounts for the selectivity of the radio receiver, can be determined using the relation

Here α1- coefficient accounting for the attenuation of the interference effect due to the mismatch between the center frequency of the interfering signal spectrum and the receiver tuning frequency,
α2 - coefficient accounting for the attenuation of interference due to penetration through spurious reception channels

where S( f ) - normalized power spectrum of the interference;
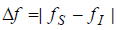 detuning of the center frequency of the interference relative to the receiver tuning frequency;
g( f ) - amplitude-frequency response of the radio receiver – the interference receptor;
PR0 - receiver sensitivity in the main reception channel,
PRn - susceptibility via the n -th spurious reception channel.
The possibility of intermodulation occurring in a radio receiver is checked only if interference from several sources acts at its input and at least one of them is continuous or pulsed with a low duty cycle.
Analysis of intermodulation includes:
The equivalent interference power referred to the input of the radio receiver PRint for third-order intermodulation, arising when two signals act at its input with frequencies fI1, fI2 that do not coincide with the frequency of the main fR and spurious reception channels, is calculated using the formula

where PI1 and PI2- powers of the interfering signals at the input of the radio receiver;
kint - intermodulation coefficient,
P( fI1, fI2) - level of two identical signals at the input creating intermodulation at a given value of kint(recommended to be taken equal to 10-7 ...10-5 W) When accounting for the phenomena of blocking and cross-modulation, the permissible powers
of the interfering signal  and
and  are calculated using the formulas

where Dbl and Dcm - dynamic ranges of the radio receiver with respect to blocking and cross-modulation.
At the same time, the blocking effect assessment is carried out only for interfering signals identified at the amplitude selection stage as potentially hazardous via the adjacent channel. The assessment of cross-modulation effects is carried out only for AM signals with two sidebands.

Comments