
Lecture
An antenna is, on one hand, a spatial filter and provides spatial and polarization selectivity, and on the other hand it can perform the functions of a frequency filter, that is, carry out frequency selection of electromagnetic fields. Consequently, the level of the useful signal and interference penetrating the receiver input largely depends on the properties of the antenna devices.
The electrodynamic characteristics of antennas are conventionally determined in transmit mode, assuming that the characteristics of antennas in receive mode (receiving antennas) coincide with their characteristics in transmit mode.
The directional properties of antennas are characterized by the amplitude radiation pattern of the antenna – a function reflecting the dependence of the amplitude of the electric field strength, created by the antenna at a fixed distance in the far zone, on the angular coordinates of the observation point.
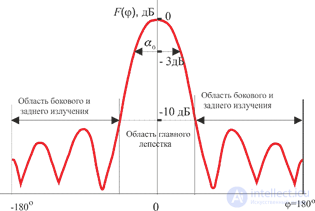
Figure 5.1 - Example image of an antenna radiation pattern
In most cases the antenna radiation pattern has a multi-lobed shape (Fig. 5.1). The largest lobe is called the main lobe, the others are the side lobes of the pattern, and sometimes there can be several main lobes.
The main lobe of the pattern is characterized by its width, determined at the half-power level (-3 dB), or at the -10 dB level. Side lobes are numbered starting from the main lobe of the pattern, and are characterized by their angular position and level.
In EMC problems it is important to describe the directional properties of an antenna not only in the region of the main lobe, but also of the side lobes, not only at large distances, but also in the near zone of the antenna. Therefore the entire space surrounding the antennas is divided into two parts:
Considering a set of identical antennas, it can be noted that for different specimens of these antennas the main lobe retains a relatively constant shape. Therefore, a deterministic description can be applied to describe the properties of antennas in the main-lobe region of the pattern.
In contrast, the side and back lobes of the radiation patterns in a set of such antennas can differ arbitrarily, both in magnitude and in position and shape. Such differences are caused by the action of several random factors such as:
Therefore, a probabilistic description is applied to the side and back lobes of the antenna pattern.
The directional properties of antennas in the main-lobe region within the operating frequency range are characterized by the following parameters: the directivity  , the antenna gain
  and the width of the main lobe of the pattern in the principal planes, determined at the half radiated-power level.
Directivity – is a function of angular coordinates, numerically equal to the ratio of the squared modulus of the field strength created by the antenna in a given direction  , to the field strength squared averaged over all directions
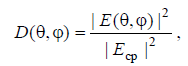
where 
The antenna gain (absolute or isotropic gain) is the product of the efficiency and the directivity

Unless specifically stated otherwise, the directivity and gain of an antenna are understood to mean the maximum value of the corresponding functions in the direction of the main lobe of the pattern, and are denoted as D0 or G0 , respectively.
In many practical applications the concept of relative gain is used, that is, gain relative to some antenna taken as a reference.
In ITU-R Recommendations, the following antenna types are conventionally chosen as reference:
Strictly speaking, the concepts of the radiation pattern, gain and directivity can only be used in the far zone of an antenna (Fraunhofer zone), where these functions no longer depend on distance. Nevertheless, in problems of interference-level prediction and EMC analysis it is sometimes necessary to know the radiation characteristics at relatively short distances as well. In the near zone these characteristics are functions not only of coordinates, but also of distance. The far-zone distance for antennas with high and medium directivity is determined by the inequality:
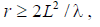
where L – the maximum antenna dimension, λ the operating wavelength, r – the distance to the observation point.
For weakly directional antennas the far-zone criterion is the inequality  .
.
For antennas with a relatively narrow main lobe of the pattern  and high
gain (G0 > 20dB ) an approximate value of the far-zone gain can be calculated using approximate formulas:
 , or in decibels

Very often in EMC problems the region of main radiation is determined at the –10 dB level. Then, if the width of the main lobe at this level is not known in advance, it is taken as twice the width at the –3 dB level. For a deterministic description of the gain within the main lobe of the pattern, approximation is used, applying a function convenient for calculations. Examples of such functions are given in Appendix 3 (see Table A3.1).
Note that the shape of the radiation pattern and the value of antenna gain depend on frequency. To approximate the frequency dependence of antenna gain when calculating the interference level, a mathematical model of gain over the main lobe of the pattern is used:
G0 ( f ) = G0 ( f0 ) + Clg( f / f0 + D). (5.1)
The coefficients of model (5.1) are determined on the basis of statistical calculations from measurement results outside the operating frequency range, where f0 – is the operating frequency, f - is the interference frequency.
Unlike the far zone, where the gain is constant, in the near zone, as the distance decreases, it may undergo significant fluctuations with an overall tendency to decrease.
At the same time the main lobe of the radiation pattern widens. The gain in the near zone of antennas having high far-zone gain can be approximately estimated using the expression:
G(r) =11+ 20lg(r) -10lg(S) , (5.2)
where r – the distance from the antenna, m; S – the aperture area, m2.
For antennas with weak directivity and low gain (whip antennas, loop antennas, dipoles), the change in gain in the near zone is neglected.
Since sufficient statistics are not always available for calculating the indicated coefficients, a threshold model (Fig. 5.2) is sometimes used, assuming the gain is constant and equal to G0 within the operating frequency range, taking C = 0 outside this range, while the coefficient D is determined experimentally or theoretically.
For approximate calculations using the threshold model, data from Appendix 3 (see Table A3.2) can be used.
For each pair of several stationary, closely spaced antennas whose patterns do not change their mutual orientation, the concept of the spatial decoupling coefficient is introduced.
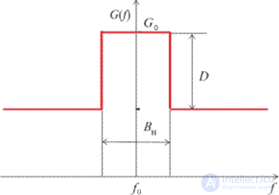
Figure 5.2 - Threshold model of the frequency dependence of antenna gain
This coefficient is numerically equal to the ratio of the power PT , supplied to the antenna of the interference source, to the power PR in the load of the antenna of the receptor of this interference. It shows by how much the radiated power of the interference source is attenuated at the receiver input

The decoupling coefficient makes it possible to take into account not only the directional and polarization properties of antennas, but also losses in the antennas, as well as the presence of nearby and shielding objects.
The interference immunity of antennas is characterized primarily by their amplitude and polarization radiation patterns. When considering the amplitude radiation pattern (RP) of aperture antennas, for example reflector antennas, three spatial regions are usually distinguished. In the first of these, the pattern is mainly determined by the currents on the «illuminated» part of the antenna surface, more precisely by the uniform component of the currents. This is the so-called aperture-radiation region. It contains the main lobe and several of the first side lobes of the pattern.
In the second region, the so-called far side-radiation region, the antenna pattern is determined by the radiation of the uniform and non-uniform components of the current, the direct field of the feed, etc.
In the third region, the back-radiation region, the pattern is mainly determined by diffraction effects at the antenna edges. In practical use of the antenna, additional causes appear that distort its directional properties (especially in the second and third regions), caused by the presence of the support and its supporting structures, and by the influence of nearby objects.
Since the probability of interference arriving in the sector of the main lobe of the pattern is usually low, it is considered that interference immunity is mainly determined by the region of the side and back lobes.
Let us give some data on the characteristics of axisymmetric antennas with a circular aperture. For a uniform amplitude distribution of the field in the aperture, the radiation pattern is described by the formula  , d – the aperture diameter. In this case the expression for the envelope of the pattern has the form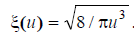
The main numerical values for this case are given in Table 5.1.
Table 5.1 – Antenna characteristics for a uniform distribution

The main lobe at the - 3 dB level contains 47% of the radiated power, and at the zero level 84%. The first three side lobes radiate 7.2, 2.8 and 1.4% of the power, respectively. For a parabolic-on-a-pedestal amplitude distribution of the field in the aperture 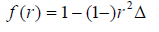 , the radiation pattern is described by the formula

In this case the expression for the envelope of the pattern has the form

Table 5.2 – Antenna characteristics for a parabolic distribution
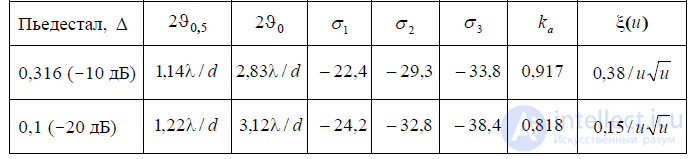
For the parabolic distribution with a -10 dB pedestal (Δ= 0.316), often used in practice, the fraction of power within the main lobe of the pattern is 53% at the -3 dB level and 95.5% at the nulls. The power in the first three side lobes of the pattern is 2.3, 0.8 and 0.4%, respectively.
The presence in the antenna aperture of a feed, feeder-path elements, mounting elements, etc. leads to changes in the directional properties, which is especially noticeable in the side-lobe region of the pattern. This is explained both by the appearance of shadowed areas in the antenna aperture and by the scattering of energy on shadowing objects. The presence of shadowing does not allow a low level of side and back lobes of the pattern to be achieved even with a low field level at the edges of the antenna aperture. Appendix 3 (see Table A3.3) gives the dependence of the levels of the first three side lobes on the degree of shadowing of the antenna aperture.
Another significant factor determining the level of both the near and far side lobes of antenna patterns is the presence of random amplitude-phase errors in the field distribution in the antenna aperture. These errors are usually caused either by manufacturing tolerances in the antenna design, or by errors in realizing the excitation characteristics, for example in antenna arrays. The physical explanation of the relationship between phase-excitation errors and the appearance of additional background in the side-lobe region is as follows: the absence of in-phase excitation leads to a reduction in the radiation level in the main direction, and the «unused» part of the power is re-radiated in side directions.
The structure of antenna side radiation is random in nature; it does not remain constant when the operating frequency and signal polarization change. This structure varies noticeably from one specimen of a given antenna type to another. Therefore the most adequate description of gain in this region is a statistical one.
Numerous statistical calculations based on measurements of directional antennas have shown that their gain in this region is well described by the normal probability distribution law and shows good statistical stability.
Probability distribution (for discrete random variables) – the probability that a random variable takes a given value. Probability density (for continuous random variables) – the limit of the ratio of the probability of a random variable falling into a given interval to the size of that interval, as the interval tends to zero.
For approximate and quick calculations when predicting the interference level in EMC problems, data from Appendix 3 (see Table A3.4) can be used.
The power level of the interference arriving at the receiver input depends on which region of the pattern the interfering signal is radiated and received through. In general, it is customary to distinguish the following four situations characterizing the interaction of radio-electronic equipment through the antenna paths of the transmitter and receiver:
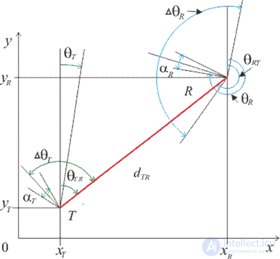
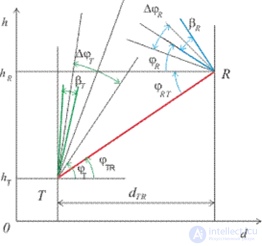
Below is given the arrangement of the source and receptor antennas in the coordinate system in the horizontal (Fig. 5.3, a) and in the vertical plane (Fig. 5.3, b), and the angular parameters of the problem under consideration are also shown.
a) b)
Figure 5.3 - For the calculation of antenna interaction
The following notation is used in these figures:
 – the viewing sectors of the transmitter antenna in the horizontal and vertical planes;
 – the viewing sectors of the receiver antenna in the horizontal and vertical planes;
 – the angles defining the centers of the viewing sectors of the transmitter and receiver antennas in the horizontal plane;
 – the angles defining the centers of the viewing sectors of the transmitter and receiver antennas in the vertical plane;
 – the angles specifying the direction from the transmitter antenna to the receiver antenna and vice versa, in the horizontal plane;
 – the angles specifying the direction from the transmitter antenna to the receiver antenna and vice versa, in the vertical plane;
 – the width of the main maximum of the transmitter antenna pattern in the horizontal and vertical planes;
 – the width of the main maximum of the receiver antenna pattern in the horizontal and vertical planes.
If the position of the antennas in space is fixed, then in calculations it is necessary to establish the zone of constant interaction of the antennas.
The limits of variation of the coordinate angles  , where the angle
  is measured from a plane parallel to the plane x0y . It can be seen from Fig. 5.3 that
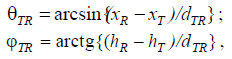
where:  and
and  . If dTR=0, then
  for hT > hR and
  for hT < hR.
The conditions under which the main lobe of the transmitter antenna pattern is oriented in the direction of the receiver antenna have the form
 (5.3)
(5.3)
When calculating the interaction zones of stationary antennas, one should assume in inequalities (5.3) that  .
.
The inequalities  and .
and .  must also be satisfied
If they are not satisfied, then one should set 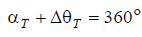 and
and  .
.
If inequalities (5.3) are satisfied, then when determining the gain of the transmitter antenna in the direction of the receiver, for the worst case the main-lobe pattern model is used, and if at least one is not satisfied – the side-radiation model is used.
If it is necessary to determine the orientation of the receiver antenna toward the transmitter, the indices T should be replaced by R and R by T in (5.3), and the values RT and RT can be determined from the expressions  and
and 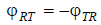 , taking into account the limits of variation of the angles.
In the case where the position of the pattern in space changes (for example, during scanning), it is necessary to determine which interaction situations can occur and what the worst of the possible interactions is, and what percentage of time corresponds to each situation. Let us give formulas for calculating the probabilities of various antenna interaction situations for antennas independently scanning in the horizontal plane
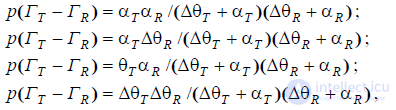
where p(*) – is the probability of event (*). It must first be established that the listed situations occur, otherwise the probabilities are equal to zero.

Comments