
Lecture
A schematic , or schematic diagram , — is a schematic representation of the elements of a system, made using abstract graphical symbols , rather than realistic images. A schematic usually omits all details that are not relevant to the key information it is meant to convey, and may include simplified elements to make the main idea easier to understand, as well as additional organization of information.
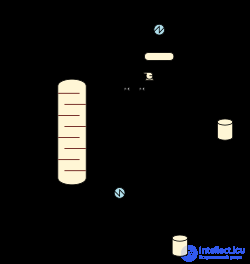
For example, on a metro map intended for passengers, a metro station may be represented by a dot. The dot is not intended to accurately depict the actual station, but serves to give the viewer information without unnecessary visual clutter. A process flow diagram of a chemical process uses symbols instead of detailed images of vessels, piping, valves, pumps and other equipment making up the system, thereby emphasizing the functions of the individual elements and the relationships between them while suppressing their physical details. In an electronic circuit diagram, the arrangement of symbols may not resemble the real-world layout of the circuit at all: rather than representing the appearance of the circuit , the diagram seeks to reflect, at a more general level, the principle of its operation . This can be contrasted with a wiring diagram , which preserves the spatial relationships between each of its components.
Schematics, depending on the kinds of elements and connections that make up the product (installation), are divided into the following types:
For a product that includes elements of different kinds, several schematics of the corresponding kinds of one type are developed, for example a schematic electrical diagram and a schematic hydraulic diagram, or a single combined diagram containing elements and connections of various kinds.
On a schematic of one kind, it is permitted to depict elements of a schematic of another kind that directly affect the operation of the schematic of this kind, as well as elements and devices not included in the product (installation) for which the schematic is drawn up, but necessary for explaining the operating principles of the product (installation).
Graphical symbols of such elements and devices are separated on the schematic by dash-dot lines of the same thickness as the connection lines, and labels are placed indicating the location of these elements and the necessary data.
A decomposition schematic of a product into its component parts is produced to stipulate the composition of the product.
Schematics, depending on their primary purpose, are divided into the following types:
The names of the types of schematics indicated in parentheses are established for electrical schematics of power engineering installations.
Schematics and other kinds of diagrams, for example,
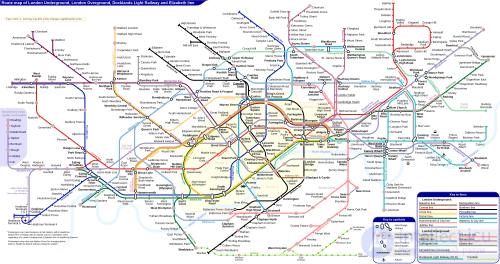

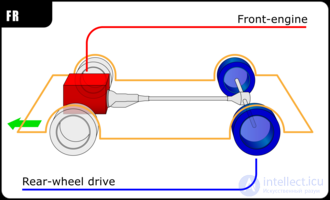
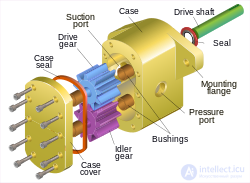

A semi-schematic diagram combines some of the abstractions of a purely schematic diagram with other elements displayed as realistically as possible for various reasons. It is a compromise between a purely abstract diagram (for example, a map of the Washington Metro) and an exclusively realistic image (for example, a corresponding aerial photograph of Washington).

GOST 2.701-84 defines the following component parts of schematics:
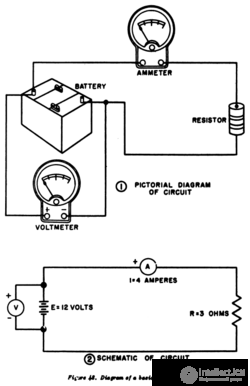
Comparison of pictorial and schematic styles of electrical circuit diagrams.
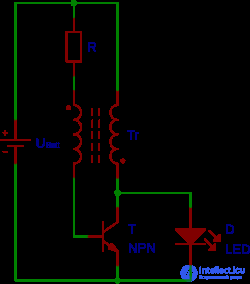
An example of a circuit using the «joule thief» effect to drive an LED .
In the electrical and electronics industry, a circuit diagram is often used to describe the design of equipment. Circuit diagrams are frequently used for the maintenance and repair of electronic and electromechanical systems. [ 1 ] Whereas schematics used to be drawn by hand using standardized stencils or pre-printed adhesive symbols, today electronic design automation (EDA, or «electronic CAD») software is often used instead.
In electronic circuit design automation prior to the 1980s, circuit diagrams were practically the only formal representation of circuits. More recently, with the development of computer technology, other methods of representation have been introduced and specialized computer languages have been developed, since with the explosive growth in the complexity of electronic circuits, traditional circuit diagrams have become less practical. For example, hardware description languages are indispensable for modern digital circuit design .
Electronic circuit schematics are developed by designers using electronic design automation (EDA) tools , called schematic capture tools or schematic entry tools . These tools go beyond simply drawing devices and connections. They are usually integrated into the entire design process and linked with other EDA tools for verifying and simulating the circuit being designed.
Programmable logic controllers (PLCs) can be programmed using ladder diagrams .
In the design of electrical power systems, a schematic drawing called a one-line diagram is often used to represent substations , distribution systems, or even entire electrical power networks. These schematics simplify and compress details that would otherwise be repeated for each phase of a three-phase system , showing only one element instead of three. Electrical schematics of switchgear often have common device functions denoted by standard function numbers . Another type of schematic used in power systems is the three-line diagram .
For power system analysis purposes, if the system is balanced, an equivalent per-phase circuit (or single-phase circuit ) can be obtained from the one-line diagram. If all parameters are represented as impedances and voltage sources, the equivalent per-phase circuit is called an impedance diagram . If all parameters are represented as admittances and current sources, the equivalent per-phase circuit is called an admittance diagram .
If the power system is unbalanced but linear (or can be approximated by a linear system), then Fortescue's theorem ( symmetrical components ) can be applied. Thus, from the one-line diagram, three separate diagrams are obtained for each phase, known as sequence diagrams : the positive-sequence diagram , the negative-sequence diagram , and the zero-sequence diagram . Each of these diagrams can be represented as an impedance diagram or an admittance diagram.
Schematics are widely used in repair manuals to help users understand the relationships between parts and to provide graphical instructions for facilitating the disassembly and assembly of mechanical units. In many automobile and motorcycle repair manuals, a significant number of pages are devoted to schematics.
When designing diagrams, the rules set out in the relevant ESKD standards must be observed. These establish the conventional graphical symbols (CGS) for diagram elements, requirements for depicting the connections between elements, rules for the placement of certain technical data on the CGS, etc.
Diagrams are drawn on sheets of a format determined by GOST 2.301-68 [ 3 ] or DSTU ISO 5457:2006 [ 4 ] , without observing scale. The actual spatial arrangement of the component parts of the product is either disregarded or taken into account only approximately. The conventional graphical symbols of the elements and the connecting lines between them are drawn with a main line, whose thickness ranges from 0.2 to 1.0 mm.
Connecting lines should consist of horizontal and vertical segments and have the smallest possible number of bends and mutual intersections. Sloped segments of connecting lines of limited length are permitted. The distance between adjacent parallel connecting lines must be no less than 3 mm, between separate CGS — no less than 2 mm, and between two adjacent lines of a specific graphical symbol — no less than 1 mm. Breaks in connecting lines terminating in arrows indicating connection points and (or) the required characteristics of circuits are permitted.
Devices that have an independent circuit diagram of their own are drawn on the diagrams as a rectangle or another simplified flat figure with a solid line (it is permitted to depict it with a line twice as thick as the connecting line). The outlines of a figure denoting a functional group or a device that does not have an independent circuit diagram of its own are drawn with a dash-dot line. If there are several such devices in the diagram and they have an identical circuit diagram, it is permitted not to repeat the diagrams of all these devices except one, and to depict the rest as rectangles. It is recommended to use no more than three line thicknesses in a single diagram.
The graphical symbols of the elements being connected and the connecting lines should be arranged on the diagram in such a way as to provide the best representation of the structure of the product and of the interaction of its main parts.
Diagrams should be accompanied by a parts list, which is placed on the first sheet of the diagram in the form of a table, or drawn up as a separate document. When a list of elements is placed on the first sheet of the diagram, it is positioned above the title block at a distance of no less than 12 mm from it. When a list of elements is drawn up as a separate document, it is drawn on an A4-format sheet. In this case the title block is executed in accordance with GOST 2.104:2006 [ 5 ] (in form 2 for the first sheet and in form 2a for subsequent sheets).
Diagrams may include various technical data, the nature of which is determined by the purpose of the diagram. They are indicated either next to the graphical symbols, if possible to the right or above them (for example, the nominal values of parameters), or in a free area of the diagram, if possible above the title block (for example, diagrams, tables, textual instructions). In addition, they may be placed inside the graphical symbols, above the connecting lines, in a break in the connecting lines, or next to the ends of the connecting lines. In the area of the diagram above the title block, it is permitted to place any necessary technical instructions.
The name and code of a diagram are determined by its kind and type. The name of a combined diagram is determined by the combination of the kinds and types of the diagram. The name of a merged diagram is determined by the kind of the diagram and the merged types of the diagram.
The code of a diagram must consist of a letter part, determining the kind of the diagram, and a digit part, determining the type of the diagram.
The kinds of diagrams are denoted by letters:
The types of diagrams are denoted by digits:
For example, an electrical circuit diagram — E3; a hydraulic connection diagram - G4; a division structural diagram - Ye1; an electro-hydraulic circuit diagram - S3; an electro-hydro-pneumo-kinematic circuit diagram - S3; an electrical connection and interface diagram - E0; a hydraulic structural, circuit and connection diagram – G0. Examples of the execution of individual kinds of diagrams are shown in the figures.

Comments