Lecture
We will write scripts that support all modern browsers. Although they strive to maintain standards, there are still differences.
Most developers first write scripts under Firefox or Chrome. If everything works, the script is tested in other browsers, for example in Internet Explorer. If you are running Linux or MacOS, then IE can be run in a Windows virtual machine.
When developing scripts errors are always possible ... But what am I saying? You will definitely have mistakes, unless of course you are a human being, and not an alien robot.
To read them in a convenient form, as well as get a lot of useful information about the execution of scripts, browsers have development tools .
Firefox uses the Firebug extension for development. It must be installed after installing the browser.
Put it from the page:
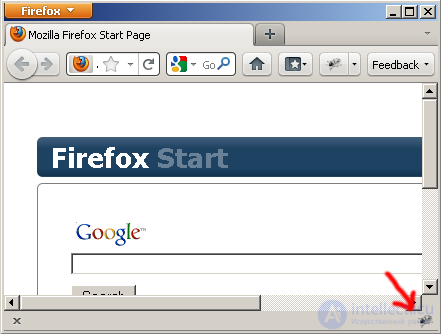
Restart the browser. Firebug will appear in the bottom right corner of the window:
If the icon is not visible, it is possible that your extensions panel is turned off. Press Ctrl + \ to display it.
Well, if it is not there, then press F12 — this is a hot key to launch Firebug, nobody usually launches it with the mouse.
So, open Firebug. Here the illustrations in English, the Russian version is similar.
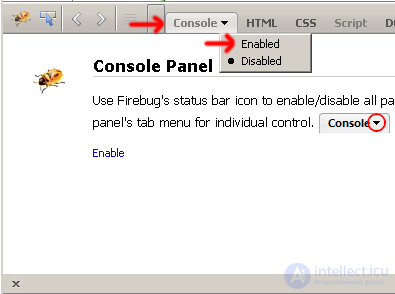
The console is initially turned off. You need to enable it in the Консоль -> панель включена menu Консоль -> панель включена :
With Firebug open, go to the error page: bug.html.
You can view its source code by pressing Ctrl + U
The console will display an error:
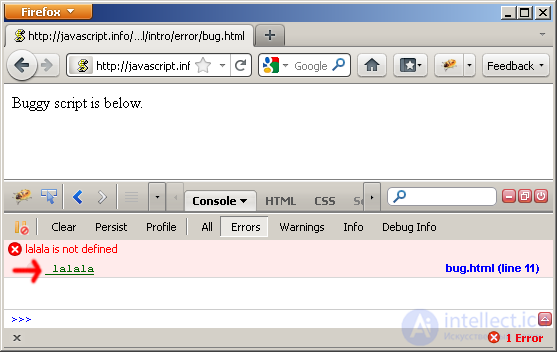
In this case, the lalala code is incomprehensible to the interpreter and caused an error.
Click on the line with the error and the browser will show the source code. If necessary, include additional panels.
You can read about the main features on the site firebug.ru.
In IE, starting from version 8 (or better than 9) there is a similar debugger. By default it is disabled.
Go to the menu.
Tools -> Internet Options (Rus. Инструменты -> Свойства обозревателя ) 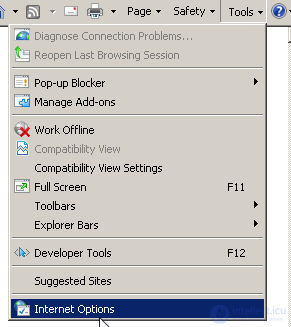
Свойства обозревателя : 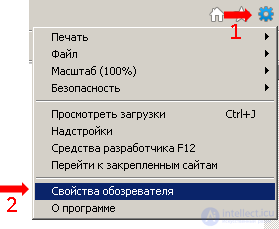
Switch to the Дополнительно tab and scroll down until you see two checkmarks that start with Отключить отладку сценариев .
By default they are marked. Uncheck them:
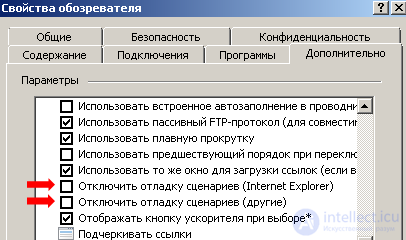
Restart the browser.
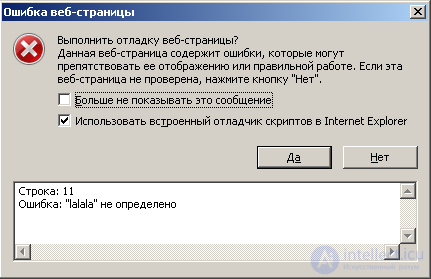
Check the error page: bug.html.
A window appears asking you to start debugging. Click "Yes" - and you are in the debugger.
Now the debugger along with other development tools is available on the F12 button.
Hotkeys: Ctrl + Shift + I , Ctrl + Shift + J
Инструменты -> Инструменты разработчика menu Инструменты -> Инструменты разработчика :

Hotkeys: Ctrl + Shift + I , Ctrl + Alt + C
To access the development functionality through the menu:
Open the menu by clicking the wheel on the right-top and select Настройки .
Then the Дополнительно tab: 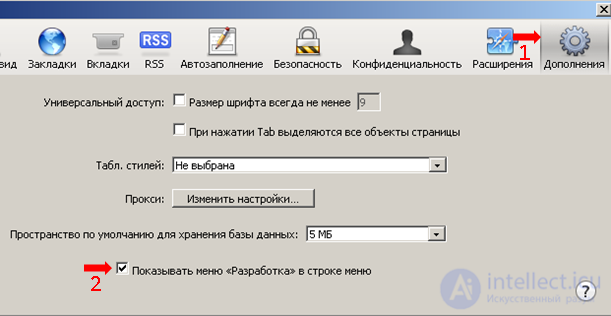
Check the Показывать меню "Разработка" в строке меню . Close the settings.
Показать строку меню . The tools will be available in the menu bar that appears, under Разработка .
In Opera, the keyboard Ctrl + Shift + I works.
You can enable and access through the menu.
To do this, you first need to turn on the menu: 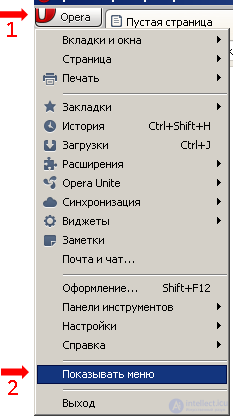
Now in the menu: Инструменты -> Дополнительно -> Opera Dragonfly . You're at the place.
For IE <8, the main development tool is the Microsoft Script Debugger. He has 4 options, the best one is included in the delivery of Microsoft Visual Studio (paid, not Express).
When installing the studio, disable all additional options so as not to put too much.
There is also an Internet Explorer Developer Toolbar for working with a document. You will need it to support IE7 and, possibly, IE6.

Comments