Lecture
Это продолжение увлекательной статьи про состояние жёстких дисков.
...
them and, therefore, he has nothing to fix in SMART.
Thus, SMART is a useful technology, but you need to use it wisely. In addition, even if the SMART of your disk is perfect, and you constantly arrange the disk checks - do not rely on the fact that your disk will "live" for many years. Winchesters tend to break down so quickly that SMART simply does not have time to display its changed state, and it also happens that there is obvious discord with the disk, but everything is fine with SMART. It can be said that a good SMART does not guarantee that everything is fine with the drive, but a bad SMART is guaranteed to indicate problems . At the same time, even with a poor SMART utility can show that the state of the disk is “healthy”, due to the fact that critical attributes have not reached the threshold values. Therefore, it is very important to analyze SMART yourself, without relying on the “verbal” evaluation of programs.
Although the SMART technology works, the hard drives and the concept of "reliability" are so incompatible that it is considered to be just a consumable material. Well, like cartridges in a printer. Therefore, in order to avoid the loss of valuable data, make their periodic backups to another medium (for example, another hard drive). It is optimal to make two backups on two different media, not counting the hard drive with the original data. Yes, this leads to additional costs, but believe me: the cost of restoring information from a broken HDD will cost you many times — if not an order of magnitude or more — more expensive. But the data can not always recover even the professionals. That is, the only way to ensure reliable storage of your data is to backup them.
Finally, we list some programs that are well suited for analyzing SMART and testing hard drives: HDDScan (works in Windows, free), CrystalDiskInfo (Windows, free), Hard Disk Sentinel (paid for Windows, free for DOS), HD Tune (Windows, paid , there is a free old version).
for Linux ( Linux ) system: smartctl -a / dev / sda
And finally, the most powerful programs for testing: Victoria (Windows, DOS, freeware), MHDD (DOS, freeware).
In the previous post about the time between failures (the article "Is it possible to accurately predict hard disk failure"), we noted that the most popular method of predicting the lifetime of a hard disk is not quite accurate. Yes, the noise and friction of the HDD head are fairly reliable and obvious indicators that the hard disk is on the verge of failure. But this is not very relevant, say, if your hard drives are located out of earshot, in a remote data center, on a server.
Generally speaking, the use of the mean time to failure (MTBF) metric for hard drives is misleading in assessing the durability of storage devices. Uptime is calculated on average for a large number of disks. As a result, inadequately high, optimistic indicators — say, 1.5 million hours of stable work — are almost 200 years old. For enterprise-class hard drives, these are fantastic metrics. The methodology sounds good (judging by the description), but, alas, the result has little to do with the average lifespan of a hard disk in "field conditions".
Most manufacturers, however, also offer more sophisticated methods for predicting HDD crashes. In particular, many data storage devices, HDD drives contain in the firmware a set of tools for self-monitoring, analysis and reporting (SMART), which transmit the hard disk performance metrics to the operating system. This data can be viewed and analyzed using software provided by IT administrators for more thorough monitoring and health assessment of the hard disk.
Metrics are tracked Smart - called attributes - vary from manufacturer to manufacturer, but typical hard disk parameters include such basic metrics:
Verifying the SMART data of your storage devices is usually a fairly simple procedure available to all users.
You can purchase smart software designed specifically for your hard drive. With this software you can extract SMART readings. However, the presence of proprietary software for your hard drive is not a prerequisite.
If you are using Windows, you can quickly access the SMART of your hard disk and the attributes of their readings using the command line.
Check your hard drive for errors
Of course, if you plan to monitor and analyze SMART data more actively, then there are more convenient graphical tools available on several platforms. One of the successful examples is Victoria's diagnostic utility, and if you seriously think about using SMART tools and monitor the health of your hard drives, then this is the right decision.
In addition, many other utilities for viewing SMART So, in the screenshot you can see the program AIDA4. This program is the most universal solution for analyzing the system as a whole and viewing hard disk metrics in particular.
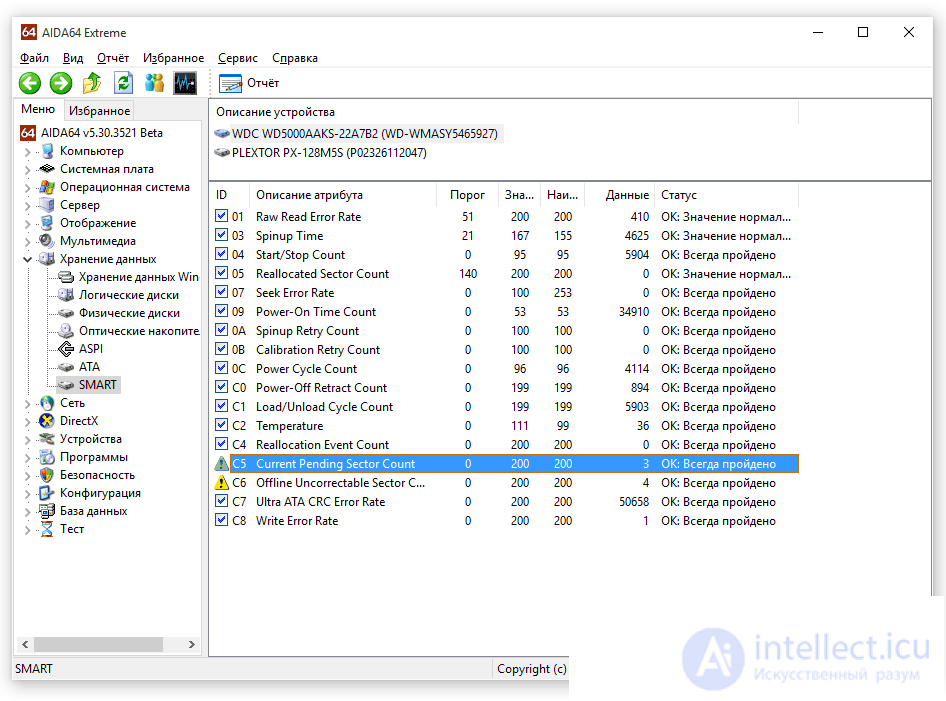 View SMART data through the AIDA4 service utility (formerly Everest) on your hard drive
We have yet to discuss whether SMART tools are, in fact, a reliable indicator of hard drive performance and wear. The answer is yes and no. While some SMART attributes are useful in predicting errors on HDDs, it is also commonly accepted that the SMART system is not without limitations and errors in the recording of HDD readings.
In particular, SMART cannot predict a 100% ordinary HDD failure, because not all causes of a hard disk failure are predictable and obvious. At the same time, those errors that occur during regular mechanical wear of the device, as a rule, are marked as abnormal SMART readings, and sudden electronic failures and component failure are not. To put this in perspective, in 2007, Google investigated 100,000 consumer-grade hard drives and found that 64 percent of failures over nine months did not fall under SMART accounting.
Another factor that makes SMART attributes themselves less reliable: they vary from manufacturer to manufacturer, even in terms of how to measure common attributes. Thus, Seagate and Western Digital hard drives devices with equivalent health readings can give completely different readings and, in particular, the error rate.
Last November, a backup cloud service developer, Backblaze, published an exciting study on various SMART attributes. Based on the readings of nearly 40,000 hard drives storing 100 petabytes of customer data, they concluded that of the 70 attributes available, only five were true indicators of hard drive failure.
In fact, SMART HDD attributes can predict some types of failures for hard drives, but they cannot provide 100 percent accurate hard drive diagnostics. As we have noted before, unfortunately, not all hard disk failures are predictable and monitored.
Thus, the owners of any hard drives should never fully rely ONLY on SMART - or any other simplified diagnostic system. Still, this does not completely prevent data loss. The nature of electromechanical devices means that it is always better to combine different methods of protection: SMART, backup and recovery.
All malfunctions of HDD drives can be divided into 2 groups:
Physical faulty drives are HDDs that have damage to the surface or a block of magnetic heads, destruction of service information, resulting in unstable reading and multiple errors, a violation of the logical disk space (LBA) matching system with the physical geometry of the HDD (translator).
Logical disruption means the destruction of a logical structure that does not allow access to user information by means of the operating system. Destructions can be caused by failures or malfunctions in the drive or the operating system itself, incorrect user actions, or exposure to virus programs.
The factory (calculated) probability distribution of failure is built under the following conditions - the temperature is constant, the supply voltage is constant.
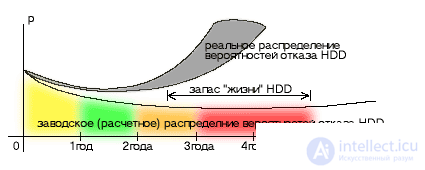
 area of failure of the hidden factory marriage (the effect of BP is minimal) area of failure of the hidden factory marriage (the effect of BP is minimal) |
 stable work area stable work area |
 area of accumulation of wear and its compensation area of accumulation of wear and its compensation |
 plot of probable failure due to wear. At this stage, additional factors appear - aging of the PSU, increase in the load on the PSU due to the modernization of the computer, deterioration of the cooling due to dust - the effect of the PSU on the hard disk increases plot of probable failure due to wear. At this stage, additional factors appear - aging of the PSU, increase in the load on the PSU due to the modernization of the computer, deterioration of the cooling due to dust - the effect of the PSU on the hard disk increases |
By eliminating factors that are harmful to the “health” of HDDs, its operating conditions can be brought closer to the ideal and thereby extend the lifespan of the hard disk to the calculated (factory) values - actually 2-3 times.
HDD failure analysis
|
||||||||||||||||||||||||
We live in the heyday of HDD: volumes reached 4TB per disk (and this is not the limit), prices for large (1-4TB, 7200 thousand revolutions / min) and fast (10/15 thousand revolutions / min) HDD decrease, everywhere SSDs are used, performance is increasing, and hardware RAID controllers are increasing in functionality; they have matured ZFS solutions for a long time. There was a problem: arrays for several tens of terabytes became available to relatively small organizations, but the level of knowledge of the rules and recommendations for data storage remained low. This leads to very deplorable consequences - direct initial monetary losses (the result of independent activities in the choice of equipment) and further damage from data loss.
In this article we will look at several problems and myths associated with data storage. There are plenty of myths and they continue to live, despite the huge number of tragic stories:
It occurs mainly in novice inexperienced IT specialists. The reason for the existence of this myth is simple - a misunderstanding of what information is in general and how RAID is related to the protection of the integrity of information. The fact is that RAID protects not only from the complete loss of the disk. The final disk failure is only the end point of its difficult existence, and until the information is lost on the entire disk, we can lose small fragments as bad sectors appear. For home use, the loss (or distortion) of a 512-byte portion is usually not a big problem. At home, most of the disk space is occupied by multimedia files: images, sound and video, so that the loss of a tiny fragment does not affect the perceived quality, for example, of a video file. To store structured information (for example, a database), any distortion is unacceptable and the appearance of any “bad” (unreadable bad sector) means a complete loss of a file or volume. The statistical probability of the occurrence of such an event, we will consider later.
Conclusion: user data cannot be stored on single disks or in arrays that do not provide redundancy.
Losing data from a redundant array is not easy, but very simple. You can start with a simple human factor, which in statistics regularly collected by different agencies, occupies the lion's share of all cases of data loss. It is enough for the DBMS administrator to put a couple of tables in the database or for some user to delete several files on a resource with incorrectly configured access rights. When working with a controller or storage system, you can mistakenly delete the desired volume. An unprotected controller cache can be the cause of a disaster (write-back is on, there are no batteries, or it is faulty, the power supply unit or PDU fails - and several tens or hundreds of megabytes that do not fall on data disks fly into the pipe).
Backup is always needed. Lack of backups is a crime.
Did you know that with a certain combination of the number, size and quality of disks in RAID-5, you are almost guaranteed to lose your data during a rebuild? The remaining part of this article will be devoted to a detailed review of the declared reliability indicators of hard drives.
"If desktop disks are so unreliable, then it is worthwhile to simply buy them more, put them in RAID, let them break down by 2-3-10% per year, we will change"
Then there is another problem related to quality - UER (unrecoverable error rate). It means the likelihood of an unrecoverable read error, for various reasons: surface defect, failure of the head, controller, etc. For modern desktop drives, the UER value is 1 x 10-14. This means that when transferring 1 x 1014 bits, you are very likely to read from the disk is not at all what was written there. Further, entertaining mathematics begins, published in one of the reports of SNIA:
A 500GB drive contains 1/25 x 1014 bits. Suppose we have a RAID-5 of six such desktop drives with a UER of 1 x 10-14. Up to a certain point, everything works well, bad sectors appear and remap on disks, this does not result in data loss, since we have RAID. And here one of the disks fails. We change the disk, the rebuild begins, which means reading 5/25 x 1014 bits: from five disks you need to read stripes and checksums, calculate and write them to the sixth disk.
5/25 is 20%. with a probability of 20% with a rebuild, we get a read error and lose data. 500GB by today's standards is not very much, there are 1, 2, 3 and even 4 terabytes of disks in the course. For an 8x1GB array, we get 56%, 8x2GB - already 112% (no chance!), For "super-big-storage-for-life" from 24 desktop disks of 3TB, a fantastic figure of 552% is obtained. This probability can be slightly reduced by periodically running background data integrity checks on the array. You can reduce it significantly, by an order of magnitude, using the correct disks of a nearline class with UER = 1 x 10-15, but for large arrays the figure is still unacceptable because the probability of a complete failure of the second disk during the rebuild, which at large volumes is not taken into account and high load on the array can take several weeks.
Conclusion: for large volumes of modern disks, RAID-5 cannot be used . Even for enterprise-class drives (UER is even smaller by an order of magnitude - 1 x 10-16), the probability of getting a read error when rebuilding an array of eight 450GB disks is about 0.3%. Their capacity is also growing. If relatively recently the disks at 10,000 and 15,000 rpm were 36-146GB in volume, now it is already 900 and 1,200GB. What to do?
Firstly, for enterprise drives, do not create large disk groups in RAID-5, use RAID-50.
Second, switch to RAID-6 and 60 for enterprise and nearline drives.
How to still be with desktop drives? Maybe RAID-6 is right for them?
No, RAID-6 will not save them either, since the following problem appears - incompatibility with hardware RAID controllers, one of the reasons for which is the uncontrolled access time when errors occur:
For a single disk, when a read error occurs, the goal is to read the data from this sector through repeated attempts. Disk one, there is nowhere to take a copy of the data. For a disk in a RAID array with redundancy, a bad sector presents no problem. The sector is not read? The disk is given a fixed time for several attempts to read this sector. Time is up, the sector is immediately re-mapped, data is being restored from other disks. If the disk does not respond for a long time, then the controller considers it faulty and throws it out of the array, and in practice a bundle, for example, from the Adaptec controller and desktop computers, WD Green works with regular disk loss and permanent rebuilds, up to the complete collapse of the array.
For a fixed access time is responsible technology SCT ERC. You can see the presence of its support and read / write values using the smartctl:
 smartctl -l scterc / dev / sdb
 smartctl 6.1 2013-03-16 r3800 [x86_64-linux-3.8.7-1-ARCH] (local build)
 Copyright (C) 2002-13, Bruce Allen, Christian Franke, www.smartmontools.org
 SCT capabilities: (0x303f) SCT Status supported.
                         SCT Error Recovery Control supported.
                         SCT Feature Control supported.
                         SCT Data Table supported.
       SCT Error Recovery Control:
       Read: Disabled
       Write: Disabled
If you have support, you can set the timings:
 smartctl -l scterc, 70,70 / dev / sdb
 smartctl 6.1 2013-03-16 r3800 [x86_64-linux-3.8.7-1-ARCH] (local build)
 Copyright (C) 2002-13, Bruce Allen, Christian Franke, www.smartmontools.org

 SCT Error Recovery Control set to:
            Read: 70 (7.0 seconds)
           Write: 70 (7.0 seconds)
In fact, SCT ERC support alone is not enough. The decisive criterion for selecting disks should be the presence in the list of compatibility from the manufacturer of the controller:
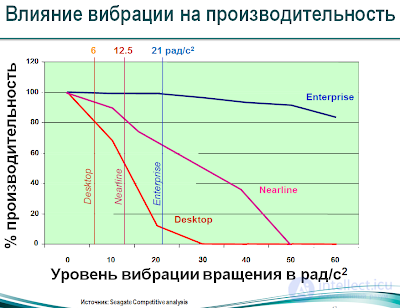
And the last argument: desktop drives are not designed for high vibration levels. Mechanics is not the same. The reasons for the appearance of vibration loads are simple: a large number of disks in a single package (the Supermicro has a variant for 72 3.5 "disks in 4U) and fans at 5-9 thousand revolutions per minute. So, Seagate measurements showed that at a load of about 21 rad / s2 desktop disks have very great difficulties with head positioning, lose track, performance drops by more than 80 percent.
Devices for storing information on hard disks have traditionally been installed mainly on desktop computers, but lately, drives have increasingly been used in consumer electronics. This article describes how to assess the reliability of drives installed in desktop computers and consumer electronic devices using the results of standard laboratory tests from Seagate.
Under the time between failures, Seagate means the ratio of RON time (Power-On Hours - the time in hours during which the drive was on) during the year to the average failure rate (Annualized Failure Rate) ( AFR ) for the first year. This method gives sufficient accuracy with a small number of failures, so we use it to calculate the time between failures of the “first year”. The average annual failure rate for the drive is calculated based on the data on the uptime, obtained during the RDT (Reliability-Demonstration Test) tests. FRDT factory tests (Factory Reliability-Demonstration Test - factory demonstration reliability tests) are carried out using the same methodology, however, serial drives from production series are checked here. In this document, we will assume that any concept applicable to RDT is also valid for FRDT .
In the Seagate Personal Storage Group, headquartered in Longmont, Colorado, reliability tests for desktop systems are usually conducted in heat chambers at an ambient temperature of +42 degrees Celsius, which increases the failure rate. In addition, the drives are operated with the maximum possible power-on time (the drive power-on time is the number of data searches, reads and writes for a given period of time). This is done in order to identify as many causes of failure as possible at the product development stage. By eliminating the problems noted at this stage, we can be sure that our users will no longer face them.
Suppose that 500 drives were subjected to RDT testing, each of which worked for 672 hours at an ambient temperature of 42 ° C. Suppose also that during the test three failures were noted (after 12, 133 and 232 hours of operation). This means that out of 500 verified drives, we successfully passed the test of 497. For analysis and extrapolation of the obtained results, we use Weibull simulation using the SuperSmith software package from Fulton Findings1. In particular, using the maximum likelihood method, we estimate such parameters of the Weibull distribution as beta (form factor) and this (scale factor).
(That is, a priori it is assumed that the failures are distributed according to Weibull. For those who are familiar with mathematical statistics, I will give the probability density formula for this distribution:
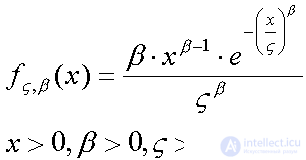
The meaning of the tests is to assess the distribution parameters. In this case, it is considered that for a given value of beta , this parameter is equal to the time in hours, over which 90% of the drives tested fail. (Discussion of this mathematical model requires serious knowledge of mathematical statistics and is beyond the scope of this article, therefore it is proposed to accept it as a fact) - approx. editor) .
If during the test five or fewer failures are noted, the beta parameter cannot be accurately determined from the data obtained. Since such test results are quite common, we analyze them using the WeiBayes 2 method, which is based on estimating the beta parameter from statistical data. In the laboratory of products for desktop computers, we now accept beta = 0.55. This value is derived from the production data presented in the table below. It was compiled on the basis of testing all drives for desktop systems that were tested before March 1999.
| Drive production site | Database | Average beta | Standard deviation beta |
|---|---|---|---|
| Longmont | 37 RDT, 5 FRDT | 0.546 | 0.176 |
| Perai | 2 RDT, 4 FRDT | 0.617 | 0.068 |
| Vusi | 1 RDT | 0.388 | no data |
| Summary of Desktop Information | 49 tests | 0.552 | 0.167 |
The graph below shows the results of the Weibull and WeiBayes analysis . The solid line corresponds to the Beta and this parameters by Weibull ( beta = 0.443, this = 69 331 860), calculated using the MLE method (Maximum Likelihood) 3 for a total of 3 failures on 500 drives. As already noted, such results are considered not as accurate as those obtained by the WeiBayes method for low failure rates.
The results obtained by the WeiBayes method (for beta = 0.55) are shown in the graph with a dotted line. Since 672 hours of operation at a temperature of 42 ° C is sufficient for testing RDT , we used our internal parameter “confidence probability of test termination” 4, which for analysis of WeiBayes was assumed to be 63.2%. The calculation using the WeiBayes method showed that at a temperature of 42 ° C and a statistical value of beta = 0.55, this acceptable value is 3,787,073 hours.
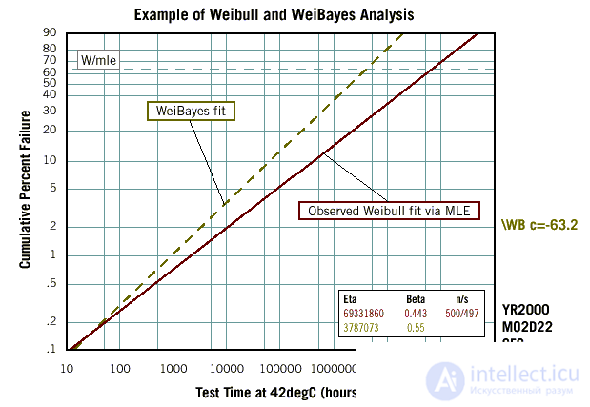
Legend to the graph “Examples of analysis by the methods of Weibull and WeiBayes ”
W / mle = Confidence probability of the test termination
WeiBayes fit = WeiBayes approximation
Observed Weibull fit via MLE = Approximation of Weibull study data by maximum likelihood method
Eta = this
Beta = beta
n / s = (total / good drives)
The next stage of the analysis is to convert this parameter, obtained as a result of tests at 42 ° C, to the value corresponding to our standard operating temperature (25 ° C). Based on the Arrhenius5 model, to take into account temperature differences, it is possible to take the coefficient of increasing failures equal to 2.2208. Thus, this value for 25 ° С ( eta25 ) will be equal to the value of this parameter for 42 ° С ( eta42 ), multiplied by 2.2208, that is, 8 410 332 hours.
Based on the beta and this Weibull parameters obtained after temperature correction, the total failure rate can be calculated at any time. To estimate the percentage of accumulators that can fail at a temperature of 25 ° C in the time interval from t1 to t2 , it is enough to subtract the values of the total failure rate at t1 and t2 , and then use the corresponding values of beta and eta25 .
To estimate the average failure rate (parameter AFR ) for the first year of operation of the drive installed in the desktop computer, we assume that the user has the device in the on state of 2,400 hours per year. Suppose also that for another 24 hours it was operated at the plant during the integration phase. Since all drives that failed during this period are returned to Seagate and are not returned to the end user, they are not taken into account when calculating AFR and MTBF for the first year.
Taking into account the above (inclusion time 100%, eta25 = 8,410,332 hours, beta = 0.55 and total work time for the year 2,400 hours), the relative failure rate for the first year can be calculated as the failure rate that occurred between 24 hours ( t1 ) and 2,424 hours ( t2 ). The results of such a calculation are given below in a table built on the basis of MTBF during the first year and the data obtained during the RDT tests.
| Baseline: 2,400 hours / year | |
|---|---|
| Form factor for Weibull ( beta ): | 0.55 |
| Weibull scale factor ( this ): | 8 410 332 |
| Р (refusals) from 0 to 2 400 hours / year: | 1,123% |
| Р (refusals) from 0 to 24 hours: | 0.089% |
| ————— | |
| AFR for the first year | 1.0338% (before rounding) |
| Operating time for the year: | 2,400 hours |
| AF R for the first year: | 0,010338 |
| ————— | |
| Fail time for the first year of Weibull: | 232 140 hour |
( P (failures) are calculated on the basis of the Weibull distribution - see the graph. Further it is clear: MTBF for the first year = Lifetime for the year / AFR for the first year - editor's note ).
As the above calculations show, if the drive is used at a temperature of 25 ° C and is in the on state of 2,400 hours per year, it can be expected that when the user works, the average time between failures will be 232,140 hours. However, such conditions are not always observed in consumer electronics. In some household appliances, for example, the drive can work almost continuously, therefore, its operating time per year will far exceed 2,400 hours. In other devices, for example, video game consoles, this figure may be significantly lower. The following sections describe exactly how you can adjust the calculated value of time between failures for different intensity of use, on-time and ambient temperature.
It is possible to take into account changes in the mean time to failure caused by differences in the intensity of use of the drive, using the reduced graph.
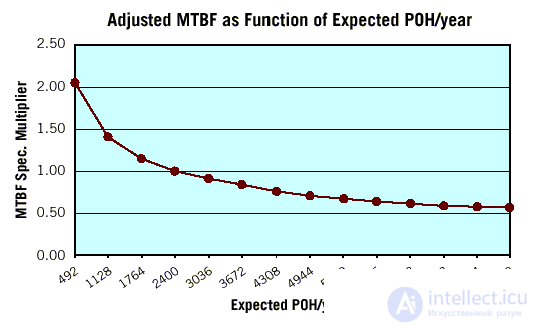
Legend to the schedule “Correction of mean time between failures depending on the expected time of the drive for the year”
The name of the vertical axis - Correction factor for MTBF
The name of the horizontal axis - The expected time of the drive for the year
For example, if the time between failures for 2,400 working hours per year is known, and the real working time per year is 8,760 hours, then the average time between failures will decrease approximately by half. And vice versa: when the drive works a little, as it happens in some video game consoles, the mean time to failure can almost double.
Now let's see how the time between failures changes as the operating temperature rises. To build a graph of the temperature coefficient of time between failures, you can use the same Arrhenius model, which we used to determine the rate of increase in failures. The table below shows how the time between failures is reduced in the first year (if the duration of inclusion is 100%) at an ambient temperature above 25 ° C.
| Temperature, ° С | Failure rate | Temperature coefficient to reduce the time between failures | Corrected time between failures |
|---|---|---|---|
| 25 | 1.0000 | 1.00 | 232,140 |
| 26 | 1,0507 | 0.95 | 220 533 |
| thirty | 1.2763 | 0.78 | 181,069 |
| 34 | 1.5425 | 0.65 | 150 891 |
| 38 | 1,8552 | 0.54 | 125 356 |
| 42 | 2,2208 | 0.45 | 104 463 |
| 46 | 2.6465 | 0.38 | 88 123 |
| 50 | 3.1401 | 0.32 | 74 284 |
| 54 | 3.7103 | 0.27 | 62 678 |
| 58 | 4.3664 | 0.23 | 53 392 |
| 62 | 5.1186 | 0.20 | 46,428 |
| 66 | 5.9779 | 0.17 | 39,464 |
| 70 | 6.9562 | 0.14 | 32 500 |
As can be seen from the table, as the ambient temperature rises, the temperature coefficient for reducing the time between failures and the corrected time between failures is significantly reduced. Thus, at 42 ° C, the rate of increase in failures is 2.2208 (as was determined in the course of this analysis earlier). And the coefficient of correction of time between failures for the same temperature is 0.45, that is, the average time between failures at a temperature of 42 ° C is more than two times less than at a temperature of 25 ° C.
The duration of the inclusion of most drives installed in personal computers is from 20 to 30%, whereas in consumer electronic devices, this indicator may be higher or lower. Measuring the amount of data that is sent inside modern consumer electronics devices for a day, Seagate experts found that the duration of the inclusion of drives in them is only 2.5%.
To determine how the time between failures changes when the on-time is 2.5% compared to 100% (this value is typical for RDT tests), it is necessary to find out what effect these components on storage drives have on the process, the state of which depends on the turn-on time, which - its other elements. The number of dependent components in the drive is directly proportional to the number of hard disk drives in it. The relationship between the number of hard drives and the average failure rate for the first year is shown in the following illustration. The space under the dotted line on this graph corresponds to the “baseline” —that is, regardless of how long the device has been running — the failure rate of a hypothetical drive with zero number of hard drives (or a drive that does not read, write, or search for information) . The solid line indicates the expected failure rate as a function of the number of hard drives.
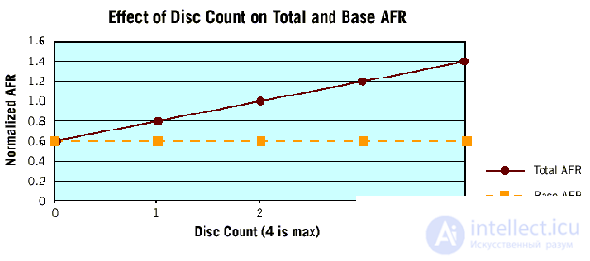
Legend to the graph "The dependence of the total and basic average failure rate on the number of hard drives in the drive"
Vertical axis name - Normalized AFR value
The name of the horizontal axis - The number of plates of hard drives (no more than 4)
Total AFR = Total Average Failure Rate
Base AFR = Base Average Failure Rate
As can be seen from the graph, reducing the duration of inclusion reduces the number of only those failures that are associated with the time of the drive (the space between the dotted and solid lines). Knowing the relationship between the number of failures, depending on the duration of the inclusion, and their total number, we can estimate the influence of the duration of the inclusion on the average failure rate AFR. So, for a drive with four hard drives, the total failure rate will be 1.4%, and the base - 0.6%. A reduction in the on-time will reduce the probability of failure by [(1.4 - 0.6) / 1.4] = 57%. Thus, by reducing the operating time of the four-disk drive, we can reduce the probability of failure by only 57%, the rest of the problems do not depend on the duration of the switch-on.
The change in MTBF for drives with different numbers of hard drives is presented in the following graph.
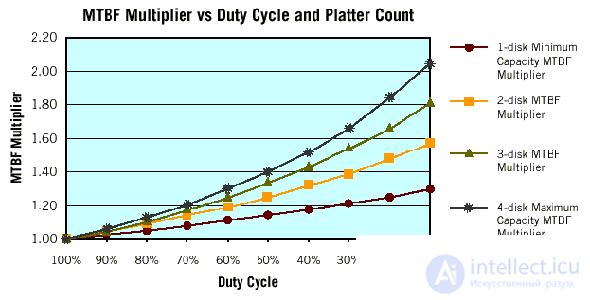
Legend to the graph “The dependence of the time between failures and the drive enable time and the number of hard drives in it”
Vertical axis name - MTBF
Horizontal axis name - Duration of activation
1-disk ... = For a minimum capacity drive with 1 hard disk
2-disk ... = For a drive with 2 hard drives
3-disk ... = For a drive with 3 hard drives
4-disk ... = For a maximum capacity drive with 4 hard drives
Continuing the analysis, we estimate the combined effect of different on-time values and temperature coefficients for reducing the time between failures for several drives. The graph on the bottom left shows the MTBF correction factors for a high-capacity storage device with 4 hard drives for various combinations of on-time and ambient temperature. The figure on the right displays the same factors for a drive equipped with only one hard disk. As can be seen from these graphs, depending on the duration of the switch-on and the operating temperature of the drive installed in the PC, the effective time between failures for the first year may be higher, equal or lower than the expected value of this parameter, calculated from the results of factory tests. In this case, on a drive with one hard disk, the change in the duration of switching on and the ambient temperature is less pronounced, and the correction coefficients are much smaller here.
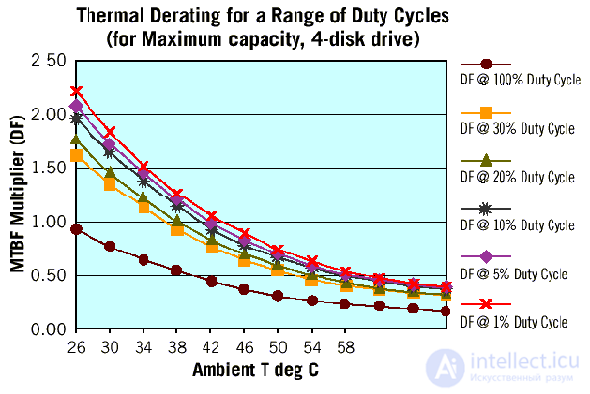
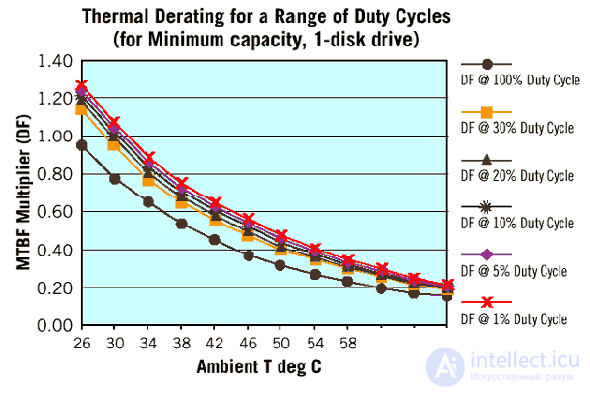
Legend to the graphs “Reduction of time between failures depending on temperature and on-time (for a maximum capacity drive with 4 hard drives / minimum capacity with 1 hard drive)”
The name of the vertical axis - the reduction rate of time between failures
The name of the horizontal axis - Ambient temperature, ° C
DF @ 100% ... = Power On Time = 100%
DF @ 30% ... = Power On Time = 30%
DF @ 20% ... = Power On Time = 20%
DF @ 10% ... = Power On Time = 10%
DF @ 5% ... = Power On Time = 5%
DF @ 1% ... = Power On Time = 1%
According to the Weibull distribution, which describes the dependence of time between failures and service life, if the beta value is less than one, the probability of equipment failures decreases with time. For this reason, the failure rate of drives in the first year of operation should be higher than in subsequent years. But what will be the failure rate or the average time between failures, if we average these figures over the entire operation of the drive? Below are three methods for assessing reliability, allowing you to answer this question.
Сравнение всех трех моделей приведено в таблице ниже.
| МОДЕЛЬ: | |||||||
|---|---|---|---|---|---|---|---|
|
Weibull |
According to |
»Плоская» модель |
|||||
|
Год эксплу- атации |
Суммарная продолжи- тельность включения |
Интен- |
Суммар- |
Интен- |
Суммар- ная |
Интен- |
Суммар- ная |
| one | 2 400 | 1,20% | 1,20% | 1,20% | 1,20% | 1,20% | 1,20% |
| 2 | 4 800 | 0,55% | 1,75% | 0,78% | 1,98% | 0,55% | 1,75% |
| 3 | 7 200 | 0,43% | 2,18% | 0,39% | 2,37% | 0,55% | 2,30% |
| four | 9,600 | 0,37% | 2,55% | 0,55% | 2,86% | ||
| five | 12,000 | 0,33% | 2,88% | 0,55% | 3,41% | ||
| 6 | 14,400 | 0.30% | 3,18% | 0,55% | 3,96% | ||
| 7 | 16 800 | 0,28% | 3,46% | 0,55% | 4,51% | ||
| eight | 19 200 | 0,26% | 3,72% | 0,55% | 5,06% | ||
| 9 | 21 600 | 0,24% | 3,96% | 0,55% | 5,62% | ||
| ten | 24,000 | 0,23% | 4,19% | 0,55% | 6,17% | ||
Чтобы нагляднее продемонстрировать различия между моделями, мы приводим график суммарной относительной интенсивности отказов, построенный на основании каждой из них (время наработка на отказ для первого года эксплуатации принято равным 200 000 часов).
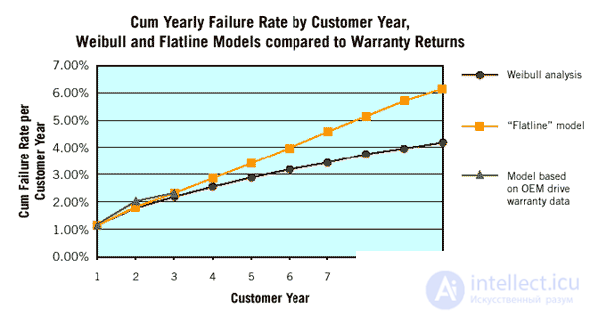
Легенда к графику «Суммарная годовая интенсивность отказов, рассчитанная по Weibull и «плоской» модели, в сравнении с данными гарантийного обслуживания»
Название вертикальной оси (между цифрами точки заменить на запятые) — Суммарная интенсивность отказов за год эксплуатации пользователем
Название горизонтальной оси — Год эксплуатации пользователем
Weibull analysis = Анализ по Weibull
«Flatline» model = «Плоская» модель
Model based... = Модель оценки по данным гарантийного обслуживания
Как видно из приведенного выше графика, «плоская» модель дает более осторожную оценку, чем «чистый» анализ по Weibull , и очень близка к оценке по данным гарантийного обслуживания Seagate за первые три года. Для простоты анализа, а также для того, чтобы получить более осторожные оценки, мы решили применять в своих расчетах «плоскую» модель.
When using a “flat” model,
продолжение следует...
Часть 1 HDD status and SMART technology and failure prediction. G-sensor in HDD. Types of malfunctions HDD.
Часть 2 Learning Smart to predict hard drive failures - HDD status
Часть 3 Final settlement - HDD status and SMART technology and failure
Comments
To leave a comment
Diagnostics, maintenance and repair of electronic and radio equipment
Terms: Diagnostics, maintenance and repair of electronic and radio equipment