Lecture
For convenience and clarity, further analysis of the effect of the filter on the signal in the frequency domain, let us present the signal as a set of elementary harmonic signals. Harmonic is a signal described by a sinusoidal function:
S (t) = A m sin (wt + j), (1)
where A m is the amplitude value of the signal, w = 2pF is the circular frequency expressed in radians, F = 1 / T is the signal frequency, T is the repetition period, j is the initial phase of the signal.
The harmonic signal is characterized by the fact that it lasts for an unlimited time interval and cannot be decomposed into elementary components.
It is known that any complex periodic signal can be represented as a sum of elementary harmonic signals using Fourier series. This is possible if the function describing the signal meets the Dirichlet conditions:
Let the signal be described by the function S (t), which has a frequency w = 2 pF. Applying the Fourier series decomposition, we get:
 , (2)
, (2)
where k = 1,2.3, ... etc. - numbers of harmonics, and the amplitudes of the decomposition: a o , a k and b k are determined from the expressions

 ,
, 
,
.
Spectrum concept
In addition to form (2), the function S (t) can be represented as:
 , (3)
, (3)
where: the amplitude A k and the initial phase j k are determined from the expressions:

Thus, the periodic function S (t) can be represented as a sum of terms, each of which is a sinusoidal oscillation with an amplitude A k and an initial phase j k .
Each component of the signal with a frequency kw is called a harmonic . Oscillation with frequency w is called the first harmonic, with frequency 2w - the second harmonic, etc.
The set of amplitudes of the harmonic components, represented as a function of frequency, is called the amplitude spectrum of the signal (amplitude spectrum). Similarly, the set of values of j k signal harmonics, represented in the interval of 0-360 degrees, is called the spectrum of phases .
The combination of A k and j k completely determine the frequency spectrum of the signal.
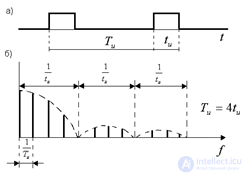
The amplitude spectrum and the phase spectrum for a periodic signal are called ruled , since they consist of individual components. For example, for a periodic signal of a rectangular shape, shown in Fig. 1, and the amplitude spectrum has the form shown in Fig. 1, b.


Pic.1
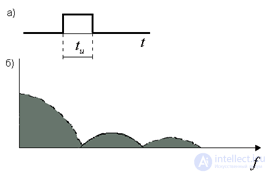
When the frequency of a periodic signal decreases, the number of harmonic components in its spectrum will increase accordingly, tending to infinity to the limit. Such a spectrum is called continuous and can be obtained using not the series, but the Fourier integral. For a single rectangular pulse, we have the spectrum shown in Fig. 2, b.
The Fourier transform of the function of a real variable is integral and is given by the following formula:

Comments
To leave a comment
Methods and means of computer information technology
Terms: Methods and means of computer information technology