
Lecture
The cardiovascular system performs vital functions, ensuring the constancy of the organism's internal environment. The heart muscle and blood vessels act in a coordinated way to meet the constantly changing needs of various organs and to serve as a network for supply and communication, since nutrients, gases, breakdown products, and hormones are carried with the bloodstream.
Among the indicators of the cardiovascular system, mean pulse rate and its variance are also often used.
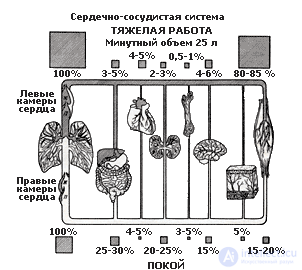
In an adult at relative rest, the systolic volume of each ventricle is 70-80 ml. Cardiac output — the amount of blood the heart ejects into the pulmonary trunk and aorta in 1 minute — is measured as the product of the systolic volume and the heart rate per minute. At rest, cardiac output is 3-5 l. During intensive work, cardiac output can increase substantially to 25-30 l, with cardiac output growing at first through an increase in systolic volume, and under heavy loads mainly through an increase in heart rhythm.
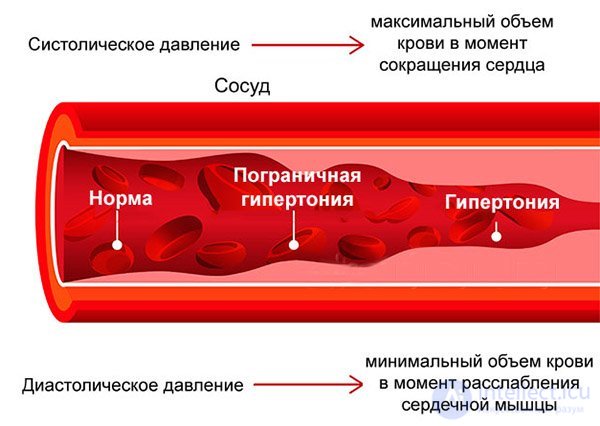
Blood pressure — a well-known indicator of cardiovascular system function. It characterizes the force of blood pressure in the arteries. BP changes over the course of the cardiac cycle, reaching a maximum during systole (contraction of the heart) and falling to a minimum during diastole, when the heart relaxes before the next contraction. Normal blood pressure of a healthy person at rest is about 130/70 mmHg, where 130 is the systolic BP and 70 is the diastolic BP. Pulse pressure is the difference between systolic and diastolic pressure, and normally is about 60 mmHg.
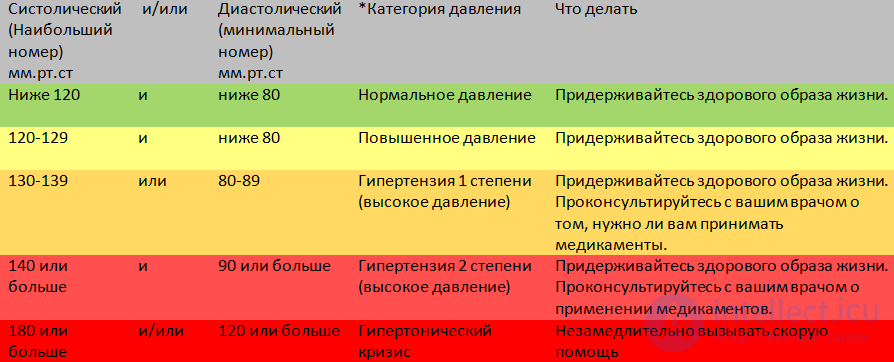
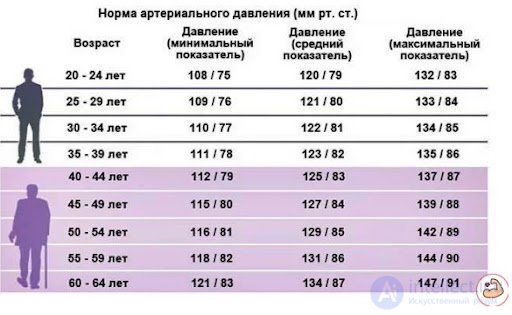
Heart rhythm — an indicator often used to diagnose a person's functional state, depends on the interaction of sympathetic and parasympathetic influences from the autonomic nervous system. In this case, increased tension in the heart's work can arise for two reasons — as a result of increased sympathetic activity and decreased parasympathetic activity.
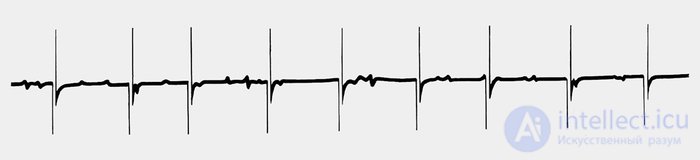
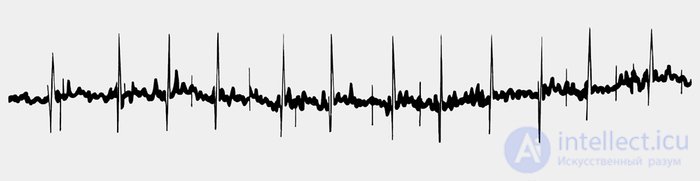
Electrocardiogram (ECG) — a recording of the electrical processes associated with the contraction of the heart muscle. It was first made in 1903 by Einthoven. Using clinical and diagnostic equipment, the ECG can be recorded using up to 12 different pairs of leads; half of them are associated with the chest, and the other half with the limbs. Each pair of electrodes records the potential difference between two sides of the heart, and different pairs give somewhat different information about the position of the heart in the chest and about the mechanisms of its contraction. In heart disease, deviations from the normal ECG shape may be found in one or more leads, and this substantially helps in making a diagnosis.
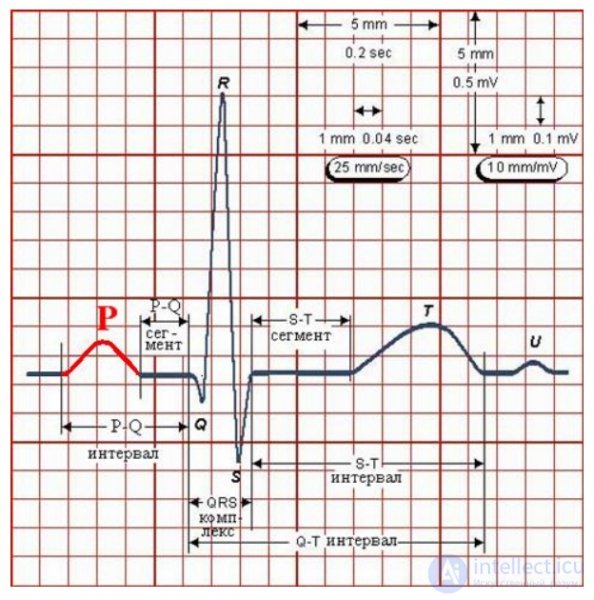
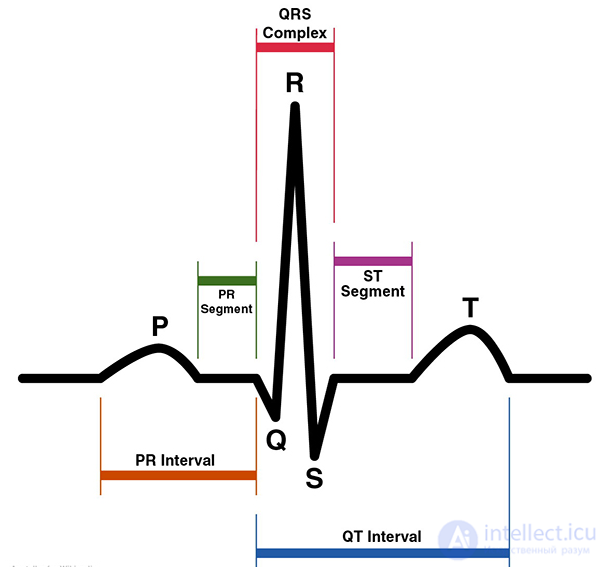
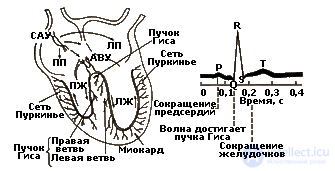
Normally, electrical impulses are automatically generated in a small group of cells located in the atria and called the sinoatrial node (SA node). This is why the normal heart rhythm is called sinus rhythm. When an electrical impulse, arising in the sinus node, passes through the atria on the electrocardiogram a P wave appears. Further, the impulse spreads to the ventricles through the atrioventricular (AV, AV node) node along the bundle of His. The cells of the AV node have a slower conduction velocity, and therefore there is an interval between the P wave and the complex reflecting excitation of the ventricles. The distance from the beginning of the P wave to the beginning of the Q wave is called the PQ interval. It reflects conduction between the atria and the ventricles and is normally 0.12-0.20 sec. Then the electrical impulse spreads along the heart's conduction system, consisting of the right and left bundle branches of the bundle of His (bundle of His) and Purkinje fibers (Purkinje fibers), to the tissue of the right and left ventricle. On the ECG this is reflected by several negative and positive waves called the QRS complex. Normally its duration is up to 0.09 sec. Then the curve again becomes flat, or as doctors say, is on the isoline. Then in the heart there occurs a process of restoring the initial electrical activity, called repolarization, which is reflected on the ECG in the form of a T wave and sometimes a small U wave following it. The distance from the beginning of the Q wave to the end of the T wave is called the QT interval. It reflects the so-called electrical systole of the ventricles. From it a doctor can judge the duration of the phase of excitation, contraction, and repolarization of the ventricles.
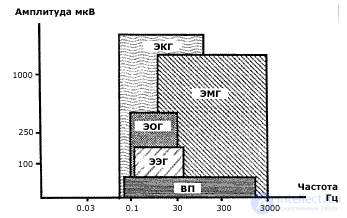
Amplitude-frequency relationships of bioelectric signals (EEG, EMG, EOG, ECG) (according to V.V. Gnezditsky, 1997)
In psychophysiology, the ECG is mainly used to measure the rate of ventricular contraction. A cardiotachometer is used for this purpose. The heart rhythm recorded with a cardiotachometer, as a rule, corresponds to the pulse rate, i.e., the number of pressure waves propagating along the peripheral arteries per minute. In some cases, however, these values do not coincide.
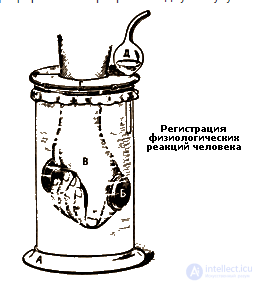
The study of the neurohumoral regulation of heart rhythm is one of the most widespread approaches to assessing the state of a person's adaptive capabilities. Recordings of the ECG or cardiointervalogram (CIG) are widely used to study autonomic tone. The most common method is processing cardiointervals using histographic analysis: the mode of the distribution, its amplitude, and the variation range are calculated, and based on these parameters an integral indicator — the stress index (SI) — was calculated. The stress index is proportional to the mean heart rate and inversely proportional to the range within which the interval between two heartbeats varies.
Since the early 1960s, various spectral methods of RR-interval analysis have begun to be used.
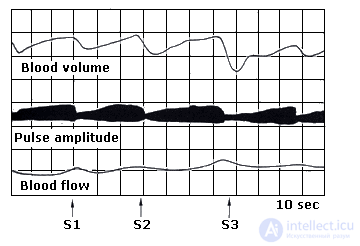
Plethysmography — a method for recording the body's vascular reactions. Plethysmography reflects changes in the volume of a limb or organ caused by changes in the amount of blood contained in them. A person's limb in an insulating glove is placed inside a vessel with liquid, which is connected to a manometer and a recording device. Changes in blood and lymph pressure in the limb are reflected in the form of a curve called a plethysmogram. Finger photoplethysmographs, portable devices that can also be used to record heart rhythm, have become widespread.
Two types of changes can be distinguished in the plethysmogram: phasic and tonic.
Phasic changes are caused by the dynamics of pulse volume from one heartbeat to another.
Tonic changes in blood flow are actually changes in the volume of blood in the limb. Both indicators show shifts under the action of psychological stimuli, indicating vasoconstriction.
The plethysmogram is a highly sensitive indicator of autonomic shifts in the body.
The muscular system is figuratively defined as a person's biological key to the outside world.
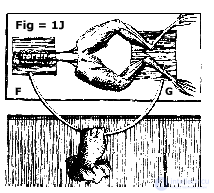
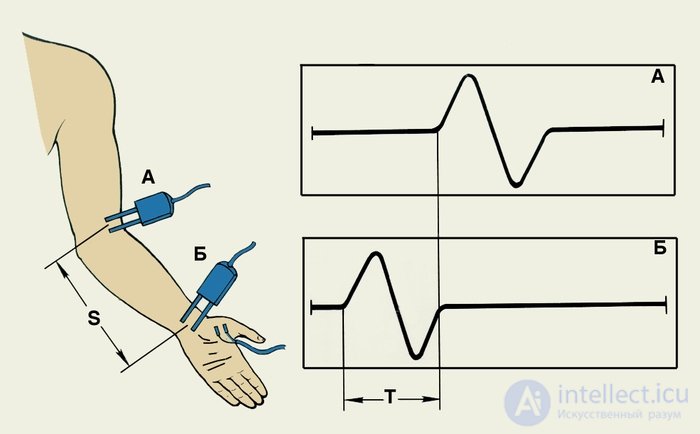
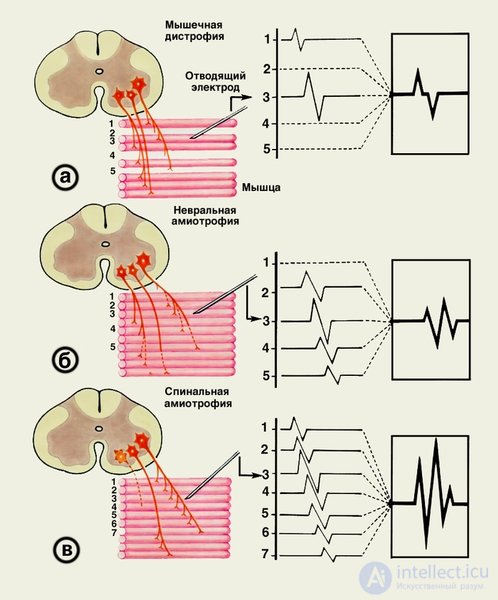
Electromyography — a method for studying the functional state of the organs of movement by recording the bioelectric potentials of muscles. Electromyography is the recording of electrical processes in muscles, in fact a record of the action potentials of muscle fibers that make it contract. A muscle is a mass of tissue consisting of many individual muscle fibers joined together and working in a coordinated way. Each muscle fiber is a thin thread, only about 0.1 mm thick and up to 300 mm long. When stimulated by an action potential arriving at the fiber from a motor neuron, this fiber contracts, sometimes to about half its original length. Muscles involved in fine motor corrections (fixating an object with the eyes) may have only about 10 fibers in each unit. In muscles carrying out coarser regulation while maintaining posture, one motor unit may have up to 3000 muscle fibers.
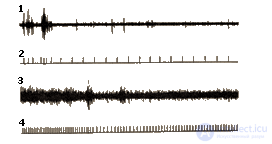
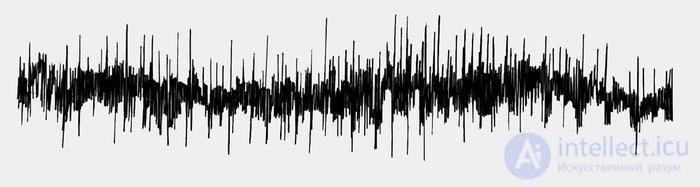
The surface electromyogram (EMG) reflects, in aggregate, the discharges of motor units causing contraction. EMG recording makes it possible to detect the intention to begin movement several seconds before it actually begins. In addition, the myogram serves as an indicator of muscle tension. In a state of relative rest, the relationship between the actual force developed by the muscle and the EMG is linear.
The device used to record the bioelectric potentials of muscles is called an electromyograph, and the recording made with it is called an electromyogram (EMG). EMG, unlike the bioelectric activity of the brain (EEG), consists of high-frequency discharges of muscle fibers, for the undistorted recording of which, according to some views, a bandwidth of up to 10,000 Hz is required.
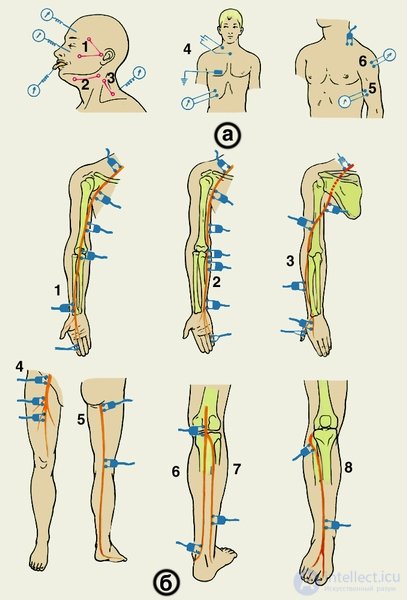
The methods of electromyography often include the so-called «global EMG», recorded with surface pick-up electrodes placed on the patient's muscles. However, its use often leads to incorrect diagnoses, due to the influence on the results of such a study of a large number of subjective factors:
The respiratory system consists of the airways and the lungs.
The main motor apparatus of this system is made up of the intercostal muscles, the diaphragm, and the abdominal muscles. Air entering the lungs during inhalation supplies oxygen to the blood flowing through the pulmonary capillaries. At the same time, carbon dioxide and other harmful metabolic products leave the blood and are removed to the outside during exhalation. There is a simple linear relationship between the intensity of muscular work performed by a person and oxygen consumption.
In psychophysiological experiments, breathing is currently recorded relatively rarely, mainly in order to control for artifacts.
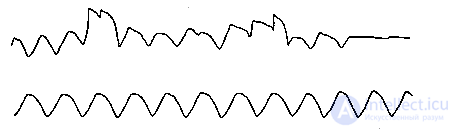
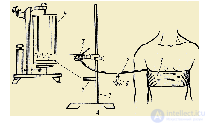
A special instrument — a pneumograph — is used to measure the intensity (amplitude and frequency) of breathing. It consists of an inflatable belt-chamber, tightly wrapped around the subject's chest, and a pick-up tube connected to a manometer and a recording device. Other methods of recording respiratory movements are also possible, but in any case tension sensors that record changes in chest volume must be present.
This method provides a good recording of changes in the frequency and amplitude of breathing. From such a recording it is easy to analyze the number of breaths per minute, as well as the amplitude of respiratory movements under different conditions. It can be said that breathing is one of the insufficiently appreciated factors in psychophysiological research.
The most common methods for studying external respiration:
Pneumography
Spirometry
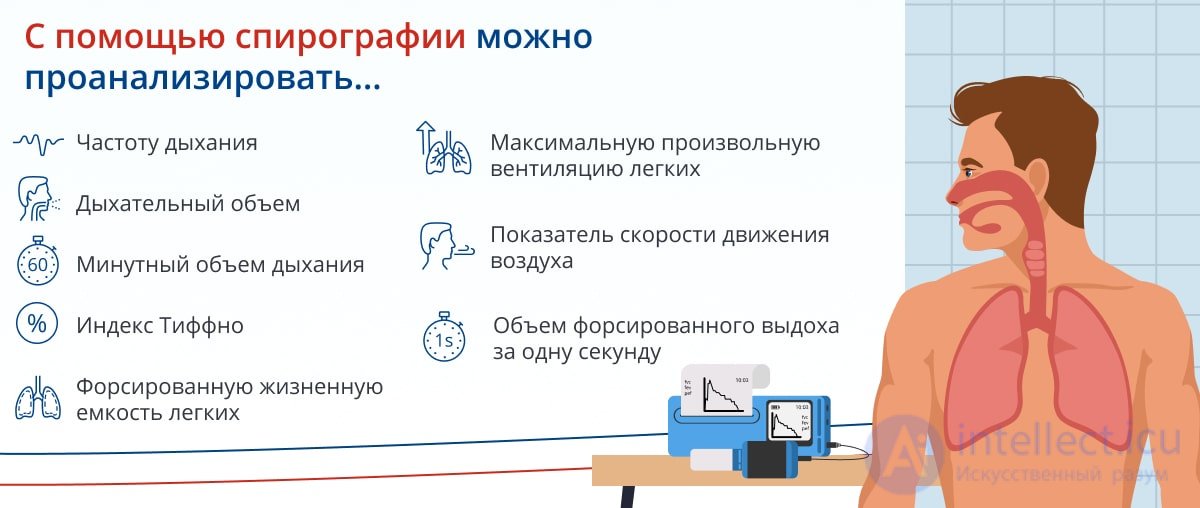
Spirography
Pneumotachometry
Radiography
X-ray computed tomography
Ultrasound examination
Magnetic resonance imaging
Bronchography
Bronchoscopy
Radionuclide methods
Gas dilution method
Pneumography. A special instrument — a pneumograph — is used to measure the intensity (amplitude and frequency) of breathing. It consists of an inflatable belt-chamber, tightly wrapped around the subject's chest, and a pick-up tube connected to a manometer and a recording device. Other methods of recording respiratory movements are also possible, but in any case tension sensors that record changes in chest volume must be present.
Pneumotachometry — a method for studying the mechanics of breathing, based on recording the velocities of movement and the volume of inhaled and exhaled air. All respiration sensors in polygraphs operate on the principle of a change in chest volume. Inhalation is carried out by a person through contraction of the external intercostal muscles, as well as through a change in the position of the diaphragm. For this purpose, two sensors are installed to record thoracic (upper) and diaphragmatic (lower) breathing. These two types of breathing are closely related to each other. During exhalation, the diaphragm, moving down, presses on the abdominal organs, shifting them somewhat downward and forward. Therefore, some bulging of the abdomen occurs during exhalation, which is easily recorded by the respiration sensor. During normal quiet breathing, the lower 2/3 of the lung is stretched on inhalation. The respiratory rate at rest is 12—14 breaths per minute, with about 0.4—0.6 l of air being inhaled and exhaled.
In a stressful situation, pulmonary ventilation can increase to 1.5—2 l with an unchanged frequency. In special cases, the respiratory rate is 25—40 breaths per minute. The recording obtained in this case is called a pneumotachogram. The simplest pneumotachographs consist of a converter of air flow into an electrical signal and a recorder. They are used to determine the volumetric velocity of air movement during quiet and forced breathing, respiratory rate, and the duration of inhalation and exhalation.
Spirography. A spirometer is used to record the volumes of air entering the lungs during inhalation and leaving them during exhalation. It can be said that breathing is one of the insufficiently appreciated factors in psychophysiological research. Recording of respiratory indicators is mainly used to control for artifacts.
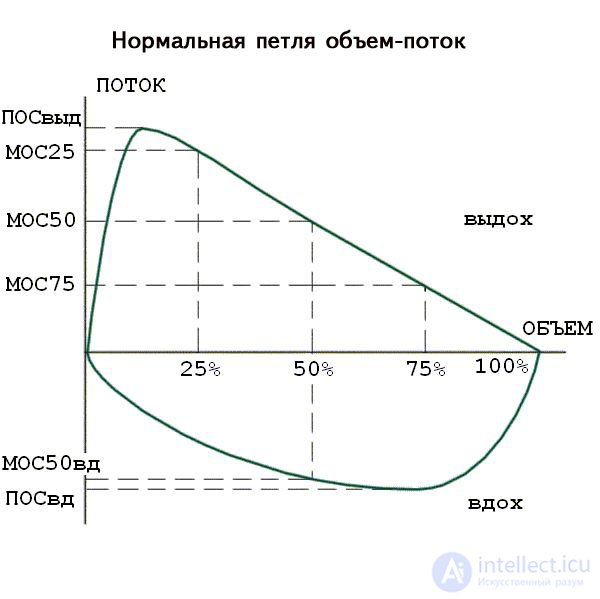
Flow-volume loop
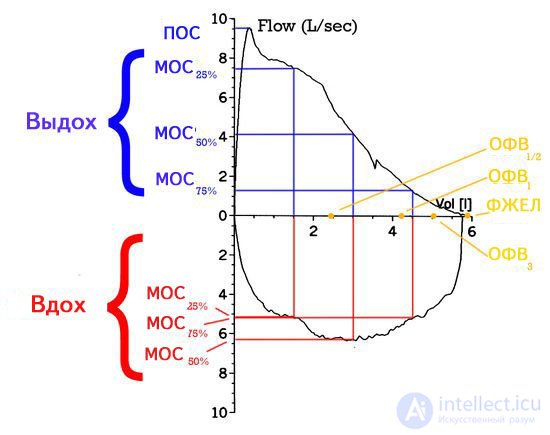
The analysis of the volume-flow loop of maximal forced expiration and inspiration has important diagnostic value. This loop is formed by plotting flow rate on the vertical axis and lung volume on the horizontal axis. This loop is plotted automatically by modern electronic spirometers. The main indicators of the spirogram are identified on this loop.
Based on the shape of the loop and the changes in its indicators, one can distinguish normal function and the main types of respiratory failure: obstructive, restrictive, and mixed.
Normal spirogram.
In a healthy person, the conclusion of a respiratory function study usually states that there are no disorders. The table gives a list of indicators of respiratory system function and their normal values. Most of the values of the indicators are expressed as a % ratio to so-called "predicted" values. These are values characteristic of a healthy person of a given sex, age, weight, and height. Conditionally, these can be considered "normal" values
The normal expiratory flow-volume loop has a rapid peak of maximal expiratory flow (PEF) and a gradual decline of flow to zero, with a linear section on it — MEF50exp. The inspiratory loop on the negative part of the flow axis is fairly deep, convex, and usually symmetrical. MEF50insp > MEF50exp.
Normally, FEV1, FVC, FEV1/FVC exceed 80% of the predicted values. If these values are less than 70% of predicted — this is a sign of pathology.
The range from 80% to 70% of predicted is interpreted individually. In older age groups such values may still be normal, while in young and middle-aged people they may indicate early signs of obstruction. In such cases the examination should be deepened, and a test with beta2-adrenoreceptor agonists performed.
For the psychophysiologist, the three categories of eye reactions of greatest interest are: pupil constriction and dilation, blinking, and eye movements.
Pupillometry — a method for studying pupillary reactions. The pupil is the opening in the iris through which light reaches the retina. The diameter of the human pupil can vary from 1.5 to 9 mm. Pupil size fluctuates substantially depending on the amount of light falling on the eye: in light the pupil constricts, in darkness it dilates. Along with this, pupil size changes substantially if the subject reacts emotionally to a stimulus. Because of this, pupillometry is used to study people's subjective attitude toward particular external stimuli.
The pupil diameter can be measured by simply photographing the eye during the examination, or with the help of special devices that convert pupil size into a continuously varying potential level, recorded on a polygraph.
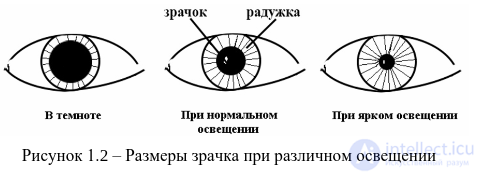
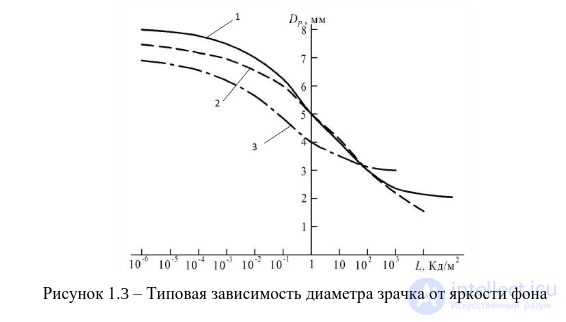
There are quite a few diagnostic parameters of pupillograms — on the order of 50, however the most informative of them are 10-14 parameters. In pupillometric diagnostics, the dynamics of changes in pupil size over time is represented as a pupillogram – a time series characterized by various parameters, as shown in figure 1.5
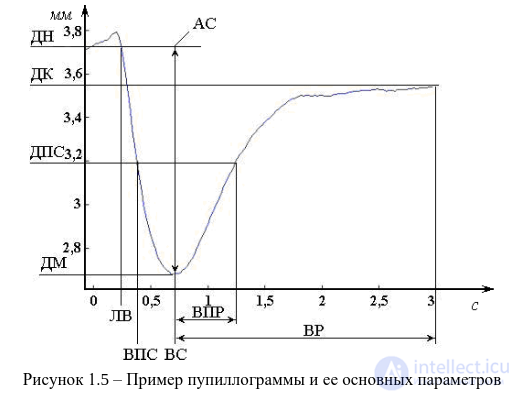
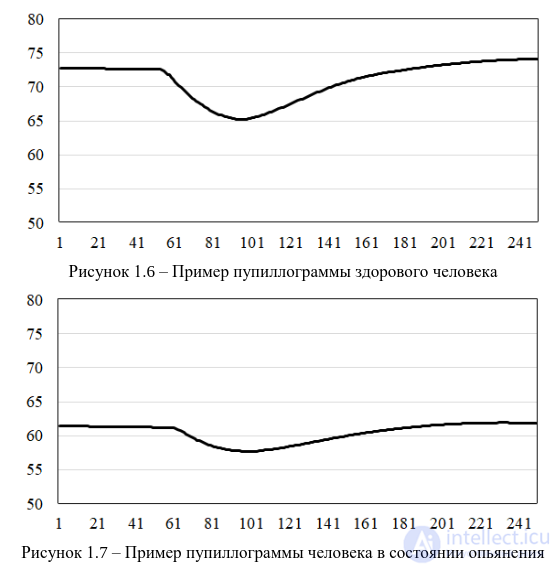
The figure shows an example of the pupillogram of a healthy person and the main (basic) pupillographic parameters of a person's pupillary response to a change in illumination: DN –initial diameter, DM –minimum diameter, DHC –half-constriction diameter, DK –final diameter, AC –constriction amplitude, LT –latent reaction time, CT –constriction time, DT –dilation time, HCT –half-constriction time, HDT –half-dilation time. In addition, it is customary to use the following additional parameters: constriction velocity (CV) and dilation velocity (DV), which are calculated from the values of the basic parameters. Thus, each set of values of the basic and additional parameters can be matched to a functional state of the person, characterizing the state of their organism as a whole.
Blinking (eye blink) — periodic closure of the eyelids. The duration of a single blink is approximately 0.35 s. The average blink rate is 7.5 per minute and can vary from 1 to 46 per minute. Blinking performs various functions in supporting the vital activity of the eyes. However, what matters for the psychophysiologist is that the blink rate changes depending on a person's mental state.
Eye movement is widely studied in psychology and psychophysiology. These are rotations of the eyes in their orbits, diverse in function, mechanism, and biomechanics. There are different types of eye movements performing different functions. However, the most important function of eye movements among them is to keep the image of interest to the person at the center of the retina, where visual acuity is highest. The minimum velocity of pursuit movements is about 5 arc min/s, the maximum reaches 40 deg/s.
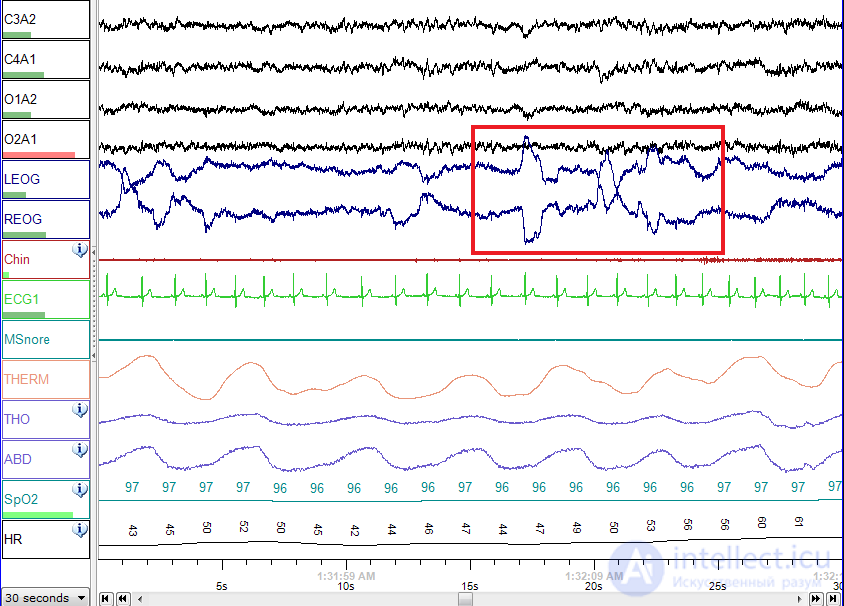
Electrooculography — a method for recording eye movement, based on the graphic recording of changes in the electrical potential of the retina and eye muscles. In a person, the front pole of the eye is electrically positive, and the back is negative, so there is a potential difference between the fundus of the eye and the cornea, which can be measured. When the eye turns, the position of the poles changes, and the resulting potential difference characterizes the direction, amplitude, and velocity of the eye movement. This change, recorded graphically, is called an electrooculogram. However, microscopic eye movements are not recorded with this method; other techniques have been developed to record them.
The electrooculogram is a curve reflecting the result of the measurements.

Comments