
Lecture
- Modern technologies and increased automation of workplaces increase the functional load on the operator in any field of activity. Interaction with the computer is becoming an integral part of the work.
- Poorly designed interfaces are a source of stress and psychological discomfort in the "human-machine-environment" interaction domain.
- The main problems in assessing the quality of the user interface are the subjectivity of the assessment, its narrow focus, and the difficulty of automation.
- When determining the quality of the UI, qualitative and quantitative methods of analysis are used. Qualitative methods are not objective assessments, while quantitative methods give more objective results but require the qualification of the person applying them. There is no ideal method for determining the quality of the software under study.
|
No. |
Standard |
Title |
|
1 |
ISO 9241-1:1997/Amd.l:2001 |
Ergonomic requirements for office work with visual display terminals (VDTs). Part 1. General introduction. Amendment 1 |
|
2 |
ISO 9241-2:1992 |
Ergonomic requirements for office work with visual display terminals (VDTs). Part 2. Guidance on task requirements |
|
3 |
ISO 9241-12:1998 |
Ergonomic requirements for office work with visual display terminals (VDTs). Part 12. Presentation of information |
|
4 |
ISO 9241-14:1997 |
Ergonomic requirements for office work with visual display terminals (VDTs). Part 14. Menu dialogues |
|
5 |
ISO 9241-15:1997 |
Ergonomic requirements for office work with visual display terminals (VDTs). Part 15. Command dialogues |
|
6 |
ISO 9241-16:1999 |
Ergonomic requirements for office work with visual display terminals (VDTs). Part 16. Direct manipulation dialogues |
|
No. |
Standard |
|
|
18 |
ISO/IEC 11581-3:2000 |
Information technology. User system interfaces |
|
|
|
and symbols. Icon symbols and functions |
|
|
|
Part 3. Pointer icons |
|
19 |
ISO/IEC 11581-1:2000 |
Information technology. User system interfaces |
|
|
|
and symbols. Icon symbols and functions |
|
|
|
Part 1. Icons. General provisions |
|
20 |
ISO/IEC 11581-2:2000 |
Information technology. User system interfaces |
|
|
|
and symbols. Icon symbols and functions |
|
|
|
Part 2. Object icons |
|
21 |
ISO 11064-1:2000 |
Ergonomic design of control centres. |
|
|
|
Part I. Principles for the design of control centres |
|
22 |
ISO/IEC 11581-5:2004 |
Information technology. User system interfaces |
|
|
|
and symbols. Icon symbols and functions |
|
|
|
Part 5. Tool icons |
|
23 |
ISO/IEC 11581-6:1999 |
Information technology. User system interfaces |
|
|
|
and symbols. Icon symbols and functions |
|
|
|
Part 6. Action icons |
|
24 |
ISO/IEC 11581-10:2010 |
Information technology. User system interfaces |
|
|
|
and symbols. Icon symbols and functions |
|
|
|
Part 10. Framework and general guidance |
|
25 |
ISO/IEC 11581-40:2011 |
Information technology. Interface symbols |
|
|
|
of the user. Part 10. Icon registration management |
|
26 |
ISO 14915-1:2002 |
Ergonomics of software for multi- |
|
|
|
media user interface. Part 1. |
|
No. |
Standard |
Title |
|
1 |
ISO 9241-1:1997/ |
Ergonomic requirements for office work with visual display terminals (VDTs). Part 1. General introduction. Amendment 1 |
|
2 |
ISO 9241-2:1992 |
Ergonomic requirements for office work with visual display terminals (VDTs). Part 2. Guidance on task requirements |
|
3 |
ISO 9241-12:1998 |
Ergonomic requirements for office work with visual display terminals (VDTs). Part 12. Presentation of information |
|
4 |
ISO 9241-14:1997 |
Ergonomic requirements for office work with visual display terminals (VDTs). Part 14. Menu dialogues |
|
5 |
ISO 9241-15:1997 |
Ergonomic requirements for office work with visual display terminals (VDTs). Part 15. Command dialogues |
|
6 |
ISO 9241-16:1999 |
Ergonomic requirements for office work with visual display terminals (VDTs). Part 16. Direct manip |
|
7 |
ISO 9241-17:1998 |
Ergonomic requirements for office work with visual display terminals (VDTs). Part 17. Ergonomic requirements for liquid-crystal display screens |
|
8 |
ISO 9241-143:2012 |
Ergonomics of human-system interaction. Part 143. Forms of information presentation |
|
9 |
ISO 9241-151:2008 |
Ergonomics of human-system interaction. Part 151. Guidance on software accessibility |
|
10 |
ISO 9241-100:2010 |
Ergonomics of human-system interaction. Part 100. |
- In addition to international standards, many countries and industries develop their own national standards.
- In the USA, the publisher of national standards is the American National Standards Institute (ANSI); in Russia, it is the Federal Agency for Technical Regulation.
- Human-machine interaction (HMI) issues are regulated by military agencies, national aviation committees, and oversight bodies in the field of nuclear and other hazardous technologies.
- In Russia, there is practically no legislative regulation of the design, development, and assessment of the UI.
- A well-designed UI should ensure maximum operator comfort and not lead to a decrease in the level of psychophysical and psychological characteristics.
- When assessing UI quality, the following parameters are considered: task execution time, duration of information perception, processing and decision-making by the operator, duration of operator actions, and duration of reaction.
- By the location of the error in the structure of the human-machine system (HMS) functioning.
- By the human systems that bear the main load when performing the operation.
- By behavioral errors.
- By causes of errors.
- By consequences of errors.
- By the nature of the violation of correct functioning.
- By means of detecting errors and means of correction.
The quality of the user interface (UI) depends on many factors that may or may not be interrelated. To determine the most complete list of UI quality indicators and criteria, it is necessary to understand what a UI is for developers and users, and also to define the concept of "effective UI".
There are three groups of indicators that affect UI quality: visual design parameters, functional capability parameters, and parameters describing the quality of user interaction with the UI. However, the last group of parameters is practically not used for a comprehensive assessment of UI quality due to difficulties in obtaining source data.
Indicators and criteria of user interface quality include:
1) Visual design parameters, such as information perception, ergonomics, visual appeal, and others.
2) Functional capability parameters, such as efficiency, reliability, speed, accuracy, and others.
3) Parameters describing the quality of user interaction with the UI, such as ease of use, the operator's level of satisfaction, the possibility of natural information input, ensuring easy control of the system, operator control over the system, the ability to correct input errors, feedback and help, clarity of the output information, matching the volume of information to the operator's working memory, dialogue, and choice of mode of use.
An image of the property hierarchy of the "Primary graphical information" and "Additional information" components was not provided, so I cannot present them.
Below I provide a description of each of the three groups of indicators affecting the quality of the user interface (UI):
Visual design parameters:
Color scheme: the combination and harmony of the colors used;
Contrast: the difference in brightness between text and background;
Text size and font: text readability depending on size and font;
Use of images and graphic elements: effective use of images and graphic elements to improve the visual design;
Style and design: overall style and design corresponding to the target audience and tasks.
Functional capability parameters:
Functionality: correspondence of functional capabilities to the requirements and expectations of users;
Efficiency: speed and ease of task completion;
Reliability: stable system operation without errors and failures;
Usability: simplicity and intuitiveness of the user interface;
Compatibility: compatibility with other systems and devices.
Parameters of the quality of user interaction with the UI:
Interaction capabilities: the variety of ways a user can interact with the system (e.g., mouse, keyboard, voice control);
Responsiveness: the speed of the system's reaction to user actions;
Feedback: information provided to the user about the state of the system and the results of actions performed;
Transparency: the clarity and availability of information about the system's operating process;
User satisfaction: the user's overall impression of interacting with the system and satisfaction with the result obtained.
A well-designed user interface should take into account all three groups of parameters and comply with domestic and foreign standards in order to ensure the best quality of user interaction with the system.
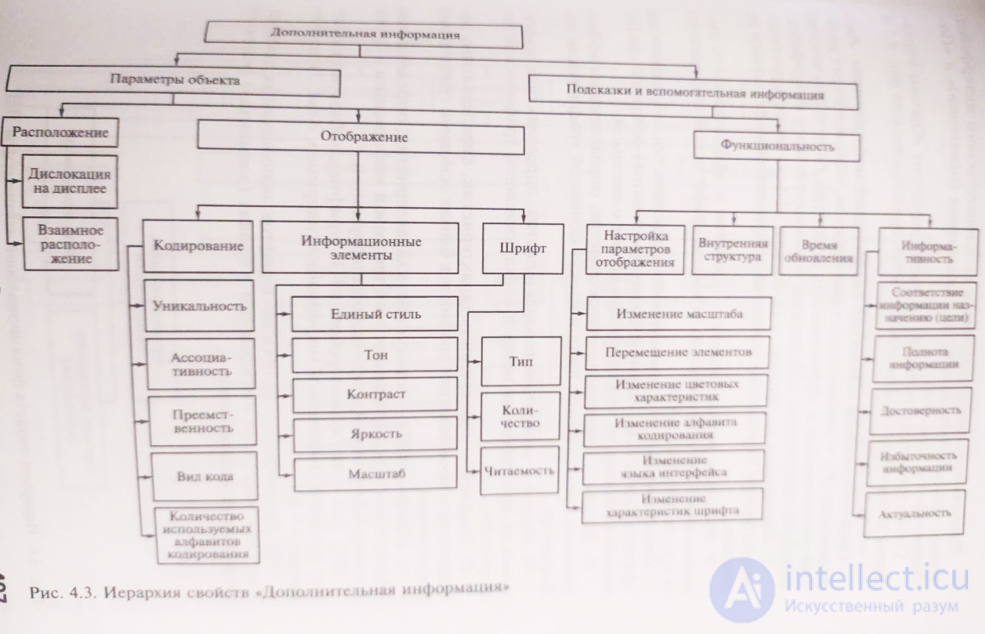
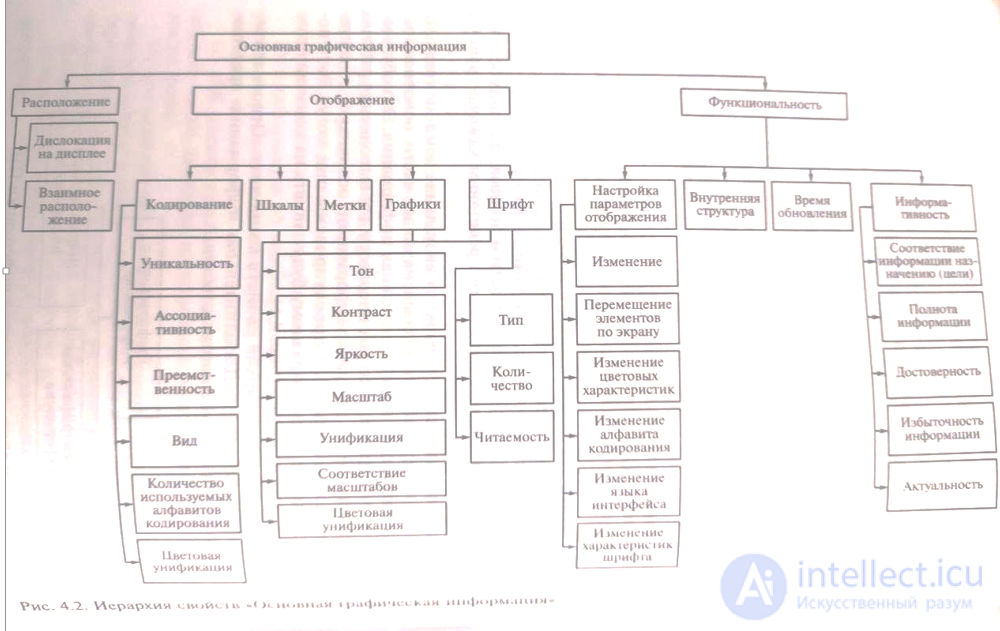
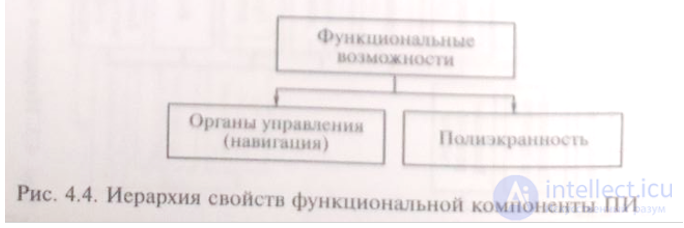
The functional capabilities of the user interface can be divided into «Controls (navigation)» and «Screen elements» (Fig. 4.4). The corresponding property hierarchies of the «Controls (navigation)» and «Screen elements» components are shown in Fig. 4.5 and 4.6, respectively.
Description of screen element properties:
- Placement on the display — the convenience and effectiveness of the arrangement of blocks (elements) of primary graphical information on the screen.
- Mutual arrangement — the convenience and effectiveness of the arrangement of blocks (elements) of primary graphical information relative to one another.
- Display — a set of characteristics that determine the effectiveness of presenting blocks (elements) of primary graphical information to the operator while working with the system.
- Scales — a set of characteristics that determine the effectiveness of presenting scales in blocks of primary graphical information.
- Labels — a set of characteristics that determine the effectiveness of presenting labels in blocks of primary graphical information.
- Graphs — a set of characteristics that determine the effectiveness of presenting graphs in blocks of primary graphical information.
- Font (PGI) — a set of characteristics that determine the effectiveness of presenting all textual information in blocks (elements) of primary graphical information.
- Type (PGI) — the type of font used in the user interface for blocks (elements) of primary graphical information (e.g., Arial, Times New Roman, etc.).
- Quantity (PGI) — the number of fonts used to present textual information in blocks (elements) of primary graphical information.
Coding. Alphabet — the effectiveness of the chosen information coding alphabet in blocks (elements) of the primary graphical information of the user interface.
Coding. Structure — the effectiveness of the information coding structure in blocks (elements) of primary graphical information, including the arrangement order of code elements, their size, and shape.
Coding. Comparability — the effectiveness of matching coded symbols and the information they represent, for the user interface operator.
Coding. Stability — the effectiveness of preserving the information coding in blocks (elements) of primary graphical information over a long period of time without changes or errors.
Coding. Fault tolerance — the effectiveness of preserving the user interface's functionality when errors or changes occur in the information coding in blocks (elements) of primary graphical information.
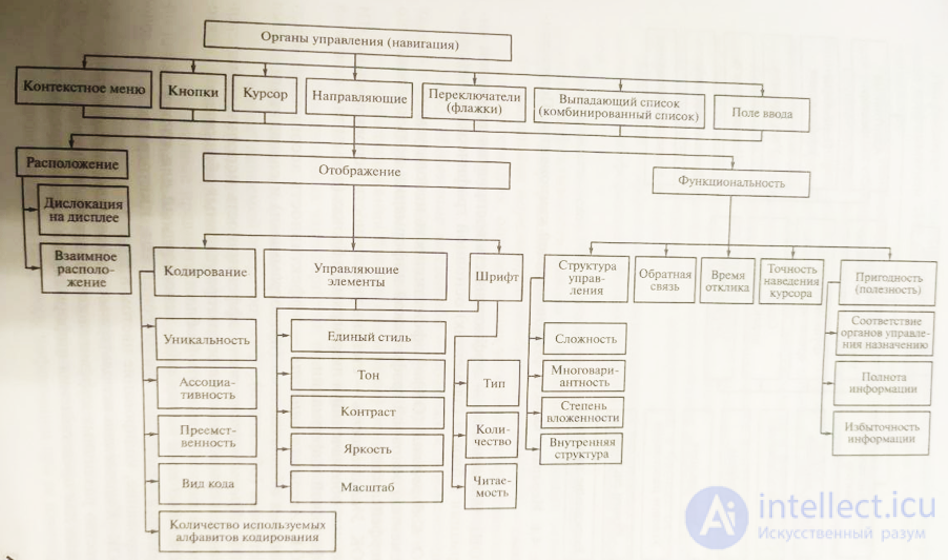
Information elements can be designed with various notations that rule out the possibility of confusion and can be rendered in any language. Color unification should be applied to elements of the same type.
Different notations use different element sizes in the blocks of primary graphical information. The correspondence between element size and the significance of the information should be clear to the operator.
Contrast and tone are used to present information in blocks of primary graphical information. Brightness of the colors should be used effectively to improve the readability of the information.
The scale of information elements should be chosen effectively in blocks of primary graphical information. Functionality (F) includes characteristics that determine the effectiveness of outputting information to the operator in blocks of primary graphical information.
The functionality of display-parameter configuration (FDPC) must satisfy the requirements for convenience and effectiveness of the operator's configuration of the display parameters of the primary graphical information.
FDPC includes the ability to change the scale of elements of blocks of primary graphical information, move elements around the screen, and change color characteristics to suit the operator's personal preferences.
FDPC also allows changing the interface language, adjusting the font characteristics of the presented textual information to the operator's personal preferences, and changing the alphabetic structure of the information provided to the operator.
The internal structure of blocks of primary graphical information must be clearly defined and logically organized. The update time of the presented information must be minimal to ensure operational efficiency.
Font (F). Readability — the effectiveness of perceiving textual information in blocks of additional information.
Coding (C) — the effectiveness of the coding used in the blocks of additional information of the user interface.
C. Uniqueness — the degree of uniqueness of the symbols and pictograms used in the UI.
C. Associativity — the effectiveness of the associations between symbols (pictograms) and the actions (objects) associated with them.
C. Continuity — the effectiveness of using pictograms (symbols) that are standard and familiar to the operator in the given subject area.
C. Code type — the type of code used to encode additional information (e.g., graphical code, pictograms, numeric coding, color coding, etc.).
C. Number of coding alphabets used — the number of different information-coding alphabets used to present additional information in the given subject area.
Unified style — the presence of a unified design style for elements of the same type in the blocks of additional information of the UI.
Tone — the effectiveness of perceiving the combination of color tones used to present blocks of additional information.
Contrast — the effectiveness of using contrast in the combination of color tones used to present blocks of additional information.
Brightness — the effectiveness of using color brightness for presenting blocks of additional information.
Scale — the effectiveness of using the chosen element sizes in the blocks of additional information of the UI.
Functionality (F) — a set of characteristics that determine the effectiveness of presenting additional information to the operator.
F. Configuration of display parameters (FDPC) — a set of characteristics that determine the convenience and effectiveness of the operator's configuration of the display parameters of additional information.
FDPC. Scale change — the ability to change the size of elements of blocks of additional information and change their placement on the screen.
FDPC. Movement across the screen — the ability to change the placement of blocks of additional
F. Informativeness (FI) - a set of characteristics that determine the effectiveness of presenting additional information.
FI. Information-to-purpose correspondence ratio (IPR) - the ratio of the amount of primary information provided to the operator when performing a work task to the amount of primary information needed to perform the task.
FI. Information completeness ratio — the ratio of the total information perceived by the user while working with the system to the information needed to perform work tasks.
FI. Reliability — the accuracy of the presented information.
FI. Relevance — the degree to which the information corresponds to the current point in time.
FI. Information redundancy ratio — the ratio of the total amount of primary information provided to the amount of primary information that must be used by the operator to perform the work task.
Description of the properties of «Additional information». Object parameters — a set of characteristics that determine the quality of presenting additional information about an object.
Hints and auxiliary information — a set of characteristics that determine the quality of presenting hints and auxiliary information.
Placement (P) — a set of characteristics that determine the convenience of placement and the effectiveness of the structure of blocks of additional information.
P. Placement on the display — the convenience and effectiveness of the placement of additional information on the display.
P. Mutual arrangement — the convenience and effectiveness of the arrangement of blocks of additional information relative to one another.
Display (D) — a set of characteristics that determine the effectiveness of presenting blocks of additional information to the operator while working with the system.
D. Information elements (DIE) — a set of characteristics that determine the effectiveness of presenting information elements in blocks of additional information.
D. Font (DF) - a set of characteristics that determine the effectiveness of presenting all textual additional information.
DF. Readability - the effectiveness of perceiving textual information in blocks of additional information.
C. Coding (C) - the effectiveness of the user interface used in blocks of additional information.
C. Uniqueness - the degree of uniqueness of the symbols and pictograms used in the UI.
C. Associativity - the effectiveness of the associations between symbols (pictograms) and the actions (objects) associated with them.
C. Continuity - the effectiveness of using pictograms (symbols) that are standard and familiar to the operator in the given subject area.
C. Code type - the type of code used to encode additional information (e.g., graphical code, pictograms, numeric coding, color coding, etc.).
C. Number of coding alphabets used - the number of different information-coding alphabets used to present additional information in the given subject area.
Unified style - the presence of a unified design style for elements of the same type in the blocks of additional information of the UI.
Checkboxes (or check boxes (from the English "check box" - tick mark)) - an element of the graphical user interface that allows the user to control a parameter with two states: "on" and "off". When on, a mark (a tick or a cross) appears inside the check box.
Drop-down list - a UI element representing an expandable menu that allows one of several actions or values to be selected.
Combo box - a UI element that combines a drop-down list and a single-line text field, allowing the user to enter a value manually or select it from the list.
Input field - a UI element intended for entering textual or numeric information.
Placement (P) - a set of characteristics that determine the convenience of placement and the effectiveness of the structure of functional blocks (elements) of the user interface.
Placement on the display - the convenience and effectiveness of the placement of controls on the display.
Mutual arrangement - the convenience and effectiveness of the arrangement of controls relative to one another.
Display (D) - a set of characteristics that determine the effectiveness of presenting control blocks (elements) to the operator while working with the HMS.
Control elements (DCE) - a set of characteristics that determine the effectiveness of presenting control elements such as buttons, lists, input fields, checkboxes, etc.
Font (DF) - a set of characteristics that determine the effectiveness of presenting textual information on controls.
Type - the type of font used in the UI for controls, e.g., Arial, Times New Roman, etc.
Quantity - the number of fonts used to present textual information on controls.
Readability - the effectiveness of perceiving textual information on controls.
Coding (C) - the effectiveness of the code C used in the UI.
Uniqueness - the degree of uniqueness of the symbols and pictograms used in the UI.
Associativity - the effectiveness of the association between pictograms (symbols) and the actions (objects) associated with them.
Continuity - the effectiveness of using pictograms and values that are standard and familiar to the operator in the given subject area.
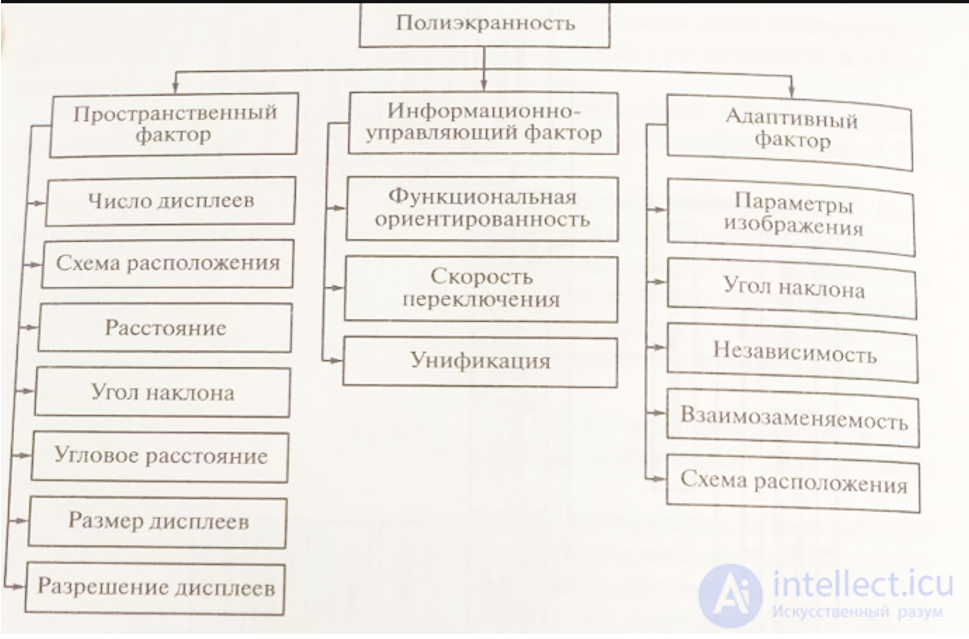
Adaptive factor (AF) - a set of the operator's capabilities to adjust displays, including graphical settings and other options.
AF. Independence - the ability to configure the parameters of each AF, e.g., brightness, contrast, scale, etc.
AF. The ability to configure graphical parameters, e.g., brightness, contrast, scale, etc.
AF. The ability to adjust the tilt angle of the displays.
PAF. Interchangeability - the ability to exchange images between displays, e.g., with two displays the operator may be able to output image A to the first display and image B to the second, or vice versa.
AF. Layout scheme - the ability to change the layout scheme of the displays according to the operator's personal preferences.
Using these qualities, by applying the analytic hierarchy process, it is possible to determine the importance of each criterion for any user interface.
1) Analytical, allowing the operator's performance of a given task to be modeled and analyzed, and, based on the data obtained, an assessment of the quality of the user interface to be made.
2) Experimental, aimed at obtaining qualitative and quantitative assessments of the operator's performance of professional tasks using the UI. Experimental methods, in turn, are divided into laboratory and field methods. Laboratory methods are conducted on simulators (trainers) in laboratories, while field methods are conducted under real conditions at real workplaces, which improves the quality of the results obtained.
3) Surveys, which allow a qualitative assessment of operators' (users') attitude toward the UI and (or) its individual components, and also help identify the main problems when working with the UI. Expert assessments consist of experts examining the UI and finding strengths and weaknesses that need to be eliminated later.
- Analytical methods - quantitative methods for obtaining a large volume of data for analysis.
- Main methods: task analysis, the FITS and Hick's law method, checklist analysis.
- When analyzing work tasks by the UI analysis method, it is examined which moments are performed, and a conclusion is drawn about the satisfaction of needs and the effectiveness of the UI.
- Studying work tasks provides information about goals, action algorithms, errors, and exceptional situations.
- The GOMS method allows estimating the time cost of user actions.
- Task analysis is effective at the design or re-engineering stage of the UI.
- Command line editing rules: place all K and R operators before M, remove unnecessary M's, remove M's within cognitive units.
GOMS - a method for estimating the time required to perform tasks related to human-computer interaction, includes GOMS-Keystroke, GOMS-Analyse, GOMS-Multitasking, and GOMS-Template. However, it does not take all factors into account, so it should be used in combination with other methods.
Fitts's law establishes a formula for estimating the time to move the cursor to an object depending on the distance and the size of the object. The constants a and b depend on parameters of human performance, and the law is applicable only in the case of a linear relationship between the manipulator and the cursor and continuous movement.
Hick's law establishes a formula for estimating the time to choose one of several alternatives depending on their number; the proportionality coefficients depend on many factors. Presenting the operator with several alternatives at once is usually more effective than organizing them into hierarchical groups.
Checklist analysis is a simple and effective method for assessing the quality of user interfaces. It consists of checking the interface's compliance with predetermined properties and criteria from a control list. Attention-zone analysis makes it possible to determine which visual elements attracted a person's attention. The disadvantage of these methods is their narrow focus and subjectivity, but their advantages are obtaining information about the operator's actions and quickly obtaining results.
Usability testing is a set of techniques that allow measuring the level of convenience and quality of working with a product and effectively investigating which problems users solve when performing specific tasks. To conduct such testing, the user interface must be complete and consistent. It can be carried out both at late design stages and during the re-engineering of an existing system.
Aspects of the user interface for which usability testing is particularly effective include the actual time to complete work tasks, the number of errors, the adequacy of domain abbreviations and terms, the ease of training new operators, and the effectiveness of the help system. Conducting an experiment with real users requires a large investment of mental effort, time, and money, and can be carried out either in laboratory or in real conditions. If there is enough time and resources, however, it is preferable to give priority to more formal testing.
Test tasks for experiment participants are developed based on real tasks or mock-up screens.
It is necessary to determine which auxiliary tools you need and, if necessary, acquire them.
Compile a user list to select respondents for each experiment and to create a model of a typical product user.
Think through how the data obtained during the experiment will be processed and analyzed.
UI assessment should be carried out before coding begins, or early enough that there is still time to change the implementation.
Intermediate testing is carried out at various stages of design.
Surveys, which originated in psychology, sociology, and marketing, can be used to assess the quality of the user interface. This method requires careful preparation and can be conducted individually or with groups of respondents, in person or remotely. Questionnaires may have open, closed, or semi-closed questions, and combining them increases the validity and completeness of the information.
- Expert evaluation is the cheapest, fastest, and most effective method of assessing the user interface.
- About 75% of user interface quality can be obtained through expert evaluations.
- To improve the user interface, the following principles should be taken into account:
1. Visibility of system status.
2. Match between the system and the real world.
3. User freedom of action.
4. Consistency and standards.
5. Error prevention.
6. Do not overload the user's memory.
7. Flexibility and efficiency of use.
8. Aesthetic and minimalist design.
9. Helping users recognize, diagnose, and correct errors.
Staged development of the UI increases software efficiency, reduces training time and rework costs, and makes full use of functionality. Interface design is a demanding task within ergonomics, covering a wide range of devices. The division into traditional ergonomics and usability is conditional, since the objects of study of both fields coincide.
A review of standards and guidelines allows the currently established HMI design procedure to be formulated [6, 8, 9, 19, 20, 34...38, 41, 44, 51, 54]. It includes the following sequentially implemented stages:
1)analysis and formulation of requirements;
2)preliminary and detailed design;
3)construction and implementation;
4)verification (testing) and validation (approval).
The most critical stage, capable of significantly affecting the effectiveness of the future interface, is the analysis stage, which includes functional analysis of the HMI, analysis of user stereotypes and constraints, and the allocation of functions between the human and the machine.
An important part of the pre-design analysis is the study of a group of potential system users, in the course of which the color, motor, and other stereotypes of this social and (or) professional group are identified, as well as the restrictions imposed by such factors as the capabilities and anthropometric characteristics of potential users.
The composition of the experts must be taken into account, since the results of an expert evaluation largely depend on the perceptual characteristics of each expert. Therefore, different experts should be involved in the expert evaluation. In his work, Jakob Nielsen developed a formula that allows determining the number of problems found depending on the number of experts.
Using formula (4.4), it is possible to determine the optimal number of experts for a specific case. The minimum number of experts for which it makes sense to conduct an evaluation is three. Jakob Nielsen states that the best results are obtained with the participation of five experts, who can identify 75 to 80% of all errors.
Advantages of the interface evaluation method:
- speed and low cost of obtaining an assessment of the designers' work;
- detection of usability problems, such as color scheme, fonts, element placement, etc.;
- the possibility of obtaining ideas for improving the interface;
- identification of specific problems that cannot be detected by other methods.
Disadvantages of the method:
- good solutions are not reflected in the report;
- inability to detect UI errors related to card sorting;
- the need to use it together with other methods, for example, the sorting method.
Interface design requires taking into account conditions of use, such as the user's physical parameters, experience with similar interfaces, and ergonomic standards. Future users must be involved in the design process to achieve an optimal result. Verification of the interface makes it possible to check compliance with the original technical requirements, while validation makes it possible to confirm the real possibility of users solving tasks under conditions as close to real as possible.
Functional design aims to determine the set of capabilities for effective and high-quality operator work. Its basis is functional analysis, which includes the hierarchy of functions and information transformation processes. Task analysis makes it possible to take into account the cognitive and activity-related components of performing operations, which leads to emotional relief and a reduction in time and errors.
Visual design represents the system's information model for effective human perception. Information design includes methods of presenting information, such as grouping, categorization, and visual coding. Visual coding uses properties of visual objects, such as shape, color, and location. For information to be interpreted correctly, it is necessary to use adequate coding methods and unambiguous code alphabets, and to take into account users' stereotypes and habits.
More detail on the ecological interface is given in its concept. The visual design of the interface is aimed at creating a comfortable and attractive interface that effectively manages user attention and determines the direction of eye movement. The layout of information and controls is aimed at reducing the load on the user's memory and improving the quality of information perception. Poor visual design can lead to increased psychological work strain and the occurrence of errors. Visual noise and clutter are also common visual design problems.
We encounter various stereotypes related to directions and colors, which may depend on the user's previous experience. Using several codes simultaneously and applying codes consistently helps avoid ambiguity. Grouping visual objects is also important to avoid clutter and visual noise, which distract attention and tire the user. Conflicting stereotypes and the difficulty of visualizing multidimensional information can also arise during visual design.
Designing user interaction with the system involves determining user behavior and the system's response to user actions, with the aim of minimizing the user's workload. This workload can include cognitive, mnemonic, visual, and physical work. Interaction is optimized by reducing any type of workload to an acceptable level.
Operators can perform primary and secondary actions. Primary actions are aimed at solving the main tasks of professional activity, while secondary operations ensure the performance of primary actions. Principles for designing effective interaction include simplifying the user's tasks, organizing physical and virtual space, and using hints to inform the user about the system's functions and to attract their attention.
There are many modern technical and software tools for creating interfaces, including virtual reality, touch technologies, wireless communication, stereoscopic and volumetric three-dimensional displays, as well as sophisticated manipulators. In the USA and Canada, in the early-to-mid 1990s, the concept of an "ecological interface" was introduced, analogous to ecological psychology, which describes an environment adapted for productive and comfortable task solving. In the United Kingdom, this approach was called a "task-oriented interface". K. Vicente proposes using advanced methods of visual coding and information presentation to help users quickly assess the state of a controlled object and make decisions. Special graphical images are created to support cognitive operations such as parameter comparison and trend extrapolation. This approach was used to create a prototype support system for the activity of an operator controlling the equipment of the forced multiple circulation loop of a nuclear power plant unit with an RBMK reactor.
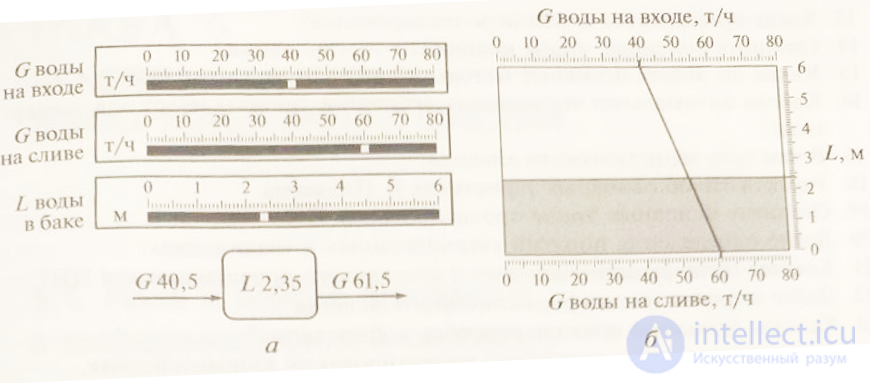
Fig. 4.8. Examples of interfaces: a — traditional; b — ecological
One of the problems of controlling the forced multiple circulation loop is regulating the level in the steam drum separator (SDS), which is very vulnerable to any disturbances in the technological process.
The material balance, and therefore the water level in the SDS, depends on:

Comments