
Lecture
The expressions given above can be used for an a priori estimate of the number of routes and the complexity of testing (the number of tests needed to cover all the selected routes) of program modules. For test planning, it is necessary to identify the dependencies of these characteristics on the number of operators in the program, its structure, and the criteria for selecting routes. This task can be solved experimentally, by counting the corresponding characteristics in real program modules used in various classes of software systems. To identify the general dependencies of program testing complexity, it is advisable to distinguish typical program structures, as well as those that make it possible to obtain the limiting (upper and lower) values of these characteristics.
Fig. 13.7 shows an example of the initial graph of a program module containing 14 vertices, 20 arcs and 3 loops. Such a program, of comparatively low complexity, contains about 30—50 statements in a high-level language and can be considered fairly typical. For a complete check of the module according to the first criterion, four routes are sufficient. This criterion guarantees verification of all control transfers between the program's statements and of each statement at least once. The longest route by number of vertices leaves uncovered only 3 vertices out of 14 and only 6 arcs out of 20.
After checking two more routes, one vertex and two arcs remain unchecked. However, this criterion does not take into account the combina-
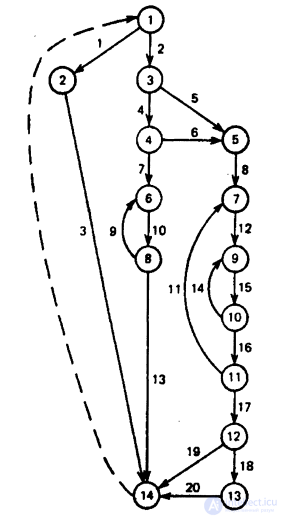
Fig. 13.7
torics of the combination of conditions at different sections of the routes, for example, in combinations of branching directions at vertices 3 and 12. The complexity of the program when selecting routes by this criterion is characterized by a number of routes equal to four and a testing complexity equal to 20. This value characterizes the total number of conditions that must be specified in the tests for a complete check of all the routes selected by the first criterion. The conditions at the vertices of each route can be used for the automated formation of predicates in the corresponding tests.
The second criterion for selecting routes in assessing testing complexity ensures, in the program's initial graph, a single check of each linearly independent acyclic route and each linearly independent loop, which together form the base routes. Each linearly independent route or loop differs from all the others by at least one vertex or arc. This criterion has been studied most fully in analyzing the correlation between the complexity and the labor intensity of program creation. The set of structures verified by this criterion is formed from three linearly independent loops and five linearly independent acyclic structures. In this case, the total complexity of the tests, taking into account all the conditions of passing the routes once, becomes equal to 25.
The most thorough, third criterion for verifying and determining the testing complexity of a program's structure includes the requirement for a single check not only of linearly independent, but also of all linearly dependent loops and acyclic routes. It consists in analyzing, at least once, each of the real acyclic routes of the program's initial graph and each loop reachable from all these routes. For the example of the program graph shown in fig. 13.7, this criterion requires executing 6 acyclic routes and 5 routes from which elementary loops are reachable. Implementing the selected routes in 11 tests requires specifying a total of 66 conditions. In this case, a feature of the last four routes with loops, as well as of the corresponding acyclic routes, is the complete enumeration of combinations of branches at vertices 3 and 12.
In real programs, some routes may turn out to be unrealizable due to the incompatibility of conditions that are sequentially analyzed at different vertices (for example, vertices 3 and 12 in fig. 13.7). On the other hand, for each realizable route, verification may be necessary with several passes through loops and several values of each processed variable. It is especially important to check loops with a conditional exit at one or two intermediate points, as well as with the maximum and minimum number of loop-execution cycles. As a result, the complexity indicator, the number of tests required, and the duration of verification increase accordingly.
To identify the main patterns and to assess the limiting characteristics of the structural complexity of PM testing, an analysis was carried out of the testing quality characteristics of abstract acyclic program modules and of a representative sample of real modules of complex software systems. A study of real PMs showed that more than half of them contain no loops, which made it possible to focus attention on them. It was assumed that after testing along any route, the probability of an error being present in each arc of the program graph is zero. Branching in programs on the target computer occurs every 5—10 program-text statements, so the number of execution routes of acyclic PMs is proportional to their volume, expressed as the number of lines of program text.
The analysis was carried out for two types of acyclic graphs, selecting routes by the criterion of covering each arc of the program graph at least once Xt and by the criterion of selecting all routes differing by at least one arc X2. Among those selected are structures covering the most typical variants of program graph components. The structures differed in graph width, as a result of which the number of routes and the complexity of complete testing of such structures differed. The testing complexity of a PM was assessed by the number of program execution routes, reflecting the number of tests, needed for a complete check of the correctness of the module's structure. In addition, as an indicator of structural testing complexity, the total number of conditions, that must be specified in the tests (testing complexity) for checking the module was analyzed.
Graph Tj was a symmetric ordered binary tree with maximum use of different branches and maximum width. In graph G2, on the contrary, the width is minimal, with only two completely different routes. When selecting routes by the first criterion, graph G2 has only two routes and they do not depend on the number of branching vertices. In graph G{ when selecting routes by the first criterion, their number increases linearly as the number of vertices increases. When selecting routes by the second criterion, their number is proportional to the total number of vertices for these types of graphs.
The structural complexity of testing PM graphs varies over a wider range than the number of routes, which determined the choice
of the logarithmic scale along the ordinate axis in fig. 13.8. The smallest structural complexity is characteristic of graph G2 when selecting routes by the first criterion. For such graphs, the structural complexity increases almost linearly depending on the number of vertices. When selecting routes by the second criterion, the same graph is characterized by the greatest structural complexity. At 30 or more vertices, the structural complexity of this graph is almost an order of magnitude higher than that of graph G{ at the same number of vertices. The relative difference in the testing complexity of these graphs under criterion X2 is approximately preserved as the number of vertices changes from 16 to 100. This distribution of structural complexity values across graph types is due to the difference in their width. Since the number of routes under criterion X2, depending on the number of vertices, changes practically the same way in all graphs, the determining factor for differences in structural complexity is the number of conditions analyzed in each route. All the vertices of graph G2 participate in all of its routes, which determined its greatest structural complexity.
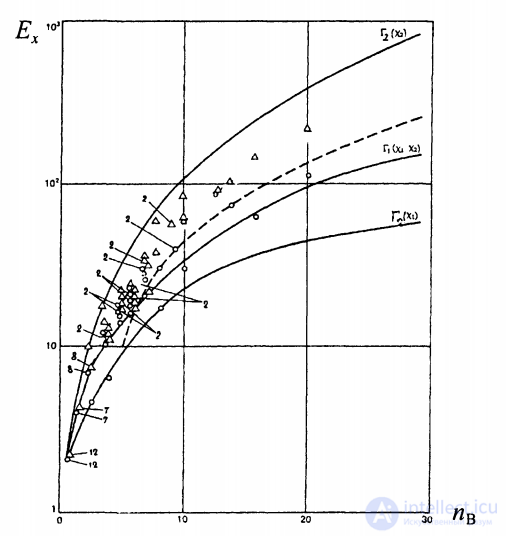
Fig. 13.8
In fig. 13.8, dots (indicating the number of coinciding values) mark the structural testing complexity values of about 70 real acyclic PMs in two systems. The characteristics of the abstract graphs Tj and G2 do indeed cover the range of variation of test complexity indicators for real programs, which group approximately in the middle under each criterion. The maximum test complexity under the second criterion for arbitrary acyclic programs is close to the square of the number of vertices. Under the same criterion, the minimum test complexity for wide, structured «tree»-type graphs is an order of magnitude less than the maximum complexity. For averaged estimates of the complexity of complete tests of arbitrary acyclic programs, a good approximation for engineering estimates at nv> 10 is given by the expression nv2/3 (dashed line in fig. 13.8). It is characteristic that a 4-fold increase in the number of vertices (from 32 to 128) for the graphs considered leads to an increase in structural complexity of more than 10 times. If, however, a program having 128 vertices is divided into 4 modules, then their total complexity is practically equal to only four times the complexity of modules containing 32 vertices each. The real PMs studied, in 80% of cases, contain no more than 10 vertices and have a structural testing complexity < 50.
It has been shown that, when developing a PM, it is advisable to take into account a rational limitation of module size at the level of three hundred lines of text, which corresponds to approximately thirty alternatives in acyclic programs. In this case, full coverage of such PMs with tests requires specifying up to 1000 conditions, which is usually rather difficult or practically impossible to implement. On average, complete testing of programs with 30 branching vertices is carried out with tests of total complexity of about 300—500. The total complexity of the tests needed for complete testing of programs having different structures can differ by several times.
Therefore, when developing a PM, a rational size of program modules is recommended within 100—200 lines of text, for the complete testing of which it is sufficient to use 10—20 tests with a total number of branching conditions up to 100. If the recommended PM sizes are exceeded, they are difficult to test completely, and it is advisable to divide them into smaller components accessible for practically complete test coverage.
To obtain practical estimates of the correctness of a program achieved when its structure is covered by tests, it is necessary to estimate the range of the real probability of error, allowed by a qualified programmer, initially in each arc of the program graph. It has been experimentally established that for weakly structured programs, the number of errors detected during the testing of program modules amounts to about one percent of the number of lines of text of these modules. For information-processing and control programs, the number of conditional transfers amounts to about 10% of the number of lines in the program, i.e. branching in the program occurs on average after the execution of 10 lines of text of linear sections. Consequently, about 10% of the linear sections (or arcs in the graph) of program modules may initially contain errors before testing, which corresponds to a probability qi}~ 0.1.
The use of structured programming rules, requirements specifications for modules and groups of programs, as well as modern programming technology, makes it possible to reduce the primary probability of errors by approximately an order of magnitude, i.e. to the level q(j ~ 0.01. Therefore, it is advisable to evaluate testing strategies and the correctness achieved thereby within the range qi} = 0.1—0.01, corresponding to practically the worst and best values of error probabilities in an arc before testing.
For the simplest estimates, one can assume that all arcs in the program graph have the same length and are equivalent in terms of the probability of errors occurring in them, i.e. qi} = const at the start of module testing. In reality, the arcs of real program graphs contain various types of statements, which are subject to distortions and errors to varying degrees. Statements in a program differ in their complexity and, correspondingly, in the probability of their being distorted by programmers during program creation. Depending on the type of statement in which the primary error occurs, the consequences of the resulting distortions (secondary errors) differ.
Planning the testing of program module structure and evaluating their correctness can be largely automated. If routes for which testing has already been performed are recorded, they can be automatically excluded from notifications, and only the group of routes subject to priority verification can be issued for registration to testers. The same data can be used for the automatic calculation of the completeness of the verification performed and for assessing the structural correctness of the program achieved according to each of the criteria for selecting routes.
The analysis of structural correctness of programs considered within a module can be extended to groups of interacting modules. In this case, each module should be regarded as a closed structure characterized by a previously assessed structural correctness. In the graph of a group of interacting modules, the set of execution routes of this group can be identified and the completeness of their testing monitored. By successively enlarging the selected groups of such modules from the bottom up, it is possible to test them in an orderly manner and to assess the achieved structural correctness of groups of programs and of the software system as a whole.

Comments