
Lecture
By the number of properties characterized:
Single (unitary)
Complex
Product quality indicator is a quantitative characteristic of one or several properties of a product that make up its quality, considered in relation to specific conditions of its creation, operation, or consumption.
Each type of product is characterized by its own nomenclature of quality indicators, which depends on the purpose of the product. For multipurpose products, this nomenclature can be very extensive. A product quality indicator can be expressed in various units (for example, km/h, hours to failure), in points, or it may also be dimensionless.
A product quality indicator that characterizes one of its properties is called a single (unitary) product quality indicator. Examples of single indicators can include power (of an engine), calorific value (of fuel), and mean time between failures.
A product quality indicator that characterizes several of its properties is called complex.
Depending on the area of application, different methods of assessing software quality are used
If the product being evaluated has all relative quality indicators Ki>=1, then its quality level is higher than or equal to the baseline; if all Ki<1, then it is lower.
There may be cases where some values of Ki>=1 and some Ki<1. In this case, all indicators must be divided into two groups. The first group should include indicators reflecting the most significant properties of the product, and the second should include secondary indicators.
If the relative indicators of the first group and most of the relative indicators of the second group are greater than or equal to one, then the quality level of the product being evaluated is not lower than the baseline.
If, for the first group, some of the values are Ki><1, then a comprehensive assessment of the quality level must be carried out.
The limitation on applying the differential method of quality level assessment lies in the difficulty of making a decision based on the values of many single quality indicators.
The next group of indicators, depending on the stage at which the values are determined
Predicted quality indicators are assessed for the future. For this purpose, possible values of quality indicators for a future period of time are determined based on an analysis of quality data, that is, with a certain degree of probability, the requirements of potential consumers and the anticipated values of the quality indicators of products capable of satisfying those requirements are estimated.
Design quality indicators are established at the stage of direct product development. Here, the class and type of the product and the conditions of its operation are determined. Current consumer requirements are assessed, and the best baseline samples are selected. The optimal value of the quality indicators is identified.
Production indicators are assessed at all technological stages of product manufacturing.
Operational quality indicators can be assessed during the actual operation of the product. For example, the level of vibration when a refrigerator is running. These indicators are often used in quality assessment, in determining the total useful effect of operation, and so on.
. Probability of failure-free operation P(tz) – this is the probability that a system failure does not occur within the specified operating time.
2. Probability of failure – the probability that a system failure occurs within the specified operating time.
This is the indicator inverse to the previous one.
Q(t z) =1 – P(t z) (2.1)
where t z – specified operating time, h.;
Q(t z) – probability of failure.
3. System failure rate – this is the conditional probability density of a PI failure occurring at a given point in time, provided that no failure has occurred before that time.
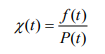
where f(t) – is the failure probability density at time t.
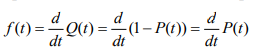
The following relationship exists between the system failure rate and the probability of failure-free operation
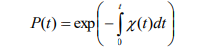
In the special case, when
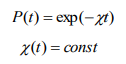
If, during testing, the number of failures over a specific time interval is recorded, then the system failure rate is the number of failures per unit time.
Mean recovery time T - the mathematical expectation of the recovery time - t; the time spent on detecting and localizing the failure - t; the time to eliminate the failure - t; the time for the throughput operability check - t: t = t + t + t, where t - the recovery time after the i-th failure. n T = i/nt, i=1 where n - is the number of failures. For this indicator, the term "time" means the time spent by the testing specialist on the listed types of work. 6. Availability factor K - the probability that the PI is expected to be in an operable state at an arbitrary point in time of its use for its intended purpose: K = T / (T + T). It is necessary to strive to increase the reliability level of the PI, but achieving 100% reliability lies beyond what is possible. Quantitative reliability indicators can be used to assess the achieved level of programming technology, and to select the design method for a future software system. The main means of determining quantitative reliability indicators are reliability models, by which is meant a mathematical model built to assess the dependence of reliability on parameters that are known in advance or estimated during the creation of software systems. 7. All the reliability indicators given above characterize the presence of program errors (production defects), but none of them characterizes the nature of these errors and their possible consequences. Therefore, it is proposed to introduce a new software reliability indicator – mean error severity (MES): B=1/Q SUM(bi*pi*zi) ,(2.8) where Q – is the probability of software failure; SUM – is the summation operator over the variable i; bi – is the membership function of the severity of the consequences of an error that occurred with the i-th set of input data, relative to the maximum severity of consequences; pi – is the probability of entering the i-th set of input data during software operation; zi – is a dichotomous variable equal to 1 if a failure was recorded for the i-th set of input data, and 0 otherwise; m – is the total number of sets of input data. The value of the MES reliability indicator lies within the interval [0;1]. The closer the MES value is to one, the more severe the consequences of software errors, and the less reliable the program. The closeness of MES to zero indicates the insignificance of the consequences of the program's errors. The introduction of the new software reliability indicator made it possible to distinguish, by reliability, software products whose failure probabilities are of the same order. Moreover, when speaking about software reliability, the user wants to obtain not so much error-free software as safe software. It is precisely software safety that MES characterizes. The value of this indicator is subjective and can differ for the same software product depending on its area of application. This is explained by the fact that when using a specific piece of software, for example, for performing student calculations and for performing design calculations in the space industry, the consequences of the program's errors are not comparable. In a number of cases, if strict requirements are imposed on the software, it is better to assess the maximum severity of the software's errors. Thus, by assessing the probability of software failure and the software's MES, we obtain a comprehensive assessment of software reliability
2.2. Methods for assessing the reliability of technical means
Calculation methods for reliability assessment
Reliability calculation based on mathematical logic models. The reliability calculation of technical means based on mathematical logic models is carried out in the following sequence.
Verbal formulation of the operability conditions. Let there be given the structure of some data transmission path consisting of elements a,b,c,d,e (Fig 2.2). The verbal formulation of the minimum necessary conditions for the path's operability is as follows: «The path is operable if the following channels (elements) are operable: 1) a and d, or 2) a, c and e, or 3) b and e, or 4) b, c and d».

Writing the logical operability function Fl. When writing the logical operability function, the basic logical operations of mathematical logic are used (Fig. 2.3): disjunction (OR), conjunction (AND); negation (NOT).
Thus, the logical operability function for the example under consideration (see Fig. 2.2.) can be represented in the form

Transformation of the logical operability function Fl by minimizing it and eliminating repeating terms. For this, the following formulas of mathematical logic are used:

Using formula 9, we expand the original logical operability function Flin order to eliminate repeating terms and obtain:

Let us simplify the expression in the first curly brackets using formula 10 (distributivity) and formula 11 (commutativity):

The final logical operability function takes the form:

Replacing the logical operands in Fl with arithmetic ones (obtaining Fp). The replacement is carried out according to the following rules 
Using these rules, we transform Fl into Fp and obtain the operability function in the form

Replacing the simple events in Fl with their probabilities. In the expressions Fl the simple events (statements) a, b, c, d, e are replaced by their probabilities Pa, Pb, Pc, Pd, Pe, and formulas are obtained for calculating the probability of the operable state of the data transmission path:
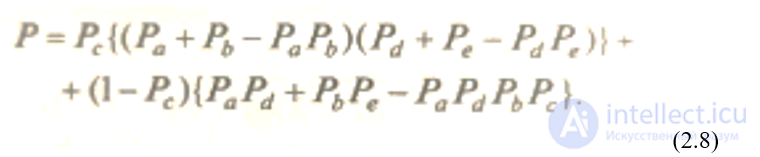
Substitution of numerical values of the probabilities of the states of the elements into the obtained formula for P, and obtaining the numerical value of P.
Method of structural transformations in reliability calculations
The complexity and difficulty of reliability calculations is caused by the complexity of the research objects themselves. Therefore, before starting to calculate the reliability of a system, it is always necessary to analyze the possibility of transforming the complex structure under consideration, that is, to make it simpler and more convenient for carrying out calculations. The most convenient structures are those consisting of elements connected in series or in parallel.
One of the methods of structural analysis, within the framework of which complex structures are decomposed into simpler ones, is the method of decomposing a complex structure by a key element.
The essence of the method consists in replacing the complex structure with two simpler ones. In this case, the sum of the probabilities of the operable states of these simple structures must be equal to the probability of the operable state of the original complex structure. The method is based either on the decomposition formula of the logical operability equation, or on the total probability formula that follows from it.
Let us consider the decomposition of the structure (see Fig. 2.2) into two simpler series-parallel structures. Element c is chosen as the key element. Let element c be in an operable state. In this case, a rigid connection can be put in place of element c, and the original structure can be transformed into a simpler structure 1, in which element c is connected in series (Fig. 2.4.)
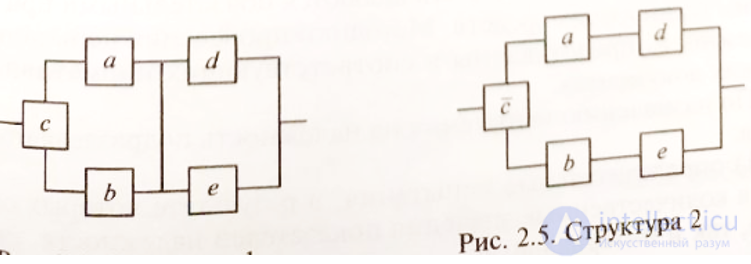
If we assume that element c is in an inoperable state, then its position in the structure should be denoted by a circuit break, and the original structure can be transformed into structure 2 (Fig. 2.5.)
The general rule for decomposing a complex structure by a key element:
1) select the key element (with the largest number of connections) – x;
2) close the circuit at the location of element x – this is the first simple structure;
3) break the circuit at the location of x – this is the second simple structure;
4) multiply the probability of the failure-free state of the first structure by the probability of the failure-free state of element x and obtain P1 = P1cPx;
5) multiply the probability of the failure-free state of the second structure by the probability of failure of element x, i.e., obtain P2 = P2c(1 – Px);
6) sum the probabilities P1 and P2 and obtain the probability of the operable state of the original structure.
Reliability assessment taking into account software reliability.
Methods for calculating the reliability of an information system that take software reliability into account are not yet regulated by normative and technical documents. The general focus and sequence of the software reliability calculation basically coincides with the methods for calculating the reliability of technical means. At the stages of program development and debugging, they are assessed for compliance with the requirements of the technical specification. Based on the results, the reliability characteristics of the programs are evaluated, which should reflect:
Failure rate of the program (detected and predicted);
Probability of failure-free operation of the software implementation (detected and predicted);
Predicted mean recovery time of the software after failures.
The reliability calculation is carried out either by an approximate method, or by taking into account the influence on the information system's reliability of the software reliability determined at the stage of joint reliability testing of the technical-means-and-software complex.
Approximate method. A fictitious block is included in the structure being evaluated – a software item with reliability characteristics obtained either from the software item's data sheet, or from the results of its testing. Then, using the methods considered, the reliability of the entire structure is calculated. Even such an approximate calculation makes it possible to give a comparative characterization of the influence of the technical means and the software on the reliability of the information system. We assume that software errors follow an exponential distribution. Initial data - 
Method that takes into account the influence on system reliability of the software reliability determined at the stage of joint testing of the technical-means-and-programs complex. The calculation is carried out according to the usual rules, i.e., using logical models, structural diagrams, and event graphs. Hardware-software reliability indicators are used as the system's reliability indicators, i.e., the reliability indicators of the software-controlled parts of the information system under the control of the actual program. Naturally, this results in different values being obtained for the information system's reliability indicators for the various functions it implements. In fact, functional reliability is being calculated, since the reliability of performing each function is being investigated.

Comments